Full Length Research Paper

ABSTRACT
INTRODUCTION
Fructosyltransferase (FTase) are enzymes (E.C.2.4.1.9) that catalyzed the transfer of fructosyl residue from sucrose to another sucrose molecule or a growing fructose chain (Fernandez et al., 2007). FTase is produced by many fungal and bacterial strains (Ganie et al., 2014; Prapulla et al., 2000), where they are implicated in the biosynthesis of fructans (levan, inulin, graminant, phlein, etc.) (Fernandez et al., 2007). In microorganism, FTase is responsible for the production of fructooligosaccharides (FOS) (Antosova et al., 2008). FOS is extensively used in food and pharmaceutical industries because of their functional properties. It is present in some commonly consumed foods like fruits, vegetables, cereals and honey in trace amounts (Sangeetha et al., 2004a). However, the productions of FOS using FTase derived from microorganisms have attracted attention in the recent years (Yun et al., 1997). The enzymes were produced from a wide variety of micro-organisms such as Aspergillus niger, Aspergillus phoenici and Aspergillus foetidus (fungi), Saccharomyces cerevisae (yeasts), Bacillus macerans and Streptococcus salivarius (bacteria), respectively (Le Gorrec et al., 2002; Almeciga-Diaz et al., 2011; Han et al., 2011).
The cost of an enzyme is one of the main factors determining the economy of a process. Reducing the costs of enzyme production by optimization of the fermentation medium and process is the goal of basic research for industrial application. A group of researchers reported on the isolating and screening of microorganisms for FTase production with higher activity (Fernandez et al., 2007; Yun et al., 1997; Le Gorrec et al., 2002), purifying and characterizing newly found enzymes (Prapulla et al., 2000; Sangeetha et al., 2004b; Lee et al., 1982; Heyer and Wendenburg, 2001). Antosova et al. (2008) separated fructosyltransferase from Aureobasidium pullulans and described its kinetic properties. Recently, Nemukula et al. (2009) isolated, purified and characterized fructosyltransferase from Aspergillus aculeatus. The influence of operating conditions on the synthesis of short chain fructo-oligosac-charides was also examined using random surface methodology. However, there is much less information available on optimization for FTase production. It is believed that with further optimization using a statistical tool such as response surface methodology (RSM), further increase in enzyme activity could be attained. It was reported that application of statistical experimental design techniques in fermentation process development could results in improved product yields and reduced process variability, development time and overall cost (Tari e al., 2007; Elibol, 1999).
The response surface methodology (RSM) is a powerful technique for testing multiple process variables because fewer experimental trials are needed. Conventional method of optimization involves varying one parameter at a time and keeping others constant. This method is extremely time consuming and often does not bring about the effect of interaction of various parameters (Elibol, 1999). The single dimensional search is laborious and less capable of reaching true optimum due to interactions among variables (Soni et al., 2007). In order to overcome this difficulty and determine the interaction between the studied variables, an experimental factorial design and response surface method were employed for the optimization process.
Penicillium simplicissimum, a strain isolated from the soil, had showed high galactosyltransferase activity when incubated in highly concentrated lactose solution (Cruz et al., 1999). Luonteri et al. (1998) previously reported that substrate specificities of three α-galactosidase of this strain (AGLI, AGLII and AGLIII) were determined by using various isolated galactose containing oligosaccharides and polymeric galacto(gluco)mannans. In fact this species had also been used to study the effect of glucose, ammonium, nitrate or phosphate limitation on the excretion of tricaboxylic acid (TCA) cycle intermediates in continuous system (Galmetzer and Burgsteller, 2002). In terms of lead and copper biosorption, P. simplicissimum was immobilized on loofa sponge in batch experiments (Li et al., 2008). Though P. simplicissimum had been utilized in various ways, to our knowledge, there is no scientific literature on statistical optimization for FTase production by this species. In this study, screening of selected micro- and macro-fungi for the production of FTase in shake flask culture were addressed. Optimization of growth (biomass) and FTase activities (intra- and extra-cellular) either using one-factor-at-a-time method or using a response surface methodological (RSM) approach were also described.
MATERIALS AND METHODS
Screening of isolates
Six strains of macro-fungi namely Trametes lactinea, Trametes feei, Trametes pocas, Pycnoporous sanguineus, Lentinus sajor caju and Schizophyllum commune and 11 strains of micro-fungi namely Penicillium purpurogenum, Penicillium islandicum, P. simplicissimum, Penicillium rubrum, Aspergillus niger, Aspergillus terreus, Trichoderma viride, Penicillium clarifame, Penicillium variable, Penicillium spinulosum and Penicillium enopansum were used in this study. All the tested strains were from the Forest Research Institute Malaysia (FRIM), Kepong, Selangor and University of Malaya, Kuala Lumpur, Malaysia. The strains were grown on potato dextrose agar and were maintained at 4°C.
Screening experiments were carried out in a rotary shaker using 250 ml unbaffled Erlenmeyer flask with 100 ml culture medium, comprised of (g/l): sucrose 10, malt extract 10 and NH4Cl 1. The pH of the medium was adjusted to 5.6 prior sterilization. The flask were then inoculated with loopfuls of cells from the tested strains and incubated in the rotary shaker at 30°C, 250 rpm for 48 h. Samples were harvested and analyzed for biomass and FTase activities (extracellular and intracellular).
Microorganism and inoculum preparation
Fungal strain which was of higher FTase activity was chosen for subsequent studies. The strain was grown on potato dextrose agar at 20°C. The inoculum was prepared by transferring a loopful of spores from 3-day-old slant to 100 ml medium containing 1% (w/v) sucrose and 0.2% (w/v) yeast extract at pH 5.5 in 250 ml flasks, which were previously sterilized at 121°C for 20 min. The flasks were incubated at 33 ± 1°C on rotary shaker at 250 rpm for 24 h.
Production of FTase
Erlenmeyer flask (250 ml) composed of KH2PO4 (11 g/l), NH4Cl (6 g/l) and yeast extract (10 g/l) were incubated in an orbital shaker according to the condition that resulted from the experimental design as in Table 1. After fermentation, the contents were filtered through Whatman filter paper (No. 1). The culture filtrate thus obtained was centrifuged at 8000 rpm for 20 min and the clear supernatant was used as enzyme sources.
Enzyme assay and analytical methods
Fructosyltransferase (FTase) activity was determined by measuring the release of reducing glucose in the reaction mixture as described by Sangeetha et al. (2004) with slight modification. 2.5 ml of 60 g/l sucrose was added to 0.5 ml of 0.1 M citrate buffer (pH 5.5) and 0.5 ml enzyme solution. The reaction mixture was incubated at 55°C for 1 h. The enzyme reaction was stopped by heating at 100°C for 15 min and the released glucose was measured using HPLC (CTO-10AS, Shimadzu, Japan) with refractive index detector using the polar bonded phase column (Kromasil LC-NH2, 4.6 mm × 25 cm, 5 µm) at room temperature. The mobile phase was acetonitrile: water (75:25) at a flow rate of 1.0 ml/min. One fructosyltransferase unit is defined as the amount of enzyme activity required to produce one micromole of glucose per minute. The biomass was determined using dry cell weight method as described by Sangeetha et al. (2004b). The results were expressed as g/l.
Optimization by response surface methodology
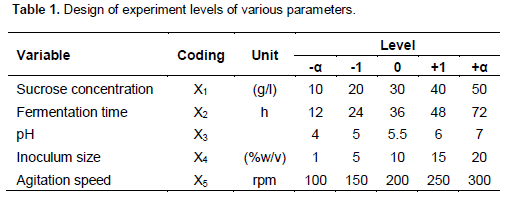
Five experimental factors, sucrose concentration, initial pH, agitation speed, inoculum size and fermentation time were chosen for optimization of growth and enzyme production by the highest FTase producer. Response surface methodology using five factors and 5 level central composite designs were used to optimize the response of variables. Each factor in the design was studied at five different levels (-α, -1, 0, +1, +α) (Table 1). All variables were taken at a central coded value and considered as zero. The minimum and maximum ranges of variables were investigated and the full experimental plans with respect to their values in actual and coded form are listed in Table 1. The biomass and enzyme activity were studied as response. This criterion was used in all experimental designs and analyzed with the aid of Design Expert ver. 6.0.6 statistical software (Stat-Ease Inc, Minneapolis, MN). The biomass production and enzyme activity were analyzed using analysis of variance (ANOVA) combined with Fischer test to evaluate if a given term has significant effect (p≤ 0.05). The optimum levels of variables were obtained by graphical and numerical designs using Design expert program.
RESULTS AND DISCUSSION
Screening of fungal isolates for FTase production
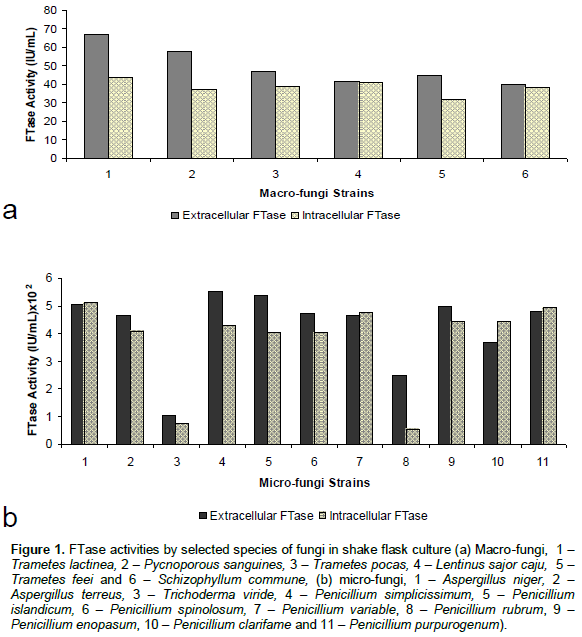
Seventeen (17) fungal isolates from different families (Trametes, Pycnoporous, Lentinus, Schizophyllum, Penicillium, Aspergillus and Trichoderma) were screened for extra- and intracellular FTase activities and the results are shown in Figure 1. Under such cultivation conditions (pH 5, 30°C, 250 rpm for 48 h), FTase activities of all the strains ranged from 40 IU/ml (Scyzophyllum commune) to 506 IU/ml (P. simplicissimum). Most of the macro-fungi cultures were incubated longer because of a slower growth in potato dextrose agar (Figure 1a). The 24 h growth of the tested strain in sucrose submerged culture of shake flask showed that P. simplicissimum attained the highest growth at 3.8 g/L and 506 IU/ml for extracellular and 128 IU/ml for intracellular FTase activities, respectively.
Optimization using one factor at-a-time
Fermentation optimization by employing one factor at a time method involved changing one independent variable while fixing others at a certain level (Galmetzer and Burgsteller, 2002). Process parameters such as initial sucrose concentration, fermentation time, pH, inoculum size and agitation speed were included in this study.
Effects of initial sucrose concentration
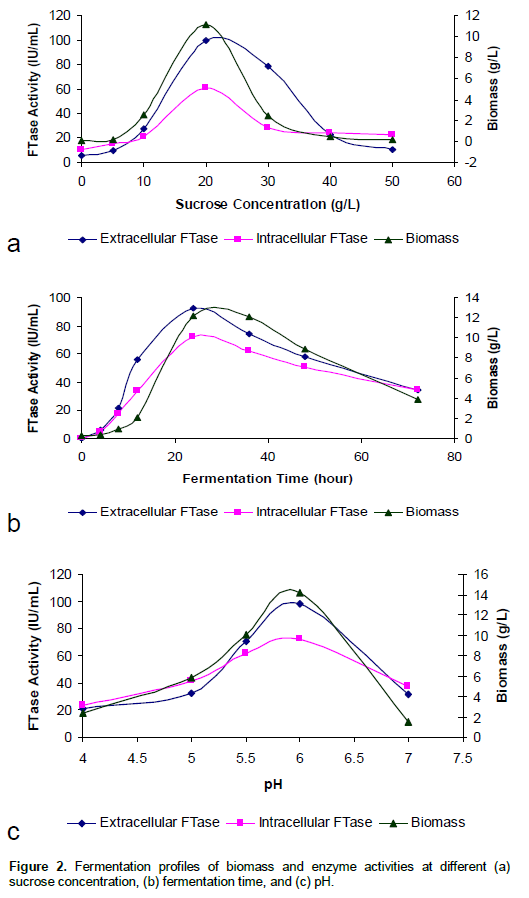
The effects of different sucrose concentrations (10-50 g/l) on cell growth, extracellular and intracellular FTase activities were investigated (Figure 2a). The higher the sucrose concentration, the higher the biomass and FTase activities. Beyond 20 g/l of initial sucrose concentration, a reverse trend was observed. The maximum biomass and extracellular FTase were detected at 11.23 g/l and 99.46 IU/ml (Figure 2a), respectively. This may be attributed to higher sugar content and reduction in water activity as sucrose was a disaccharide, thus increasing its osmotic pressure and cause more substrate inhibition to the cells (Siqueira et al., 2008). This indicated that substrate concentration has a considerable effect on the distribution of fermentation products, as substrate utilization rates could be significantly influenced by the substrate concentration (Mu et al., 2006).
Effects of fermentation time
Figure 2b shows the fermentation profiles for growth and FTase activities over 72 h fermentation periods. After a lag period of 4 h, both biomass and FTase activities increased exponentially, reaching maximum at 12.16 g/l, 92.76 IU/ml (extracellular) and 69.98 IU/ml (intracellular), and later declined gradually till the end of the fermentation period. Kumar et al. (2008) reported that microbial enzyme reached its maximum production during log or late log phase (stationary phase). In stationary phase, nutrients might have been utilized mostly for cell multiplication and compensation of cell death (Anisha et al., 2008).
Effects of pH
FTase production is also influenced by the pH of the culture medium. To investigate the effect of pH on bioconversion of sucrose to glucose, it would be important to keep this parameter constant at the beginning of the fermentation period. Figure 2c shows the biomass and FTase activities profiles by P. simplicissimum. The highest FTase activity (extracellular) was observed at pH 6.0 which corresponded to 98.46 IU/ml after 24 h. At pH 4.0 to 5.5, both of the FTase activities were relatively low compared to pH 6.0. Similar effect of initial pH also occurred for the sucrose-to-glucose bioconversion by the FTase of Aspergillus oryzae CFR 202 in solid state fermentation using agricultural by-products (Sangeetha et al., 2004). FTase activity was significant only when the pH of the extract was in the pH range of 5-7. At acidic pH, the enzyme activity was less.
Effects of inoculum size
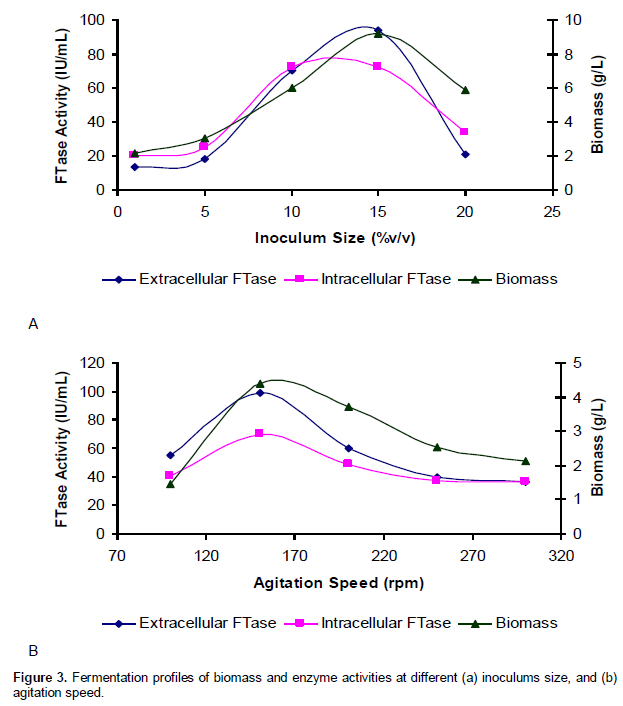
Inoculum concentration or size also played a crucial role in the determination of growth and enzyme production in submerged culture (Mukherjee et al., 2008). It is therefore important to select the suitable inoculum in respect to type, size and age to obtain a high yield of the desired product (Enshasy et al., 2000). As can be seen in Figure 3a, a lag phase of 4 h was observed for all biomass and enzyme activities. It then increased exponentially reaching the peak biomass of 9.16 g/l, extra- and intracellular FTase of 93.81 IU/ml and 65.98 IU/ml at 15% (v/v) inoculum concentration, respectively. Beyond this, a reverse trend was observed.
According to the study of Mukherjee et al. (2008), increase in inoculum size beyond 15% (w/v) resulted in steady decline of FTase activity and biomass which might be due to exhaustion of nutrients in the fermentation medium. In contrast, the lower inoculum size required longer time for the cells to multiply to a sufficient number for the maximum substrate utilization, thus resulting in lower enzyme yield (Ramachandran et al., 2004; Siqueira et al., 2008).
Effect of agitation speed
The effect of agitation on growth and FTase activities are shown in Figure 3b. An agitation of 150 rpm supported maximum biomass of 4.38 g/l and FTase activities of 98.79 IU/ml (extracellular) and 69.33 IU/ml (intracellular), respectively. Singh and Bhermi (2008) reported that at higher agitation speed increased the amount of dissolved oxygen and dispersion of macromolecules in the medium. It might contribute to the greater growth and enzyme production. However above 150 rpm, the biomass and enzyme activities tend to reduce gradually. This could be due to the shearing effect which was induced by the higher agitation speed on the cells and enzyme inactivation, thus contributing negatively towards cell growth and enzyme stability. According to the study of Wang et al. (2005), in many fungal fermentations, a higher agitation rate was necessary to provide adequate mixing and mass transfer, especially when the fungal cells grew in a freely dispersed form which resulted in a non-Newtonian broth and higher apparent viscosity. However, the mechanical forces induced by the rotating shaft could cause mycelia damages. Thus, agitation rate should be limited to a range that could avoid exerting high shear stress on fungal mycelia.
Optimization using random surface methodology (RSM)
RSM is an empirical statistical modeling technique employed for multiple regression analysis using quantitative data obtained from properly designed experiments to solve multivariable equations simultaneously (Rao et al., 2000). It was used to optimize process parameters for the production of FTase by Penicillium simplicissimum in shake flask culture.
A central composite experimental design (CCD) for five independent variables was used to obtain the combi-nation of values to optimize the response within the region of three dimensional observation spaces, which allowed one to design a minimal number of experiments (Tang et al., 2004).
Statistical experimental design
Table 2 shows the design matrix of the variables and the experimental results for growth and FTase activities of P. simplicissimum. The design independent variables and their range are classified in Table 1. Using multiple re-gression analysis on the experimental data, the following second-order polynomial equations were found to fit the extracellular FTase (YEXT), intracellular FTase (YINT) and biomass (YB), respectively.
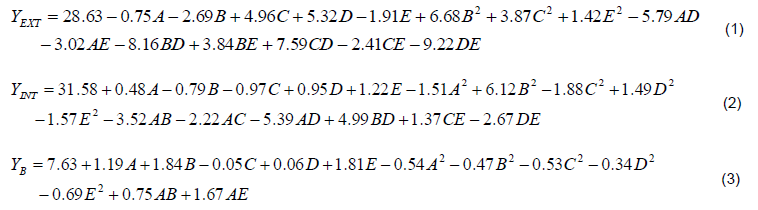
Where, YEXT (IU/ml) and YINT (IU/ml) are the response factors for extracellular FTase, intracellular FTase and YB (g/l) for the cell biomass. A, B, C, D and E are values of independent factors for sucrose concentration (% w/v), fermentation time (h), pH, inoculum size (% v/v) and rate of agitation (rpm). In order to verify the validity of the models, it is necessary to conduct an analysis of variance (ANOVA) as presented in Table 3.
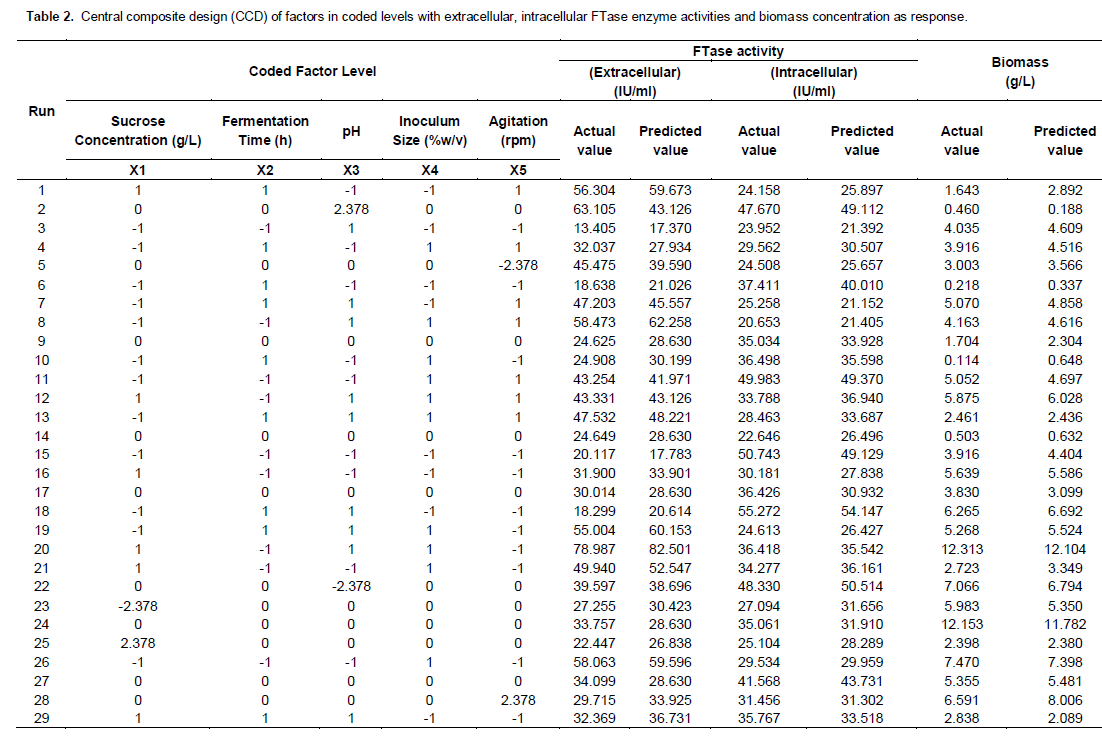
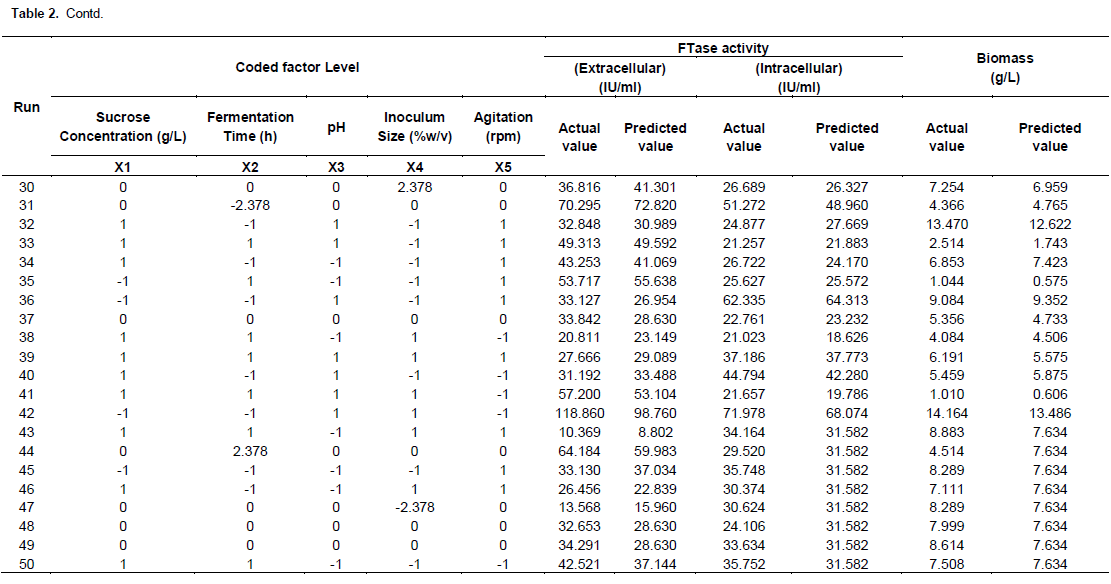
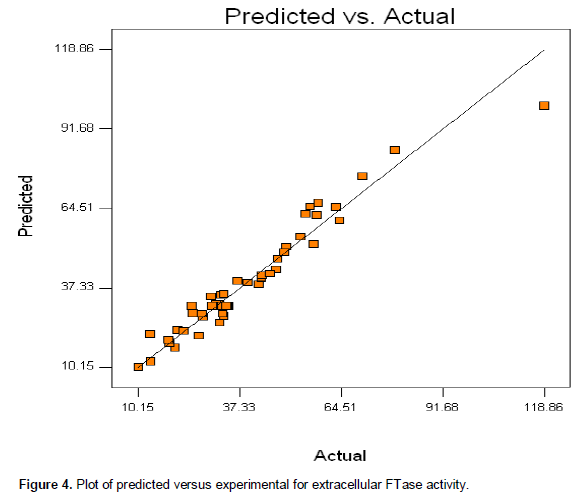
Table 3 shows that the regressions for biomass, extracellular and intracellular FTase models were significant (44.68, 47.10 and 33.21) and those lacked of fits were not significant (0.33, 1.25 and 0.63) at p < 0.0001 relative to pure error. The fit of the models were checked by the determination of coefficient, R2. The R2 value provided a measure of how much variability in the observed response values can be explained by the experimental factors and their interactions. The R2 value always lied between 0 and 1. The closer the R2 value to 1.00, the stronger the model was and the better it predicted the response. In this case, the value of R2 for biomass, extra- and intra-cellular FTase were 0.942, 0.954 and 0.942, respectively. These values showed that 5.8, 4.6 and 5.8% of the total variables were not explain by the models. The ‘Pred R2’ of 0.8934 and 0.8669 for extracellular and intracellular FTase production and 0.8677 for biomass production were in reasonable agreement with the ‘Adj R2’ of 0.9388, 0.9132 and 0.9026. This indicated a good agreement between the experimental and predicted values for FTase and biomass production. The adjusted R2 corrected the R2 value for the sample size and for the number of terms in the model. If there are many terms in the model and the sample size is not very large, the adjusted R2 may be noticeably smaller than the R2. This should be a caution signal as too many terms were present in the model (Haaland, 1989). The plot of predicted versus experimental extracellular FTase activity is shown in Figure 4, with R2 = 0.954, thus indicating an excellent adequacy of the proposed model.
Interaction of parameters
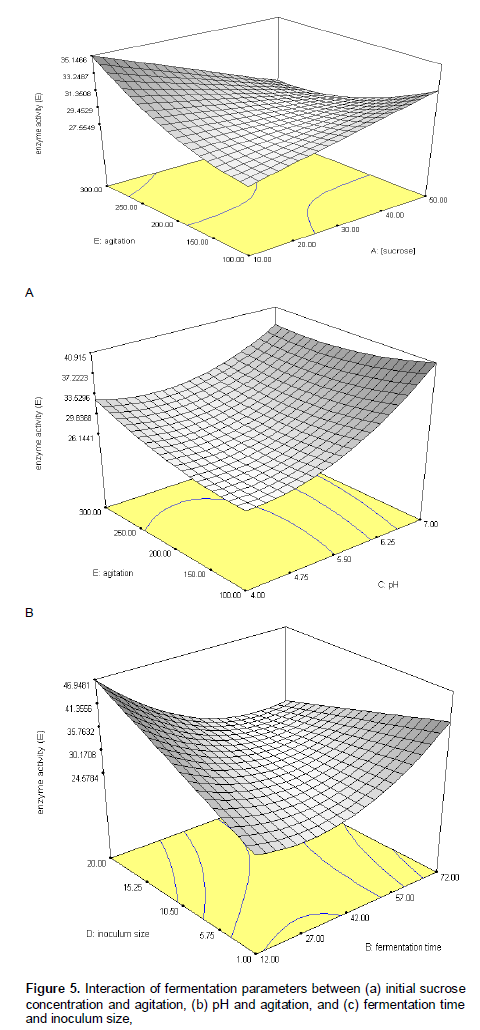
The three-dimensional response surface curves were plotted to study the interaction among different parameters to find out the optimum condition for extracellular FTase activities. Intracellular FTase activity was not explained as the trend of the response surface plot was similar to extracellular FTase. Figure 5a shows the response of extracellular FTase with respect to initial sucrose concentration and agitation. An increase in agitation speed from 200-300 rpm with initial sucrose concentration 10-20 g/l induced the extracellular FTase activity to 35.15 IU/ml. However, the enzyme activity tends to reduce as the concentration of sucrose increased to 60 g/l though the agitation speed was higher (300 rpm). According to the study of Chen and Liu (1996), sucrose was the best inducer for β-fructofuranosidase (FFase) or β-D-fructosyltransferase (FTase) production by A. japonicas TIT-90076 and enzyme yield was suppressed at initial sucrose concentrations greater than 25%. It is well known that with increase in the sucrose concentration, the osmotic pressure also increased, thus eventually increasing the percentage of cell fractures (Quan et al., 2008). Previous study also indicated that some microorganisms grew best in medium that has slightly lower osmotic concentration than its own because this facilitated the diffusion of nutrients into the cells (Okafor, 2007). According to the study of Sangeetha et al. (2004b), enzyme activity decreased at higher sugar concentration. The predicted R2 values of extracellular and intracellular FTase production and biomass were in reasonable agreement with the adjusted R2. This indicated a good agreement between the experimental and predicted values for FTase and biomass production. The adjusted R2 corrected the R2 value for the sample size and for the number of terms in the model. If there are many terms in the model and the sample size is not very large, the adjusted R2 may be noticeably smaller than the R2. This should be a caution signal as too many terms were present in the model (Haaland, 1989). The plot of predicted versus experimental extracellular FTase activity is shown in Figure 4, with R2 = 0.954, thus indicating an excellent adequacy of the proposed model.
Interaction of parameters
The three-dimensional response surface curves were plotted to study the interaction among different parameters to find out the optimum condition for extracellular FTase activities. Intracellular FTase activity was not explained as the trend of the response surface plot was similar to extracellular FTase. Figure 5a shows the response of extracellular FTase with respect to initial sucrose concentration and agitation. An increase in agitation speed from 200-300 rpm with initial sucrose concentration 10-20 g/l induced the extracellular FTase activity to 35.15 IU/ml. However, the enzyme activity tends to reduce as the concentration of sucrose increased to 60 g/l though the agitation speed was higher (300 rpm). According to the study of Chen and Liu (1996), sucrose was the best inducer for β-fructofuranosidase (FFase) or β-D-fructosyltransferase (FTase) production by A. japonicas TIT-90076 and enzyme yield was suppressed at initial sucrose concentrations greater than 25%. It is well known that with increase in the sucrose concentration, the osmotic pressure also increased, thus eventually increasing the percentage of cell fractures (Quan et al., 2008). Previous study also indicated that some microorganisms grew best in medium that has slightly lower osmotic concentration than its own because this facilitated the diffusion of nutrients into the cells (Okafor, 2007). According to the study of Sangeetha et al. (2004b), maximum enzyme activity decreased at higher sugar concentration. At lower sucrose concentration, the reaction proceed faster thus producing more FTase (Mukherjee et al., 2008). This is in agreement with the results of other researcher (Tucker and Thomas, 1994; Antosova et al., 2008) who used Aspergillus japonicas, Aureobasidium pollulans and Aspergillus niger ATCC 20611 as their tested strain using sucrose as a substrate.
For the effects of agitation on extracellular FTase (Figure 5a), the higher the agitation speed, the higher the FTase activity. According to the study of Lee and Chen (1997), enzymes seemed to be affected by higher agitation speed as it may increase shearing effects into the cells. Moreover, the higher the agitation speed increased, the higher the amount of dissolve oxygen and dispersion of macromolecules in the medium. It might therefore have contributed to greater growth and enzyme production (Seth and Chand, 2000). However, the shearing effect induced by the higher agitation speed on the cells and enzyme inactivation may sometimes contributed negatively towards cell growth and enzyme stability (Seth and Chand, 2000; Lejeune and Baron, 1995). In fact, similar result can also be observed in this study.
In Figure 5b, an inclined form of three dimensional plot inferred that interaction between pH and agitations were evident with significant linear correlations. Higher extracellular FTase activity obtained at pH 6.25-7.00, is fairly similar to that of FTase or FFase from Arthrobacter enzyme (pH 6.5-6.8) but different from FTase or FFase from A. japonicas, A. niger, Penicillium and Aureobasidium (pH 5.0-6.0) (Lee et al., 1982; Chen and Liu, 1996; Lee and Chen, 1997; Sangeetha et al., 2004b). Generally, the effect of pH on microbial growth may be attributed to the hydrogen (H+) ion concentration. H+ can be considered as substrate under the pH range of 6.0 - 7.0 but act as inhibitor under acidic and alkaline pH. Additionally, the enzyme has almost no transfructosylating activity below pH 3.0 or above pH 10.0 (Sautour et al., 2003).
Inoculum size is another notable feature that influenced the FTase activities. As can be seen in Figure 5c, two interaction options were observed, in which, higher extracellular FTase activity were detected either at higher inoculums size with short fermentation time or lower inoculums size with longer fermentation time. Sangeetha et al. (2004b) reported that an optimal inoculum size in the fermentation process should be provided, as lower inoculum density may give insufficient biomass, whereas a higher inoculum density may produce too much biomass which depleted the nutrients necessary for the product formation. Generally, enzyme production attains its peak when sufficient nutrients were available to the biomass. Conditions with a misbalance between nutrients and proliferating biomass resulted in decreased enzyme synthesis (Shafiq and Haq, 2002). In other words, the critical inoculums level apparently depended on spore preparation, germinability, conditions during germination and medium composition (Tucker and Thomas, 1994). Similar results were also obtained in the present study, whereby, the highest FTase activity was 93.712 IU/ml at higher inoculums size within 12 h of the fermentation period. At lower inoculums size (1 % w/v), the highest FTase activities at 13.568 IU/ml was detected after 72 h. A decline in enzyme activity after 72 h of fermentation could be either due to decrease in nutrient availability in the medium, catabolic repression of the enzyme or the lag time. Antasova et al. (2002) reported that maximum FTase production was achieved on the 98 h, however in this study, the highest FTase activity was detected after 12 h of the fermentation period. This is more significant as compared to previous researchers as reduction of cultivation time reduced the cost of FTase production.
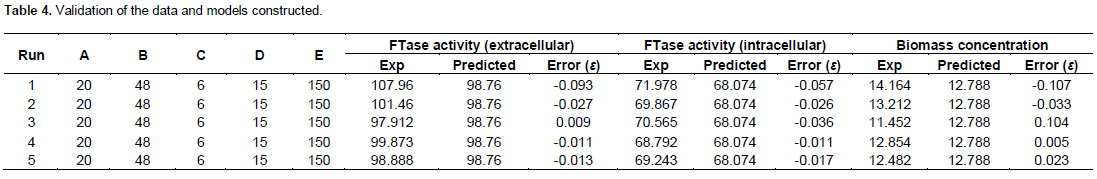
Validation of the models
In order to validate the adequacy of the model equations (Equations 1, 2 and 3), a total of five verification experiments for each response (extracellular, intracellular and biomass) were carried out under various fermentation conditions as presented in Table 4. The validation data were separately analyzed using the Design Expert ver. 6.0.6 statistical software (Stat-Ease Inc, Minneapolis, MN). The correlation coefficients (R2) between the experimental and predicted values were 0.954 and 0.942 for extracellular and intracellular FTase and 0.942 for cell biomass, with a significant level of p < 0.0001. The results of analysis indicated that the experimental values are in agreement with the predicted ones, and also suggested that the models of the equations were satisfactory and accurate.
CONCLUSIONS
To date, no reports are available in literature regarding the optimization of fermentation parameters for FTase production using RSM by P. simplicissimum. Therefore, this study will serve as a base line of the initial studies in this field. Through this optimization, the optimal conditions for maximum FTase activity were sucrose 20 (w/v), fermentation time of 36 h, pH 6, inoculum size of 15% (w/v) and 150 rpm rate of agitation. The developed parameters showed higher extracel-lular FTase activity of 118.86 IU/ml as compared to unoptimized parameters at 92.76 - 99.46 IU/ml. It should be noted here that the activities were obtained from crude enzyme that had not been purified and strain which did not go through any strain improvement step.
CONFLICT OF INTERESTS
The author(s) have not declared any conflict of interests.
ACKNOWLEDGEMENTS
This research was supported by Science Fund Grant (02-01-05-SF0100) by the Ministry of Science, Technology and Innovation (MOSTI), Malaysia. The authors would like to thank Dr. Noorlidah Ahmad from the University of Malaya and Dr Salmiah Ujang from Forest Research Institute Malaysia (FRIM) for the kind supply of the strains.
REFERENCES
|
Almeciga-Dıaz CJ, Gutierrez AM, Bahamon I, Rodrıguez A, Rodrıguez MA, Sanchez OF (2011). Computational analysis of the fructosyltransferase enzymes in plants, fungi and bacteria. Gene 484:26-34 Crossref |
||||
|
Anisha GS, Rojan PJ, Nicemol J, Niladevi KN, Prema P (2008). Production and characterization of partially purified thermostable [alpha]-galactosidases from Streptomyces griseoloalbus for food industrial applications. Food Chem. 111:631-635. Crossref |
||||
|
Antosová M, Illeová V, Vandáková M, Druzkovská A, Polakovic M (2008). Chromatographic separation and kinetic properties of fructosyltransferase from Aureobasidium pullulans. J. Biotechnol. 135:58-63. Crossref |
||||
|
Chen W-c, Liu C-h (1996). Production of [beta]-fructofuranosidase by Aspergillus japonicus. Enzyme and Microbial Technology 18:153-160. Crossref |
||||
|
Cruz R, D'Arcadia Cruz V, Belote JG, de Oliveira Khenayfes M, Dorta C, dos Santos Oliveira LH, Ardiles E, Galli A (1999). Production of transgalactosylated oligosaccharides (TOS) by galactosyltransferase activity from Penicillium simplicissimum. Bioresour. Technol. 70:165-171. Crossref |
||||
| Elibol M (1999). Optimization of medium composition for antinorchodin production by Streptomyces coelicolor A3 (2) with response surface methodology. Process Biochemistry 35:1057-1062. | ||||
|
Enshasy HA, Farid MA, El-Sayed ESA (2000). Influence of inoculum type and cultivation conditions on natamycin production by Streptomyces natalensis. J. Basic Microbiol. 40:333-342. Crossref |
||||
|
Fernandez A, Olvera-Carranza C, Rudini-Pinfera E, Cassab GI, Nieto-Sotelo J, Lopez-MunguiÌ A (2007). Molecular characterization of sucrose: sucrose 1-fructosyltransferase (1-SST) from Agave tequilana Weber var. azul. Plant Sci. 173:478-486 Crossref |
||||
| Galmetzer M, Burgstaller W (2002). Efflux of organic acids in Penicillium simplicissimum is an energy-spilling process, adjusting the catabolic carbon flow to the nutrient supply and the activity of catabolic pathways. Microbiol. 148:1143-1149. | ||||
|
Ganaie MA, Lateef A, Gupta US (2014). Enzymatic trends of fructooligosaccharides production by microorganisms, Appl. Biochem. Biotechnol. 172:2143-2159. Crossref |
||||
| Haaland PD (1989). Statistical problem solving. In: Experimental Design in Biotechnology. New York and Basel: Marcel Dekker Inc. pp. 1-18. | ||||
|
Heyer AG, Wendenburg R (2001). Gene cloning and functional characterization by heterologous expression of the fructosyltransferase of Aspergillus sydowi IAM 2544. Appl Environ. Microbiol. 67:363-370. Crossref |
||||
| Han YW, Liu GM, Huang DY, Qiao BJ, Chen LP, Guan LH, Mao DB (2011) Study on the synthesis of sucrose 6-acetate catalyzed by fructosyltransferase from Aspergillus aryzae. Nat Biotechnol 28:14-18 | ||||
|
Kumar SS, Gupta R (2008). An extracellular lipase from Trichosporon asahii MSR 54: Medium optimization and enantioselective deacetylation of phenyl ethyl acetate. Process Biochem. 43:1054-1060. Crossref |
||||
|
Lee KJ, Choi JD, Lim JY (1982). Purification and properties of intracellular fructosyl transferase from Aureobasidium pullulans. World J. Microbiol. Biotechnol. 8:411-415. Crossref |
||||
|
Le Gorrec K, Connes C, Guibert A, Uribelarrea J-L, Combes D (2002). Identification of three inducible and extracellular enzymatic activities working on sucrose in Bacillus subtilis NCIMB 11871 and 11872 supernatant. Enzyme and Microbial Technol. 31:44-52. Crossref |
||||
|
Lee SL, Chen WC (1997) Optimization of medium composition for the production of glucosyltransferase by Aspergillus niger with response surface methodology. Enzyme and Microbial Technol. 21:436-440. Crossref |
||||
|
Lejeune R, Baron GV (1995). Effect of agitation on growth and enzyme production of Trichoderma reesei in batch fermentation. Appl. Microbiol. Biotechnol. 43:249-258. Crossref |
||||
|
Li X-m, Liao D-x, Xu X-q, Yang Q, Zeng G-m, Zheng W, Guo L (2008). Kinetic studies for the biosorption of lead and copper ions by Penicillium simplicissimum immobilized within loofa sponge. J. Hazardous Materials 159:610-615. Crossref |
||||
|
Luonteri E, Tenkanen M, Viikari L (1998). Substrate specificities of Penicillium simplicissimum [alpha]-galactosidases. Enzyme Microbial Technol. 22:192-198. Crossref |
||||
|
Mu Y, Wang G, Yu HQ (2006). Response surface methodological analysis on biohydrogen production by enriched anaerobic cultures. Enzyme Microbial Technol. 38:905-913. Crossref |
||||
|
Mukherjee JAK, Adhikari H, Raj SK (2008). Production of alkaline protease by a thermophilic Bacillus subtilis under solid state fermentation (SSF) condition using Imperata cylindrical grass and potato peel as low cost medium: characterization and application of enzyme in detergent formulation. Biochem. Engr J. 38:353-361. Crossref |
||||
|
Nemukula A, Mutanda T, Wilhelmi BS, Whiteley CG (2009). Response surface methodology: Synthesis of short chain fructooligosaccharides with a fructosyltransferase from Aspergillus aculeatus. Bioresour. Technol. 100:2040-2045. Crossref |
||||
| Okafor N (2007). Modern Industrial Microbiology and Biotechnology (1st eds). Science Publishers: Enfield, NH, USA. pp. 54-76. | ||||
|
Prapulla SG, Subhaprada V, Karanth NG (2000). Microbial production of oligosaccharides: A review. Advances in Appl. Microbiol. 47:299-343. Crossref |
||||
|
Quan GB, Han Y, Yang C, Hu WB, Liu A, Wang JX, Wang Y, Liu MX (2008). Inhibition of high glucose-induced erythrocyte phosphatidylserine exposure by leupeptin and disaccharides. Cryobiol. 56:53-61. Crossref |
||||
|
Ramachandran S, Patel AK, Nampoothiri KM, Francis F, Nagy V, Szakacs G, Pandey A (2004). Coconut oil cake- a potential raw material for the production of [alpha]-amylase. Bioresour. Technol. 93:169-174. Crossref |
||||
|
Rao KJ, Kim C-H, Rhee S-K (2000). Statistical optimization of medium for the production of recombinant hirudin from Saccharomyces cerevisiae using response surface methodology. Process Biochem. 35:639-647. Crossref |
||||
|
Sangeetha PT, Ramesh MN, Prapulla SG (2004). Production of fructosyl transferase by Aspergillus oryzae CFR 202 in solid-state fermentation using agricultural by-products. Appl. Microbiol. Biotechnol. 65:530-537. Crossref |
||||
|
Sangeetha PT, Ramesh MN, Prapulla SG (2004a). Production of fructosyl transferase by Aspergillus oryzae CFR 202 in solid-state fermentation using agricultural by-products. Appl. Microbiol. Biotechnol. 65:530-537. Crossref |
||||
|
Sangeetha PT, Ramesh MN, Prapulla SG (2004b). Production of fructo-oligosaccharides by fructosyl transferase from Aspergillus oryzae CFR 202 and Aureobasidium pullulans CFR 77. Process Biochem. 39:753-758. Crossref |
||||
|
Sautour M, Dantigny P, Guilhem MC, Bensoussan M (2003). Influence of inoculum preparation on the growth of Penicillium chrysogenum. J. Appl. Microbiol. 95:1034-1038. Crossref |
||||
|
Seth M, Chand S (2000). Biosynthesis of tannase and hydrolysis of tannins to gallic acid by Aspergillus awamori - optimisation of process parameters. Process Biochem. 36:39-44. Crossref |
||||
|
Shafiq K, Haq I (2002). Effect of different mineral nutrients on invertase production by Saccharomyces cerevisae GCB-K5. Biotechnol. 1:40-44. Crossref |
||||
|
Singh RS, Bhermi HK (2008). Production of extracellular exoinulinase from Kluyveromyces marxianus YS-1 using root tubers of Asparagus officinalis. Bioresource Technol. 99:7418-7423. Crossref |
||||
|
Siqueira PF, Karp SG, Carvalho JC, Sturm W, Rodríguez-León JA, Tholozan J-L, Singhania RR, Pandey A, Soccol CR (2008). Production of bio-ethanol from soybean molasses by Saccharomyces cerevisiae at laboratory, pilot and industrial scales. Bioresource Technol. 99:8156-8163. Crossref |
||||
|
Soni P, Singh M, Kamble AL, Banerjee UC (2007). Response surface optimization of the critical medium components for carbonyl reductase production by Candida viswanathii MTCC 5158. Bioresource Technol. 98:829-833. Crossref |
||||
|
Tang X-J, He G-Q, Chen Q-H, Zhang X-Y, Ali MAM (2004). Medium optimization for the production of thermal stable [beta]-glucanase by Bacillus subtilis ZJF-1A5 using response surface methodology. Bioresource Technol. 93:175-181. Crossref |
||||
|
Tari C, Gögus N, Tokatli F (2007). Optimization of biomass, pellet size and polygalacturonase production by Aspergillus sojae ATCC 20235 using response surface methodology. Enzyme and Microbial Technol. 40:1108-1116. Crossref |
||||
|
Tucker KG, Thomas CR (1994). Inoculum effects on fungal morphology: Shake flasks vs agitated bioreactors. Biotechnol. Tech. 8:153-156. Crossref |
||||
|
Wang L, Ridgway D, Gu T, Moo-Young M (2005). Bioprocessing strategies to improve heterologous protein production in filamentous fungal fermentations. Biotechnology Advances 23:115-129. Crossref |
||||
|
Yun JW, Kim DH, Song SK (1997). Enhanced production of fructosyltransferase and glucosyltransferase by substrate-feeding cultures of Aureobasidium pullulans. J. Fermentation Bioengineer., 84:261-263. Crossref |
||||
Copyright © 2024 Author(s) retain the copyright of this article.
This article is published under the terms of the Creative Commons Attribution License 4.0


