ABSTRACT
Pearl millet (Pennisetum glaucum L.) is an important staple food crop, especially in arid and semi-arid regions of West Africa. However, the genetic diversity of pearl millet in these regions is poorly understood, and yet it is useful in identification of landmarks for in situ germplasm conservation and breeding programs, particularly in establishment of heterotic groups. Therefore, the aim of this study was to assess the patterns of genetic diversity and relationships among 30 West African pearl millet accessions, using 21 microsatellite markers. Population structure and population genetic diversity were also assessed. Genotypic data was generated using the ABI Prism 3730 and alleles were called and sized using GeneMapper software version 3.7. Molecular data was analyzed using DARwin 4.0, PowerMarker 3.0 and Arlequin version 3.11. The average marker quality index was 0.29 while the total number of alleles detected was 171 with an average of 8 alleles per locus. The average polymorphic information content (PIC) was 0.64. The average Nei’s genetic diversity and heterozygosity were 0.533 and 0.433, respectively. Hierarchical partitioning of genetic variation by analysis of molecular variance (AMOVA) demonstrated that genetic differentiation was low but significant at p<0.003 with a fixation index (Fst) of 0.154. Of the total genetic diversity, 5.8, 9.5 and 84.6% were attributed to country differences, population differences within the countries and differences within populations, respectively. Cluster and principal coordinate analysis of the 30 populations revealed two distinct pearl millet accessions while the 49 individuals revealed four clusters, all on the basis of geographic origins and genotypes. This study demonstrates the utility of simple sequence repeats (SSR) markers in detecting polymorphism, estimating genetic diversity and assigning heterotic groups in a highly cross-pollinated species such as pearl millet.
Key words: Genetic variability, pearl millet, polymorphic information content, population structure, simple sequence repeats (SSR) markers.
Pearl millet (Pennisetum glaucum L.) ranks as the sixth most important cereal in the world. It is one of the most important staple cereals in sub-Saharan Africa and India, particularly in arid and semi-arid regions (Loumerem et al., 2008). Pearl millet is an excellent dietary source of calcium, iron, manganese and methionine, an amino acid lacking in the diets of hundreds of millions of the poor who live on starchy foods such as cassava, plantain, polished rice and maize meal (Bashir et al., 2014; Vanisha et al., 2011). In addition to grains, pearl millet crop residues and green plants are a good source of animal feeds, building materials and fuel for cooking. The West African region is normally affected by recurrent drought. As a result, many people are at risk because of crop production decrease in both rain-fed and irrigated areas. This, in combination with food security issues, prompts research institutions to advice farmers to grow drought tolerant crops. Millet is superior in drought tolerance and adaptability to poor soils and, therefore, is largely contributing to food security (Sahri et al., 2014). However, genetic diversity of pearl millet in West Africa has not been fully and systematically exploited in breeding programmes.
Studying the diversity of important cereal crops, such as pearl millet, enables identification of landmarks for in situ germplasm conservation, the creation of core accessions for genetic analysis and the extension of knowledge useful for breeding programs (Thomas et al., 2017; Mariac et al., 2006). Many studies have aimed at assessing the genetic diversity in germplasm collections of crops using various types of DNA markers, such as restriction fragment length polymorphism (RFLP) (Bhattacharjee et al., 2002; Jordan et al., 2003), random amplified polymorphic DNA (RAPD) (Haussmann et al., 2002; Panday et al., 2002) and amplified fragment length polymorphism (AFLP) (Brocke et al., 2003) as well as genotyping by sequencing (He et al., 2014). Simple sequence repeats (SSR) loci, which correspond to tandemly repeated DNA with very short repeat units, have been reported as powerful genetic markers in characterization of plants (Thomas et al., 2017; Bashir et al., 2014; Powell et al., 1996; Smith et al., 2000). SSRs have several advantages over other DNA markers such as RFLPs, RAPDs and AFLPs. They are co-dominant and highly informative, display high levels of polymorphism (Senior et al., 1998) and are amenable to automated genotyping strategies. In addition, radioisotopes are not required in the detection of SSR markers, because sequence polymorphism usually can be detected by separation of amplified products in agarose gels. Furthermore, SSR loci give good discrimination between closely related individuals, in some cases, even with only a few loci (Kong et al., 2000; Gupta et al., 2013).
Pearl millet is a highly cross-pollinating species and genetic diversity is distributed both within and among cultivars. Within-cultivar diversity can be very limited in exhibit a tremendous amount of genetic diversity due to the wide range of stressful environments in which it has been cultivated traditionally. Therefore, the partitioning of diversity and a better understanding of genetic relationships could allow for assigning of heterotic groups as an important step in selecting parental lines in millet breeding programs. In the present study, highly polymorphic SSR markers were used to determine the genetic diversity and population structure of pearl millet landraces from West Africa.
Plant material
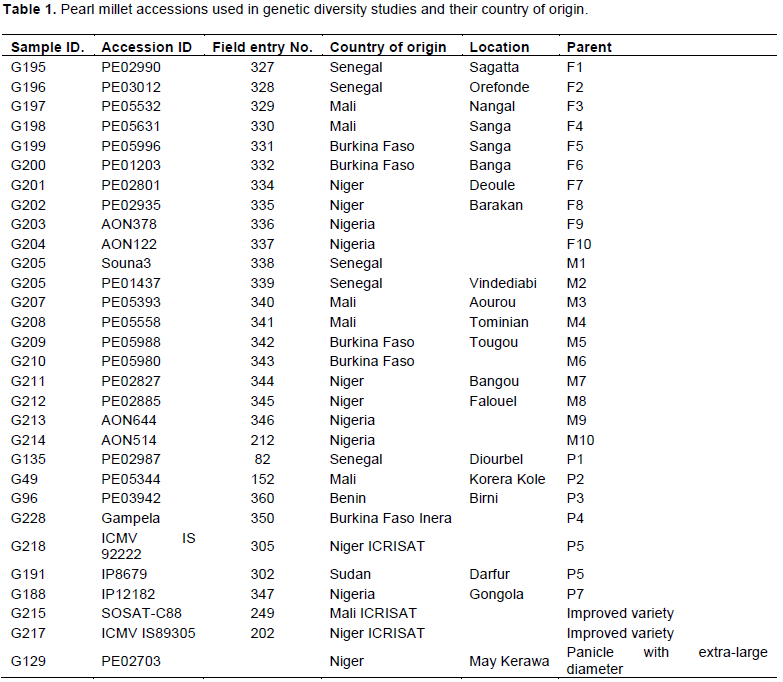
Thirty (30) pearl millet accessions, including landraces, improved open-pollinated cultivars and farmer varieties were used in this study (Table 1). Seeds were collected from diverse geographic origins in West Africa.
DNA extraction, quantification and normalization
Both individual and bulking sampling methods were used in harvesting of leaf samples. Leaf tissues of four seedlings were pooled for each accession for all the 30 accessions. In addition, 10 accessions were randomly selected and five seedlings per accession sampled individually for the assessment of within population genetic diversity. Genomic DNA was extracted from fresh leaves of one-week-old seedlings using a modified cetyl trimethylammonium bromide (CTAB) protocol (Mariac et al., 2006). Determination of integrity of the isolated DNA was assessed using agarose (0.7%) gel electrophoresis stained with ethidium bromide (10 mg/ml). The gel was run at a constant voltage of 100 v until the bromo-phenol blue migrated almost to the end of the gel. The gel was then removed from the rig, placed in a UV trans-illuminator and photographed. DNA was quantified through spectrophotometric absorbance (A) readings at wavelengths (λ) of 260 and 280 nm, using a Nanodrop spectrophotometer. All the DNA samples were diluted to the required concentration of 5 ng/µl for polymerase chain reaction (PCR) amplifications.
PCR optimization and amplification
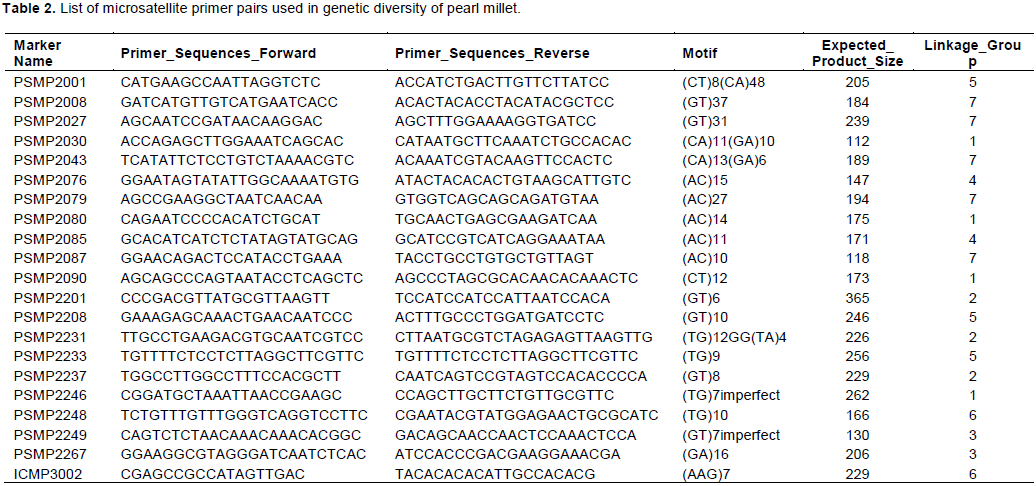
A total of 21 microsatellite primer pairs were used for PCR amplification of the DNA samples (Table 2). PCR conditions for each of the 21 SSR markers were optimized and PCR reactions were set up in 10 µl volumes in 96-well PCR plates (ABGene, Rochester N.Y). Each PCR reaction contained 2 pmol/µl of primer, 2 mM MgCl2, 2 mMdNTPs, 0.04U Amplitaq Gold Polymerase (PE-Applied Biosystems) and 1× PCR buffer (PE-Applied Biosystems). Temperature cycling was carried out using the Gene-amp PCR system 9700 (PE-Applied Biosystems and touch-down PCR amplification; 15 min denaturation cycle, followed first by 10 cycles of 94°C for 10 s, 61°C for 20 s (ramp of 1°C per cycle) and 72°C for 30 s, then by 31 cycles of 94°C for 10 s, 54°C for 20 s and 72°C for30 s. After completion of 31 cycles, a final extension of 30 min at72°C (Smith et al., 1995). The final extension temperature was extended for 30 min when the primers were having a lot of stutter bands to reduce the probability of false scoring of stutter bands as alleles. Following amplification, three microlitres of the PCR products were run on 2% agarose gel stained with ethidium bromide (10 mg/ml), observed under UV transilluminator and photographed.
Capillary electrophoresis
The forward primers of all the 21 SSR markers were labelled with FAM, PET, VIC and NED (PE-Applied Biosystems), allowing post-PCR pooling of the 21 primer products into 6 groups of three primer products each and two groups of two primer products each, with each primer product in a given group being labelled with a different dye. Co-loading sets were optimized and multiplexed based on dye label, fragment size and fluorescence to reduce the unit cost of high throughput genotyping. DNA fragments were denatured and size-fractioned using capillary electrophoresis on an ABI prism 3730 automatic DNA sequence (PE-Applied Biosystems). The GeneMapper v3.7 software (PE-Applied Biosystems) was used to size peak patterns, using the internal Genescan-500 LIZ size standard and genotyper 3730 (PE-Applied Biosystems) for allele calling. Size calling was performed using GeneMapper v3.7 and bins were constructed from reference data. Alleles were automatically assigned allele calls based on the bin definitions. The results were stored in the GeneMapper data base. Allelobin software was used for checking the quality and efficiency of markers.
Data analysis
In each SSR marker, the following was determined: total number of alleles detected, number of common alleles with allelic frequencies of at least 5%, and the polymorphic information content (PIC) values (Botstein et al., 1980; Smith et al., 2000). Pair-wise genetic similarities between individual accessions were calculated using Power marker v.3.25 (Liu and Muse, 2005). The genetic diversity within and among countries and within and among accessions was estimated using the Power marker Version 3.25 (Liu and Muse, 2005) based on estimated allele frequencies (Nei, 1978).
Allele frequency based on pair-wise genetic distances between countries and between accessions were calculated using Power Marker v3.25 (Liu and Muse, 2005). The resulting distance matrix was subjected to sequential Agglomerative hierarchical nested (SAHN) clustering using un-weighted pair-group method analysis (UPGMA) as implemented in Power marker v3.25. Distance matrices and dissimilarity index were generated using Dice’s coefficient as implemented in DARwin ver.4.0 to generate dendrograms showing the clustering of the 49 individuals and 30 bulks. Bootstrapping over loci with 1000 replications was carried out to assess the strength of evidence for the branching patterns in the resulting UPGMA dendrograms. Consensus trees were constructed using the tree view and DARwin ver.4.0. Pair-wise genetic similarities between individual accessions were calculated using Darwin ver. 4.0 with binary data (single data) as input, based on Dice’s genetic similarity coefficient (Dice, 1945). The resulting similarity matrix was subjected to non-metric multi-dimensional scaling (MDS). A scatter plot of the first and the second MDS axes was drawn to visualize the inter-relationship among the accessions for bulks and within the individuals for individuals. In structure analysis, population differentiation tests were performed in Powermarker ver.4.0. The first analysis used a contingency table approach to determine if groups of individuals had a significant difference in allele frequencies for each locus (Raymond and Rousset, 1995), while the second analysis tested the overall differentiation of groups by using a variant of the Mantel test(MANTEL-STRUCT). Arlequin program was used to determine the analysis of molecular variance (AMOVA) according to Weir and Cockerham (1984).
Marker quality indices, allele variability and polymorphism in the 49 individuals
Using the 21 SSR markers, a total of 171 alleles were detected among the 49 individual samples. The total number of alleles per locus ranged from 4 to 21 with an average of 8 alleles per locus. The highest % abundant alleles were observed in primer 2267 (57.8%), whereas the lowest % of abundant alleles was observed in primer 2027 (23.6%). The highest and lowest numbers of rare alleles at <=5% were 5 and 1, respectively. The average quality index value was 0.29 with thirteen markers, having a low quality index value between 0.087 and 0.295, three markers had an intermediate quality index value between 0.300 and 0.3954, while five markers had a quality index value above 4.0. The PIC varied from 0.39 to 0.82 for individuals with an average of 0.64.
Marker quality indices, allele variability and polymorphism in the 30 bulked samples
Using the 21 SSR markers, a total of 172 alleles were detected among the 30 bulked samples using 21 primer pairs. The total number of alleles per locus ranged from 2 to 25 with an average of 8 alleles per locus. The highest % abundant alleles were observed in primers 2267 (57.45%) whereas the lowest % of abundant alleles was observed in primer 2027 (15.97%). The highest and lowest numbers of rare alleles at <=5% were 5 and 1, respectively, with different primers. There were no rare alleles observed from primer pairs PSMP 2201, PSMP 2246, PSMP 2249 and PSMP 2208. The average quality index value was 0.28 with fourteen markers having a low-quality index value between 0.084 and 0.2995, two markers had a intermediate quality index value between 0.30 and 0.3954 while five markers had a quality index value above 4.0. The PIC varied from 0.31 to 0.84 with an average of 0.60.
Genetic diversity within and between 49 individuals of ten pearl millet accessions
The total number of alleles within individuals in the ten accessions across the 21 loci ranged from 107 to 158. The highest total number of alleles of 158 was observed in accession G197 and G215, whereas the lowest was 107 observed in accession G211. The difference between the highest and the lowest total number of alleles in each individual of the 10 different accessions ranged from 4 to 9 with an average of 5.9.
Polymorphism in the ten accessions ranged from 90.5 to 100%. Four accessions namely G217, G49, G203 and G209 showed 100% polymorphism across the 21 loci. The lowest level of polymorphism (90.5%) was observed in accessions G210 and G196. PIC in the 10 accessions varied from 0.40 to 0.53, with an average of 0.47 (Table 2). The highest PIC was observed in accessions G209 and G49, with a value of 0.53, whereas the lowest was observed in accession G210 with a value of 0.40. The average Nei’s gene diversity (H) varied from 0.45 to 0.59, with a mean of H = 0.53 across the ten accessions. The highest gene diversity was H = 0.59 and lowest H = 0.45 in accessions G209 and G210, respectively. Average heterozygosity ranged from 0.29 to 0.53 with a mean of 0.43 across the ten accessions. The highest average heterozygosity was observed in accession G197 with a value of 0.53 while the lowest was 0.29 in accession G211 (Table 3).
Genetic relationships among 49 individuals of 10 pearl millet accessions
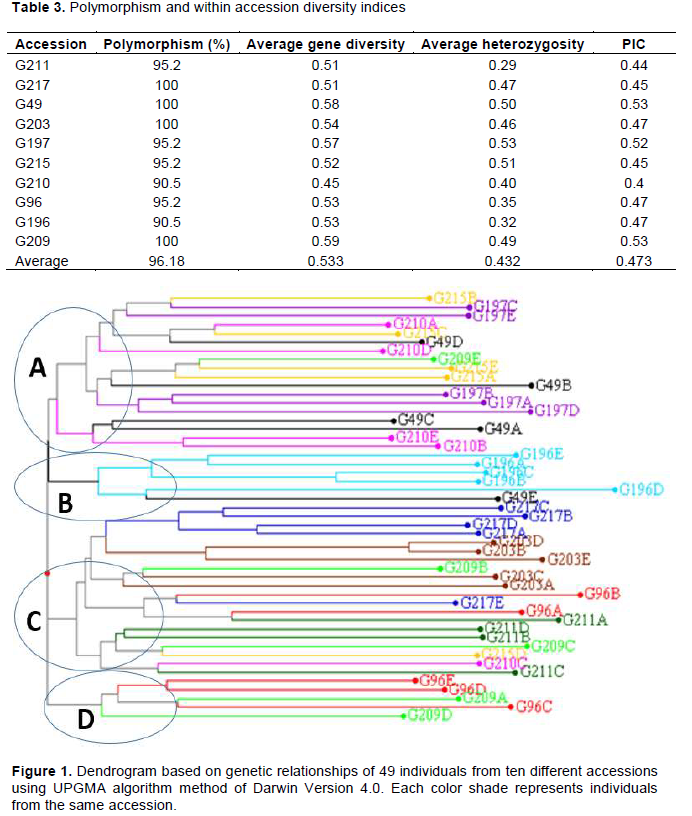
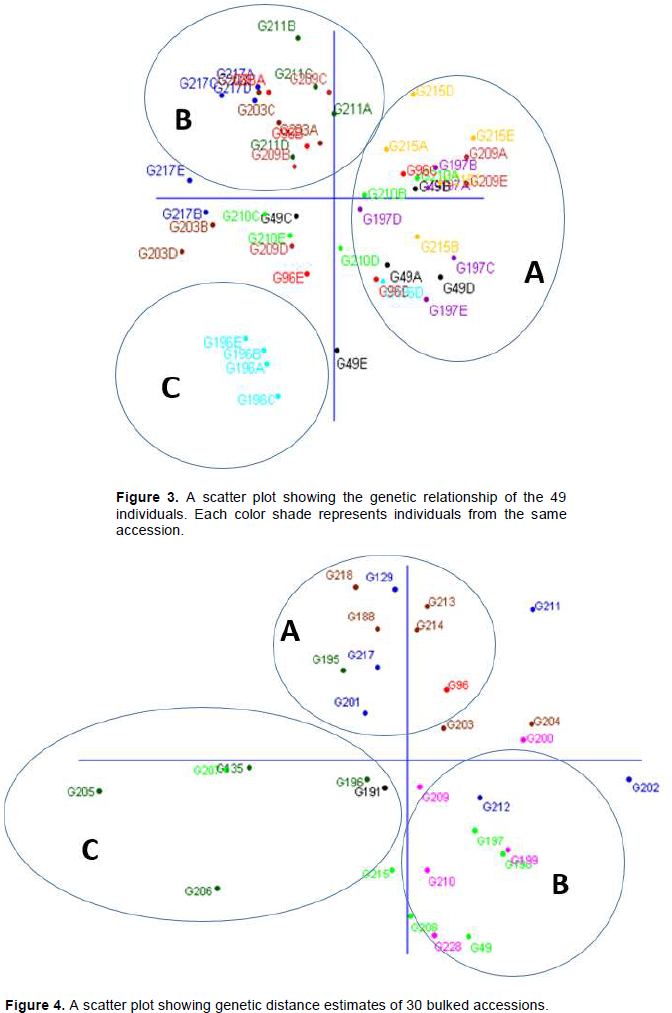
The overall assessment of genetic distances derived from SSR data varied from 0.23 between G196C and G196B as the lowest value to 0.88 between G196D and G96B as the highest value. The highest genetic distance of 0.79 was observed in accession G196 between individual G196D and G196B while the lowest was 0.12 in accession G203 between individuals G203D and G203B. Cluster analysis (CA) partitioned the individual lines in accordance with their origin from different breeding groups and pedigree information. Four clusters were generated with two large clusters having 19 (cluster C) and 18 (cluster A) individuals. The smallest clusters (B and D) had five individuals each (Figure 1).
Genetic relationships of 30 bulked accessions of pearl millet
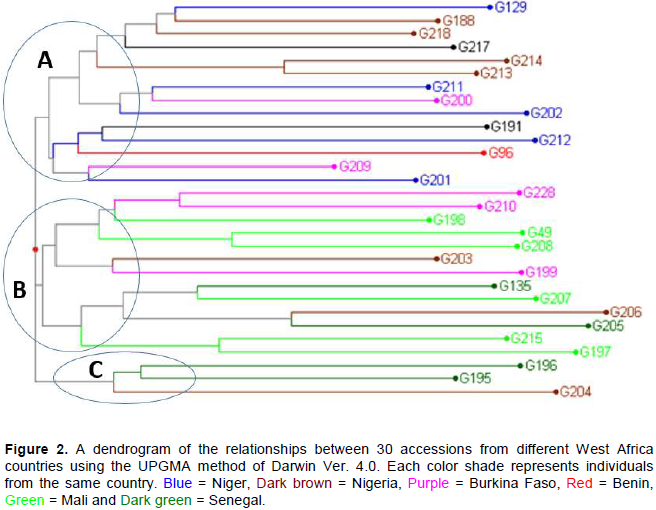
The hierarchical cluster analysis (HCA) partitioned the accessions in accordance with their origin from different breeding groups that were used in factorial and diallele crosses. Three major clusters were generated from Nei and Li genetic distance matrices. Cluster A contained accessions G129, G217, G202, G212 and G201 from Niger, G 188, G218, G214 and G213 from Nigeria, G191 from Sudan, G96 from Benin and G200, G209 from Burkina Faso (Figure 1). Cluster B consisted of accessions G198, G49, G208, G207, G217 and G197 from Mali, G228, G210 and G199 from Burkina Faso, G135, G206 and G205 from Senegal and G203 from Nigeria. Cluster C contained accessions G196, G195 from Senegal and G204 from Nigeria (Figure 2).
Principal co-ordinate analysis (PCoA)
A scatter plot of the first and second axes of non-metric multi-dimensional scaling (MDS) revealed three clusters of inter-relationships within accessions. It grouped both individual and bulked accessions into three groups. The first group consisted of accessions from Nigeria and Niger, the second group had accessions from Burkina Faso and Mali while accessions from Senegal grouped independently (Figures 3 and 4). The analysis showed that the accessions generally clustered on the basis of the geographical origins.
Population structure
There was a clear genetic differentiation among countries, among populations within countries and within the populations, using significance tests based on 1000 permutations calculated according to Weir (1996) in Arlequin. The examination of the hierarchical partitioning of genetic variation by AMOVA demonstrated that genetic differentiation was significant at p<0.003 using the exact value for population differentiation (Raymond and Rousset, 1995). The genetic variation was lower among countries (with a variance component of 0.436) than among populations within countries, with variance components of 0.713. The variation was highest within populations, with a variance component of 6.309. Of the total genetic diversity, 5.85% was attributed to country differences, 9.56% was attributed to population differences within the countries while 84.59% was attributed to differences within populations. The Fst value was 0.154, indicating a low level of differentiation. The value of F, which is equivalent to FIT and estimates the overall (total population) inbreeding, was 0.38 indicating a minimal level of inbreeding while the value of Theta (P) was -0.011 showing a slight excess of heterozygotes (Table 4).

Polymorphism, heterozygosity and gene diversity within countries using the 30 bulked pearl millet accessions
The total number of alleles in each of the 30 bulked accessions varied from 42 to 63 with an average of 52.57. The highest total number of alleles (63) was observed in accessions G200 and G218, whereas the lowest (42) were observed in accession G204. The analysis of within country diversity revealed high levels of polymorphism, heterozygosity and gene diversity. The level of polymorphism in the seven countries ranged from 76.2% in Benin and Sudan to 100% in Mali, Niger, Nigeria and Burkina Faso. Benin and Sudan had one accession each, while the other countries had five or more accessions and this may be the cause of differences. The mean Nei’s unbiased (estimate of gene diversity (H) within countries was variable, ranging from the highest H = 0.62) in Niger to the lowest (H = 0.38) in Sudan. The average of within country diversity was H = 0.53. The average heterozygosity was quite high with the exception of Benin. The highest level of heterozygosity was 0.89 observed in Niger accessions (Table 5).
Genetic relationships of 30 bulked accessions of pearl millet among countries
The maximum dissimilarity value was 0.62 between accession G202 and G205, whereas the minimum dissimilarity value was 0.20 between accessions G213 and G214. The highest genetic distance was between Nigeria and Sudan with a value of 0.52, whereas the lowest was between Niger and Nigeria with a value of 0.22. The allele frequency based pair-wise genetic distances between countries calculated using PowerMarker V3.25 (Liu and Muse, 2005) revealed the relatedness of accessions on a country by country basis. The pair-wise comparisons between countries revealed that accessions from Nigeria and Sudan were the most distant, whereas accessions from Niger and Nigeria were the most genetically close. The accessions from Mali and Burkina Faso were also quite close and the Senegal accessions were generally further from the other West African accessions (Table 6).
Population structure and diversity within and between countries based on 30 accessions of pearl millet
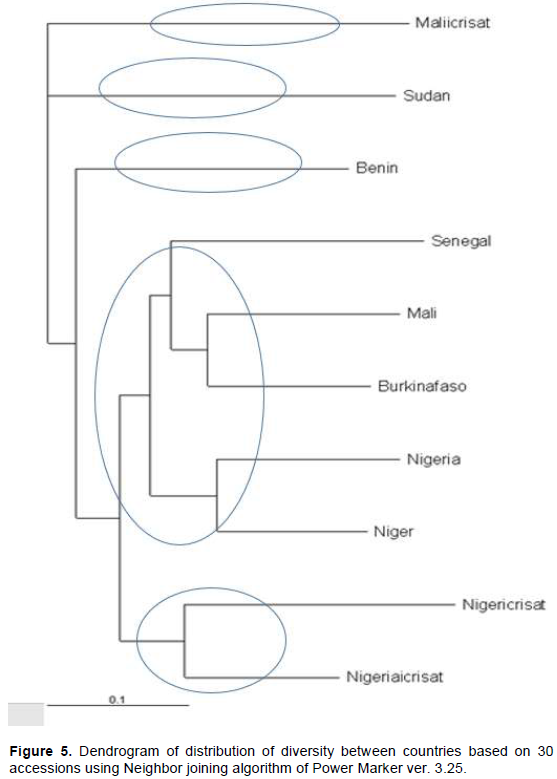
Five clusters were generated from the 30 accessions based on their country of origin. The largest cluster was further subdivided into two sub-clusters with one comprising of accessions from Senegal, Mali and Burkina Faso, and the other comprised of accessions from Niger and Nigeria. The second cluster comprised of some accessions from Niger and Nigeria ICRISAT stations. The accessions from Benin, Sudan and Mali ICRISAT separated into the three remaining clusters, respectively (Figure 5).
Pearl millet microsatellite markers revealed high levels of genetic polymorphism in this study. This is in agreement with studies in other important cereal crops including rice (Oryza sativa L.), wheat (Triticum aestivum L.), barley (Hordeum vulgare L.), maize (Zea mays L.) and sorghum (Sorghum bicolor L.) (Brown et al., 1996; Chen et al., 1997; Devos et al., 1995; Liu et al., 1996; Senior et al., 1998). However, high genetic diversity was recorded in pearl millet in Senegalese landraces using SNPs. The higher level of polymorphism associated with SSR markers may be a function of unique replication slippage mechanism responsible for generating SSR allelic diversity (Pejic et al., 1998). The PIC of an SSR marker provides an estimate of the discriminatory power of that marker by taking into account the number and relative frequencies of alleles (Smith et al., 2000). Most of the SSR markers used in this study revealed a high discriminatory power (PIC of greater than 0.5) and hence were highly informative. This is in agreement with previous studies by Qi et al. (2004) and Mariac et al. (2006), who found a PIC of greater than 0.5 with the same primers. However, in contrast genetic diversity studies of Napier grass, a quite low PIC of 0.212 was revealed (Kandel et al., 2016). The SSR markers used were from pearl millet and could probably explain the low discriminatory power.
Microsatellite markers have been used to investigate genetic diversity of a large number of cultivars in rice (Chen et al., 1997), wheat (Plaschke et al., 1995) and maize (Senior et al., 1998). The number of alleles amplified per primer pair was from 3 to 25 for rice, 3 to 16 for wheat, 2 to 23 for maize and 2 to 12 in Napier grass (Kandel et al., 2016). In the present study, 2 to 25 alleles per primer were amplified from pearl millet. Thus, the level of microsatellite polymorphisms in pearl millet is relatively high and similar to other out crossing crops. One possible reason is that the materials used in the present study were from diverse geographical areas and thus had a relatively wide genetic base. In this study, several unique/rare alleles were observed in both individuals and bulks of pearl millet. The presence of many unique alleles may be explained by the relatively high rate of mutation in SSR loci (Henderson and Petes, 1992). Such alleles are important because they may be diagnostic for particular regions of the genome specific to a particular type of pearl millet. The number of rare alleles within a landrace accession was high reflecting high variability within the accessions. This is probably due to the cross-pollinated nature of the crop. High levels of allelic variability and heterozygosity in individuals was observed in this study. This could be due to the fact that in an outbreeding species such as pearl millet, the proportion of heterozygous loci is likely to be high.
The results with 21 microsatellite markers showed clear differences within and between 30 accessions of pearl millet from West Africa. Clear patterns of genetic divergence within the 49 individuals from 10 accessions were observed based on the Dice dissimilarity index of SSR allelic patterns. The difference between the average gene diversity and average heterozygosity was small, which is expected in cross pollinating species as a result of random mating. There was a clear distinction between individuals from Senegal accessions and the individuals from the other accessions of the rest of the countries. The diversity of individuals from Senegal was the lowest, whereas individuals of accessions from Nigeria recorded the highest level of diversity. The high level of genetic diversity of individuals of pearl millet accessions from Nigeria confirms reports by Animasaun et al. (2017). The high level of genetic diversity of individuals of pearl millet accessions from Nigeria could be due to low level of human selection or outcrossing between cultivated accessions and highly variable wild species hence broadening the genetic base. In addition, landrace systems for cross-pollinating crops, some genetic studies indicate that mixture and replacement serve the purpose of protecting viability of the seed (Berthaud et al., 2000; Sattler et al., 2018). Although the diversity within individuals of the accessions from Senegal was low, they had the highest number of rare alleles. The presence of these unique/rare alleles may be explained by the relatively high rate of mutation in SSR loci (Henderson and Petes, 1992).
The genetic diversity of accessions from the West African countries was generally high at Nei genetic diversity average of 0.53. This is consistent with studies on genetic diversity in pearl conducted by Stich et al. (2010), which revealed an average genetic diversity of 0.74 across 20 SSR markers. In this study, among the accessions, the lowest genetic diversity was detected in accessions from Mali and Niger, whereas the accessions from Nigeria presented the highest genetic diversity. The low genetic diversity observed in Mali and Niger could be due to the fact that farmers tend to keep several named landraces separately for up to five years. Moreover, except in times of crop failure they generally do not exchange seeds even with their neighbors (Jika et al., 2017). Such observation was also made in Niger landraces where diversity was the lowest among the cultivated accession in West Africa (Mariac et al., 2006). Distance to seed markets is positively associated with pearl millet diversity, since being farther from markets means that farmers continue to grow their own materials in addition to improved varieties (Nagarajan et al., 2006). They may also specialize more in growing certain popular varieties as was also found by Nagarajan et al. (2006) in their study of village seed systems and the biological diversity of millet crops in marginal environments in India.
Cluster analysis of the genetic relationships between countries revealed three major groups and this pattern of clustering was confirmed by principal co-ordinate analysis (PCoA). These major groups were probably formed on the basis of (i) the level of diversity according to Nei’s indices, (ii) the percentage of polymorphic loci and (iii) the percentage of rare fragments at an arbitrary frequency of (<5%). The population structure of the accessions showed that individuals from Senegal clustered together, while those from Mali and Burkina Faso clustered together. Individuals from Nigeria clustered together with those from Niger. This pattern of clustering may be attributed to uniformity of the environmental variables found in the two countries. The individuals from Senegal grouped together probably because geographically, Senegal is quite far from the other countries in West Africa. Therefore, it is likely to have its unique agro-ecological conditions. This confirms findings by Hu et al. (2015), which demonstrated high genetic diversity in Senegal accessions relative to other global accessions. The clear distinction of accessions from Senegal and those from other countries may be attributed to environmental differences in addition to the likely influences of the ‘Equilibrium theory of island biogeography (Kiambi et al., 2005). This is also consistent with the work on genetic variation in Prunus Africana showing that genetic distinctness and differentiation of populations may arise from geographic and ecological isolation (Dawson et al., 1999).
Hartl (1988) suggested that an Fst range of 0-0.05, 0.05-0.15, 0.15-0.25 and above 0.25 indicates little, moderate, large and very large differentiation, respectively. In this study, the level of population differentiation was Fst 0.154, which shows moderate differentiation using the suggested parameters. This perhaps reflects partly, the different country and agro-ecological zones of origin of the landraces and probably due to the homogenous nature of cultivated pearl millet. Reports by Stich et al. (2010) and Pressoir and Berthaud (2004) observed very low genetic differentiation of inbred pearl millet lines and landraces of maize both of which are open-pollinated cereals. However, in commercial maize lines, a slightly higher differentiation of Fst (0.16) was obtained (Van Inghelandt et al., 2010), which is very close to what was obtained in this study. This pattern may be explained by the recurrent farmer selection for a given morphology in a context of high cross-pollination between landraces (Pressoir and Berthaud, 2004a; Mariac et al., 2006). A similar situation may also exist in pearl millet, which would explain the low-genetic differentiation between morphologically different landraces (Jika et al., 2017). In the estimates of total diversity, the proportion of diversity due to differences of populations within accessions is higher than among populations similar to what was reported by Jasim et al. (2018), and there are distinct differences in diversity on the basis of geographic locations which may be due to environmental heterogeneity as reported by Kiambi et al. (2001).
In this study, the genetic parameters estimated from SSR data indicated high levels of genetic diversity in the landraces of pearl millet from West Africa. The genetic diversity obtained was higher within than between accessions, which is a characteristic of predominantly outcrossing species. The partitioning of variance components based on the AMOVA for diversity analysis revealed high variability between accessions (9.56%), but the variability within accessions was significantly higher (84.59%). The hierarchical partitioning revealed that most of the genetic diversity was found between individuals within accessions than among accessions and countries. Cluster analysis (CA) partitioned the accessions in accordance with their origin from different breeding groups and geographical locations. The utility of SSRs for measuring diversity, assigning of genotypes to heterotic groups and genetic fingerprinting are valuable tools for pearl millet breeding programs. However, there is need to assess the level of correlation between morphological and molecular traits of pearl millet accessions from West Africa.
The authors have not declared any conflict of interests.
The authors would like to thank Dr. Evans Nyaboga of the Department of Biochemistry, University of Nairobi, Kenya for critically reviewing the manuscript.
REFERENCES
|
Animasaun DA, Morakinyo JA, Krishnamurthy R, Mustapha OT (2017). Genetic divergence of Nigerian and Indian pearl millet accessions based on agronomical and morphological traits. Journal of Agricultural Sciences 62(2):115-131.
|
|
|
|
Bashir EMA, Ali AM, Ali AM, Mohamed ETI, Melchinger AE, Parzies HK, Haussmann BIG (2014). Genetic diversity of Sudanese pearl millet (Pennisetum glaucum (L.) R. Br.) landraces as revealed by SSR markers, and relationship between genetic and agro-morphological diversity. Genetic Resources and Crop Evolution 62:579-591.
Crossref
|
|
|
|
|
Berthaud J, Clément J, Emperaire L, Louette D, Pinton F, Sanou J, Second G (2000). The role of local level gene flow in enhancing and maintaining genetic diversity. Broadening the Genetic Base of Crop Production. CABI Publishing in association with FAO and IPGRI pp. 81-103.
|
|
|
|
|
Bhattacharjee R, Bramel P, Hash C, Kolesnikova-Allen M, Khairwal I (2002). Assessment of genetic diversity within and between pearl millet landraces. Theoretical and Applied Genetics 105(5):666-673.
Crossref
|
|
|
|
|
Botstein D, White RL, Skolnick M, Davis RW (1980). Construction of a genetic linkage map in man using restriction fragment length polymorphisms. American Journal of Human Genetics 32(3):314.
|
|
|
|
|
Brocke KV, Christinck A, Weltzien E, Presterl T, Geiger HH (2003). Farmers' seed systems and management practices determine pearl millet genetic diversity patterns in semiarid regions of India. Crop Science 43:1680-1689.
Crossref
|
|
|
|
|
Brown S, Hopkins M, Mitchell S, Senior M, Wang T, Duncan R, Kresovich S (1996). Multiple methods for the identification of polymorphic simple sequence repeats (SSRs) in sorghum [Sorghum bicolor (L.) Moench]. Theoretical and Applied Genetics 93(1):190-198.
Crossref
|
|
|
|
|
Chen X, Temnykh S, Xu Y, Cho Y, McCouc S (1997). Development of a microsatellite framework map providing genome-wide coverage in rice (Oryza sativa L.). Theoretical and applied genetics 95(4):553-567.
Crossref
|
|
|
|
|
Dawson I, Powell W (1999). Genetic variation in the Afromontane tree Prunus africana, an endangered medicinal species. Molecular Ecology 8(1):151-156.
Crossref
|
|
|
|
|
Devos K, Pittaway T, Busso C, Gale M, Witcombe J, Hash C (1995). Molecular tools for the pearl millet nuclear genome. International sorghum and millets newsletter (USA) 36:64-66.
|
|
|
|
|
Dice LR (1945). Measures of the amount of ecologic association between species. Ecology 26(3):297-302.
Crossref
|
|
|
|
|
Gupta S, Kumari K, Muthamilarasan M, Subramanian A, Prasad M (2013). Development and utilization of novel SSR s in foxtail millet Setaria italica (L.) P. Beauv.]. Plant Breeding 132(4):367-374.
Crossref
|
|
|
|
|
Hartl DL (1988). A primer of population genetics: Sinauer Associates, Inc. xi-305
|
|
|
|
|
Haussmann B, Boubacar A, Boureima S, Vigouroux Y (2006). Multiplication and preliminary characterization of West and Central African pearl millet landraces. International Sorghum and Millets Newsletter 47:110-112.
|
|
|
|
|
Haussmann B, Hess D, Seetharama N, Welz H, Geiger H (2002). Construction of a combined sorghum linkage map from two recombinant inbred populations using AFLP, SSR, RFLP, and RAPD markers, and comparison with other sorghum maps. Theoretical and Applied Genetics 105:629-637.
Crossref
|
|
|
|
|
He J, Zhao X, Laroche A, Lu ZX, Liu H, Li Z (2014). Genotyping-by-sequencing (GBS), an ultimate marker-assisted selection (MAS) tool to accelerate plant breeding. [Review]. Frontiers in Plant Science 5:484.
Crossref
|
|
|
|
|
Henderson ST, Petes TD (1992). Instability of simple sequence DNA in Saccharomyces cerevisiae. Molecular and Cellular Biology 12(6):2749-2757.
Crossref
|
|
|
|
|
Hu Z, Mbacké B, Perumal R, Guèye MC, Sy O, Bouchet S, Morris GP (2015). Population genomics of pearl millet (Pennisetum glaucum (L.) R. Br.): Comparative analysis of global accessions and Senegalese landraces. BMC Genomics 16(1):1048.
Crossref
|
|
|
|
|
Jasim AS, Rafii MY, Latif M, Sakimin SZ, Arolu IW, Miah G (2018). Genetic Diversity of Aromatic Rice Germplasm Revealed By SSR Markers. BioMedical research international 2018:1-11
Crossref
|
|
|
|
|
Jika AN, Dussert Y, Raimond C, Garine E, Luxereau A, Takvorian N, Robert T (2017). Unexpected pattern of pearl millet genetic diversity among ethno-linguistic groups in the Lake Chad Basin. Heredity 118(5):491.
Crossref
|
|
|
|
|
Jordan DR,Tao Y, Godwin ID, Henzell RG, Cooper M, McIntyre CL (2003). Prediction of hybrid performance in grain sorghum using RFLP markers. Theoretical and Applied Genetics 106:559-567.
Crossref
|
|
|
|
|
Kandel R, Singh HP, Singh BP, Harris-Shultz KR, Anderson WF (2016). Assessment of Genetic Diversity in Napier Grass (Pennisetum purpureum Schum.) using Microsatellite, Single-Nucleotide Polymorphism and Insertion-Deletion Markers from Pearl Millet (Pennisetum glaucum [L.] R. Br.). Plant Molecular Biology Reporter 34(1):265-272.
Crossref
|
|
|
|
|
Kiambi D, Newbury H, Ford-Lloyd B, Dawson I (2005). Contrasting genetic diversity among Oryza longistaminata (A. Chev et Roehr) populations from different geographic origins using AFLP. African Journal of Biotechnology 4(4):308-317.
|
|
|
|
|
Kong L, Dong J, Hart GE (2000). Characteristics, linkage-map positions, and allelic differentiation of Sorghum bicolor (L.) Moench DNA simple sequence repeats (SSRs). Theoretical and Applied Genetics 101:438-448.
Crossref
|
|
|
|
|
Liu C, Devos K, Witcombe J, Pittaway T, Gale M (1996). The effect of genome and sex on recombination rates in Pennisetum species. Theoretical and applied genetics 93(5-6):902-908.
Crossref
|
|
|
|
|
Liu K, Muse SV (2005). Power Marker: an integrated analysis environment for genetic marker analysis. Bioinformatics 21(9):2128-2129.
Crossref
|
|
|
|
|
Loumerem M, Van Damme P, Reheul D, Behaegh T (2008). Collection and evaluation of pearl millet (Pennisetum glaucum) germplasm from the arid regions of Tunisia. Genetic Resources and Crop Evolution 55:1017-1028.
Crossref
|
|
|
|
|
Mariac C, Luong V, Kapran I, Mamadou A, Sagnard F, Deu M, Bezançon G (2006). Diversity of wild and cultivated pearl millet accessions (Pennisetum glaucum [L.] R. Br.) in Niger assessed by microsatellite markers. Theoretical and Applied Genetics 114(1):49-58.
Crossref
|
|
|
|
|
Nagarajan L, Pardey PG, Smale M (2006). Local seed systems for millet crops in marginal environments of India: industry and policy perspectives: International Food Policy Research Institute.
|
|
|
|
|
Nei M, Li WH (1979). Mathematical model for studying genetic variation in terms of restriction endonucleases. Proceedings of the National Academy of Sciences 76(10):5269-5273.
Crossref
|
|
|
|
|
Nei M (1978). Estimation of average heterozygosity and genetic distance from a small number of individuals. Genetics 89(3):583-590.
|
|
|
|
|
Panday S, Sindhu A, Boora KS (2002). RAPD based DNA markers linked to anthracnose disease resistance in Sorghum bicolor (L.) Moench. Indian Journal of Experimental Biology 40:206-211.
|
|
|
|
|
Pejic I, Ajmone-Marsan P, Morgante M, Kozumplick V, Castiglioni P, Taramino G, Motto M (1998). Comparative analysis of genetic similarity among maize inbred lines detected by RFLPs, RAPDs, SSRs, and AFLPs. Theoretical and Applied Genetics 97(8):1248-1255.
Crossref
|
|
|
|
|
Plaschke J, Ganal M, Röde, M (1995). Detection of genetic diversity in closely related bread wheat using microsatellite markers. Theoretical and Applied Genetics 91(6-7):1001-1007.
Crossref
|
|
|
|
|
Powell W, Machray GC, Provan J (1996). Polymorphism revealed by simple sequence repeats. Trends in plant science 1(7):215-222.
Crossref
|
|
|
|
|
Pressoir G, Berthaud J (2004a). Patterns of population structure in maize landraces from the Central Valleys of Oaxaca in Mexico. Heredity 92(2):88-94.
Crossref
|
|
|
|
|
Pressoir G, Berthaud J (2004b). Population structure and strong divergent selection shape phenotypic diversification in maize landraces. Heredity 92(2):95-101.
Crossref
|
|
|
|
|
Qi X, Pittaway T, Lindup S, Liu H, Waterman E, Padi F, Devos K (2004). An integrated genetic map and a new set of simple sequence repeat markers for pearl millet, Pennisetum glaucum. Theoretical and Applied Genetics 109(7):1485-1493.
Crossref
|
|
|
|
|
Raymond M, Rousset F (1995). An exact test for population differentiation. Evolution 49(6):1280-1283.
Crossref
|
|
|
|
|
Sahri A, Chentoufi L, Arbaoui M, Ardisson M, Belqadi L, Birouk A (2014). Towards a comprehensive characterization of durum wheat landraces in Moroccan traditional agrosystems: analysing genetic diversity in the light of geography, farmers' taxonomy and tetraploid wheat domestication history. BMC Evolutionary Biology 14:1.
Crossref
|
|
|
|
|
Sattler F, Sanogo M, Kassari I, Angarawai I, Gwadi K, Dodo H, Haussmann B (2018). Characterization of West and Central African accessions from a pearl millet reference collection for agro-morphological traits and Striga resistance. Plant Genetic Resources 16(3):260-272.
Crossref
|
|
|
|
|
Senior M, Murphy J, Goodman M, Stuber C (1998). Utility of SSRs for determining genetic similarities an relationships in maize using an agarose gel system. Crop science 38(4):1088-1098.
Crossref
|
|
|
|
|
Smith J, Kresovich S, Hopkins M, Mitchell S, Dean R, Woodman W, Porter K (2000). Genetic diversity among elite sorghum inbred lines assessed with simple sequence repeats. Crop Science 40(1):226-232.
Crossref
|
|
|
|
|
Smith JR, Carpten JD, Brownstein MJ, Ghost S, Magnuson VL, Gilbert DA, Trent JM, Collins FS (1995). Approach to genotyping errors caused by non-templated nucleotide addition by Taq DNA polymerase. Genome Research 5:312-317.
Crossref
|
|
|
|
|
Stich B, Haussmann BI, Pasam R, Bhosale S, Hash CT, Melchinger AE, Parzies HK (2010). Patterns of molecular and phenotypic diversity in pearl millet [Pennisetum glaucum (L.) R. Br.] from West and Central Africa and their relation to geographical and environmental parameters. BMC Plant Biology 10(1):216.
Crossref
|
|
|
|
|
Thomas E, Tovar E, Villafa-e C, Bocanegra JL, Moreno R (2017). Distribution, genetic diversity and potential spatiotemporal scale of alien gene flow in crop wild relatives of rice (Oryza spp.) in Colombia. Rice 10(1):13.
Crossref
|
|
|
|
|
Vanisha SN, Dhaduk JJ, Sareen N, Shahu T, Desai R (2011). Potential Functional Implications of Pearl millet (Pennisetum glaucum) in Health and Disease. Journal of Applied Pharmaceutical Science 1(10):62-67.
|
|
|
|
|
Van Inghelandt D, Melchinger AE, Lebreton C, Stich B (2010). Population structure and genetic diversity in a commercial maize breeding program assessed with SSR and SNP markers. Theoretical and Applied Genetics 120(7):1289-1299.
Crossref
|
|
|
|
|
Weir BS, Cockerham CC (1984). Estimating Fâ€statistics for the analysis of population structure. Evolution 38(6):1358-1370.
|
|
|
|
|
Weir BS (1996). Genetic data analysis. II. 2nd ed. Sinauer Associates, Inc, Sunderland, MA. pp.1-437.
|
|