ABSTRACT
Screening of micropropagated banana (Musa spp.) cv. Grand Naine for somaclonal variants was carried out in the open field. The total detected variants were 26 somaclones (in addition to the normal plant) and were grouped into eight groups according to their morphological and yield characteristics. Sequence Related Amplified Polymorphism (SRAP) and Target Region Amplified Polymorphism (TRAP) techniques were used to study the differences among banana cv. Grand Naine and 26 somaclonal variants of the cultivar. SRAP markers amplified 1463 fragments while 841 fragments were resulted from TRAP markers. The somaclones “double bunching from peduncle”, “Giant plant” and “weak plant” somaclones were clustered with Grand Naine according to SRAP markers while “empty peduncle”, “horizontal bunch” and “angled bunch” somaclones clustered with Grand Naine using TRAP markers. According to principal coordinate analysis with SRAP markers, “pale green”, “black”, “wavy margins”, “double bunch from stem” and “vertical upward bunch” segregated from other variants; whereas, “pale green”, “black” and “vertical upward bunch” segregated from other variants using TRAP marker data. Although these markers were able to distinguish some of the somaclones derived from micropropagation of Grand Naine, additional markers would be needed to identify mutations generation during tissue culture propagation of banana.
Key words: Banana, sequence related amplified polymorphism, target region amplified polymorphism, cluster analysis, principal coordinate analysis, genetic diversity.
Banana (Musa spp.) is one of the most important fruit crops, which is grown in 128 countries especially in the developing countries of the tropical and subtropical regions. Approximately 5 million hectares are under banana cultivation with 106 Million metrictons produced worldwide (FAO, 2016). Plants propagated by invitro tissue culture techniques are known to exhibit a wide array of genetic and epigenetic variation (James et al., 2007). Variation may interfere with the use of these cultures for physical or chemical mutagenesis and/or genetic transformation. Although the causes of genetic instability are poorly understood, chromosome instability is believed to be one of the most common causes of tissue culture-induced variation (Roux et al., 2004).
Detection and analysis of genetic variation can help us to understand the molecular basis of different biological phenomenon in plants (Abdellatif and Soliman 2013) and gene expression (Eldemery et al, 2016). Sequence-Related Amplified Polymorphism (SRAP) markers have been adapted for a variety of purposes; including map construction, gene tagging and genetic diversity studies (Gulsen et al., 2006). The SRAP marker technology combines simplicity, reliability, and moderate throughput with the ability to sequence selected bands (Li and Quiros, 2001).
Target Region Amplification Polymorphism (TRAP) technique (Hu and Vick, 2003) is a rapid and efficient PCR-based methodology, which utilizes bioinformatics tools and expressed sequence tag (EST) database information to generate polymorphic markers for targeted candidate gene sequences. Thus, the TRAP technique is useful for generating markers associated with desirable agronomic traits for marker-assisted breeding. The technique has been effectively used for fingerprinting in plant species (Hu et al., 2005; Alwala et al., 2006; Liu et al., 2005). Garcia et al. (2011) used TRAP markers in 14 diploid Musa genotypes and produced 119 alleles. They reported that TRAP markers have been shown to discriminate A or B genome Musa genotypes.
The objective of this study was to genetically characterize the banana cultivar Grand Naine and 26 somaclonal variants derived from in vitro tissue culture of Grand Naine using SRAP and TRAP molecular markers.
Plant material and DNA extraction
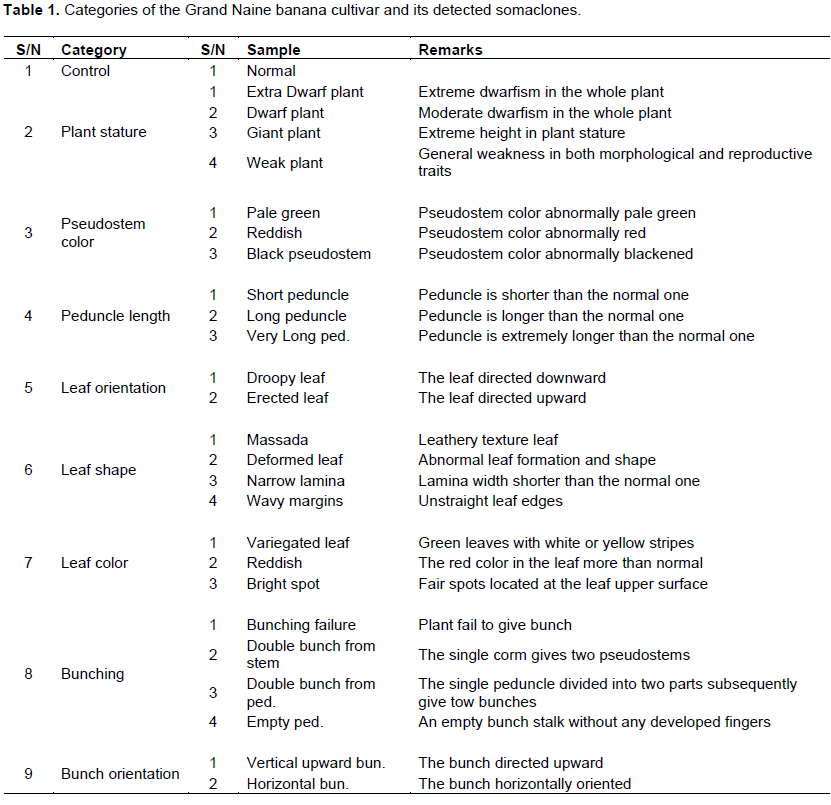
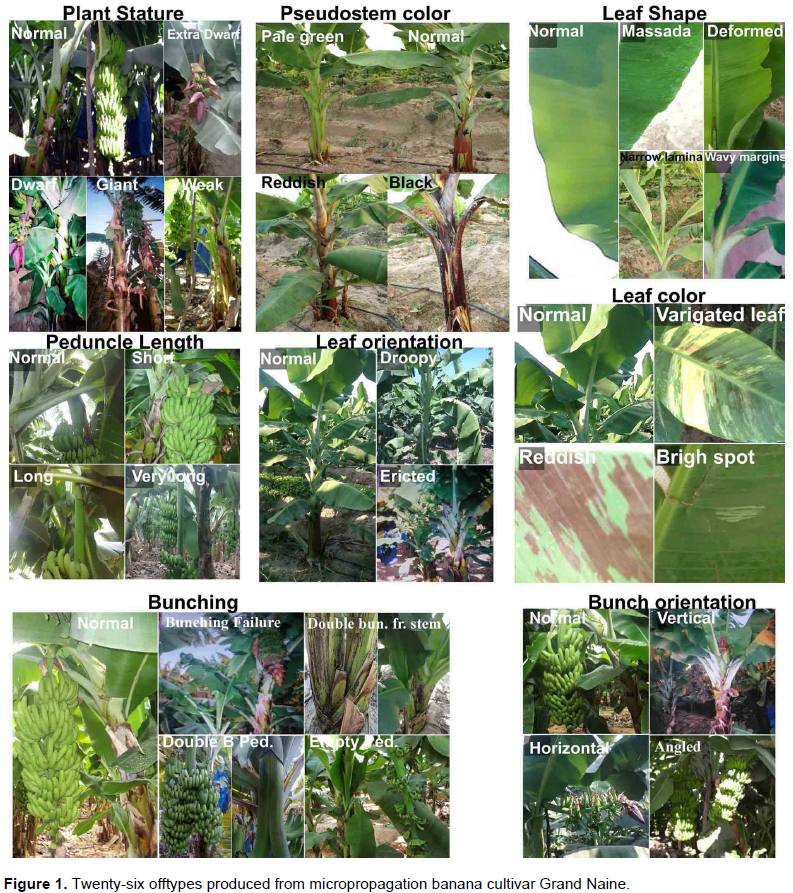
Healthy and uniform offshoots of banana cultivar ‘Grand Naine’ and 26 somaclonal variants of Grand Naine were selected from a farm sited in Ahmed Oraby Village, Badr City, El-Beheira Governorate, Egypt in March 2016 (Table 1). Somaclones were developed according to Hegazy et al. (2010). The somaclonal variants were categorized into eight groups based on phenotypic characteristics (Table 1 and Figure 1). Fresh cigar leaves from the 26 genotypes and Grand Naine were frozen in liquid nitrogen and transferred to the Plant Molecular Biology Laboratory, Plant Biotechnology Department, Genetic Engineering and Biotechnology Research Institute (GEBRI), University of Sadat City, Egypt where they were stored at -80°C. Total genomic DNA was isolated from 2 g of leaf tissue using the standard CTAB method as described by Saghai-Maroof et al. (1984). DNA concentrations were adjusted to 25 ng/µl and stored at -20°C.
Sequence related amplified polymorphism (SRAP)
SRAP analysis was performed using nine primer pair combinations (Table 2) specific to banana as reported by Li and Quiros (2001). PCR reactions were performed in 15 µl reaction volumes containing 7.5 µl master mix (iNtRON Biotechnology, Co.), 250 µM of each primer, and 100 ng of template DNA. PCR fragment amplification was performed for 35 cycles at 95°C for 1 min, 45°C for 1 min and 72°C for 1 min with an initial denaturation step at 95°C for 7 min and a final extension step at 72°C for 5 min.
Target region amplified polymorphism (TRAP)
Eight TRAP primer pairs combinations (Table 2) were used as described by Hu and Vick (2003). PCR amplification reactions were carried out in 15 µl reaction volumes consisting of 7.5 µl master mix (iNtRON Biotechnol. Co.), 250 µM of each primer and 100 ng of template DNA. Amplifications were conducted using a touchdown PCR program for seven cycles with annealing temperature starting from 51°C and decreasing one degree each cycle until 45°C, then a program of 30 cycles was carried out at 95°C for 1 min, 45°C for 1 min and 72°C for 1 min. An initial denaturation at 95°C for 7 min and a final extension at 72°C for 5 min were performed before holding at 10°C.
Data analysis
PCR products of both SRAP and TRAP markers were separated on 1.5% ethidium bromide-stained agarose gels using 1X TBE buffer running buffer and electrophoresed at 100 volts for 1 h. A 50 bp DNA ladder was used as indicator for DNA fragments size. Agarose gels were photographed on gel documentation system. Gels were scored as 0/1 for absence/presence of DNA fragments, respectively. The total number of band, the number of polymorphic bands and the percentage of polymorphism were calculated. The polymorphic information content (PIC) was calculated according to Anderson et al. (1993) using the following formula: PICi = 1 - Æ©pij2, where pij is the frequency of the jth allele for marker i summed across all alleles for the locus. Data were analyzed using cluster analysis. Similarity matrices were calculated using Jaccard coefficient (Jaccard, 1908). Dendrograms were constructed based on the UPGMA clustering method using NTSYSpc software version 2.0 (Applied Biostatistics, Setauket, New York, USA) (Rohlf, 1998). Principal coordinate analysis was carried out for the standardized decentered SRAP and TRAP data. Eigen values and Eigen vectors were calculated for the transformed interval data and the three dimensional principal coordinate analysis plot was constructed using the NTSYSpc software.
SRAP and TRAP pattern
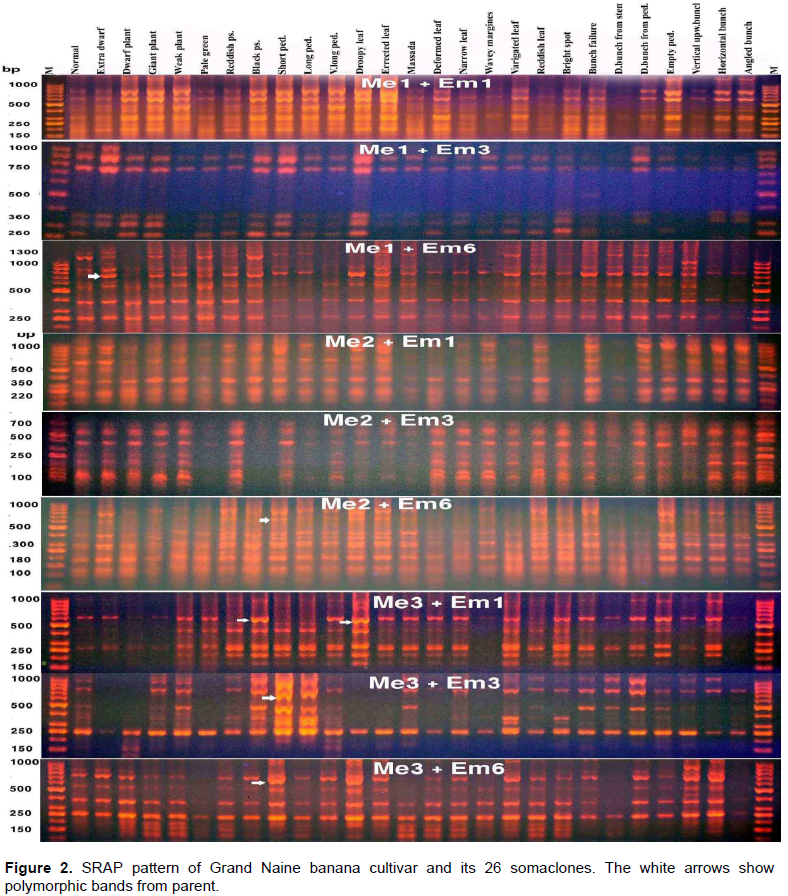
The pattern of the amplified fragments of the PCR products of SRAP markers ranged in length from 100 to 1200 bp. All primer pair combinations produced common bands as well as polymorphic bands. In addition some specific fragments were amplified in specific somaclones. The most important fragment which was amplified at molecular weight 1000 bp in length by the primer pair “Me1+Em6” only in the pattern of the somaclone “Vertical upward bunch” could be specific for that variant. The same thing was noticed also in the pattern of the primer pair combination “Me1+Em6” for the somaclone “Short peduncle”, in which a specific fragment was amplified at molecular weight 600 bp (Figure 2).
The length of the amplified fragments by the TRAP primer pairs ranged from 150 to 1000 bp and all of the primer pair combinations showed polymorphic amplified fragments. As in the SRAP pattern, some specific bands were obtained in specific somaclones. Examples of these amplified fragments are illustrated by white arrows on Figure 3. The most obvious fragments are those amplified by the primer pair combination “MUSA1+T4” at 600 bp in the pattern of “Erected leaf” and primer pair combination “MUSA2+T3” at 400 bp in the pattern of both “short peduncle” and “long peduncle” variants (Figure 3).
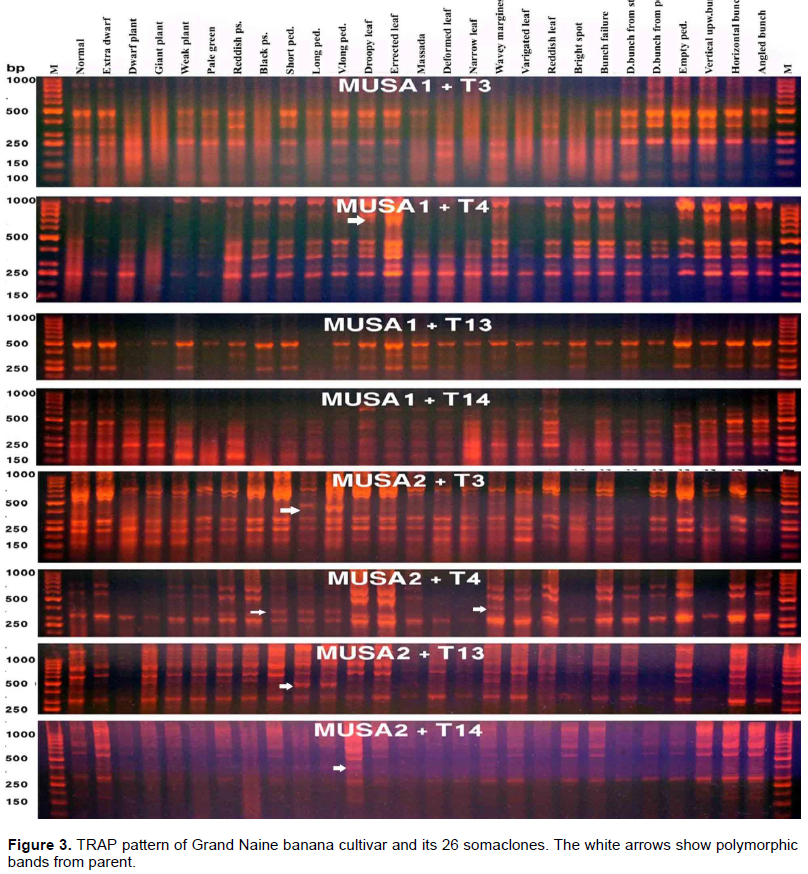
The above mentioned results suggest that tissue culture propagation of banana plants produce genetic variation. These variations may be genetic or epigenetic variation. Krishna et al. (2016) reported that plant tissue culture may generate genetic variability, that is, somaclonal variations as a result of gene mutation or changes in epigenetic marks. Garcia et al. (2011) used TRAP markers to study genetic diversity in banana plants and they proved their efficiency in this regard. Same notes were reported by Abdellatif et al. (2012) and Krishna et al. (2015).
SRAP and TRAP polymorphism
For both SRAP and TRAP markers, 17 primer pairs amplified different numbers of bands through the genotypes. The primer pair “Musa1+ T13” detected only three scorable bands, all of them were polymorphic; while the primer pair “Me1+ Em1” showed amplification of ten bands with polymorphism percentage of 90%. The polymorphic information content (PIC) of the primer pairs ranged between 0.65 for the TRAP primer pair “Musa1+T13” and 0.95 for the SRAP primer pair “Me1+Em1”. Thus, it can be said that both marker types generated polymorphisms and informative amplified fragments. In general, the PIC for the SRAP primers was higher than the PIC for the TRAP markers (Table 2).
Cluster analysis
SRAP data cluster analysis generated seven clusters (Figure 4). Grand Naine clustered with “double bunch from peduncle”; whereas, the other somaclones formed the other clusters. It was observed that “horizontal bunch” and “angled bunch” which belonged to the bunch orientation category were clustered together at high rate of similarity. Also, “droopy leaf” and “erected leaf” which belonged to the leaf orientation category were clustered together at high rate of similarity. The three leaf shape genotypes “narrow leaf”, “deformed leaf” and “massada” also clustered together in one cluster (Figure 4).
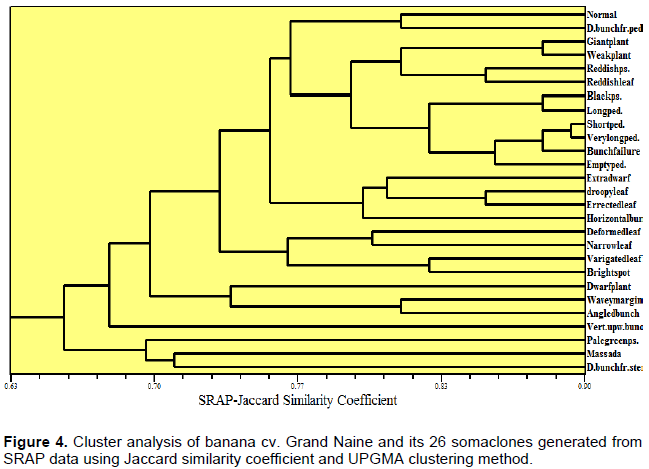
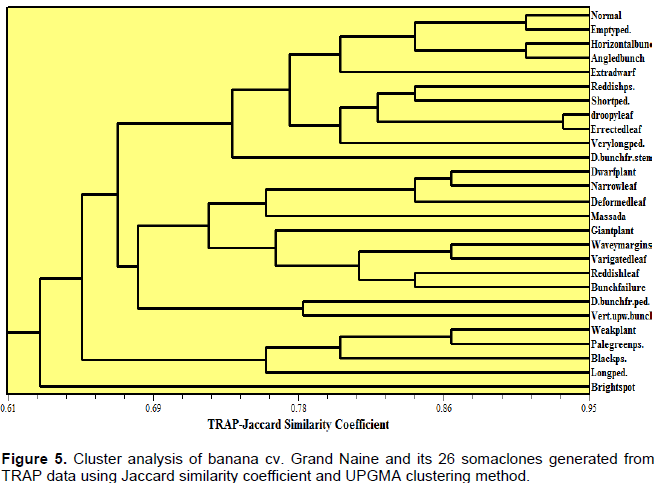
TRAP data cluster analysis generated six clusters (Figure 5). “Grand Naine”, “empty peduncle”, “horizontal and angled bunch” somaclonal variants formed one cluster. It can be noticed that somaclones “droopy” and “erected leaf” showed the same trend of similarity according to SRAP and TRAP analyses. Most of the somaclonal variants clustered according to their phenotypic categories. Our results are in agreement with those of Garcia et al. (2011).
Principal coordinate analysis
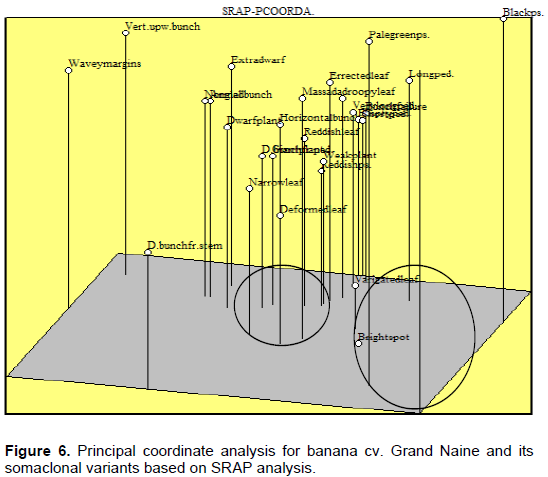
From the SRAP marker data, the first three principle coordinates (PCs) accounted for 33.9% of the total variation (for example 12.5% for PC1, 11.7% for PC2 and 9.6% for PC3). The distribution somaclones is presented in Figure 6 with “Wavy margins”, “Vertical upward bunch” and “Black pseudostem” somaclones separated from the other somaclones based on PC1. “Double bunch from stem” somaclone was segregated apart from the other somaclones based on the PC2. For the PC3 coordinate, “Black pseudostem”, “Vertical upward bunch”, “pale green” and “bright spot” somaclones were separated from the other types of somaclones. “Normal plant”, “angled bunch”, “dwarf plant” and “extra dwarf” somaclones were aggregated together according to the three coordinates. These results were consistent with the data reported Abdellatif et al. (2012).
The first three principle coordinates (PCs) for the TRAP marker data accounted for 41.8% of the total variation (for example 16.9, 15.8 and 9.1% for PC1, PC2 and PC3, respectively). The somaclones were aggregated near from the middle of the PC1 into two groups (Figure 7). The first group included the somaclones “dwarf”, “giant”, “weak”, “reddish pseud.”, “droopy leaf”, “reddish leaf”, and “double bunch from peduncle” while the second group contained the somaclones“extradwarf”,“short ped.”, “very long ped.” “Wavy margines”, “bunching failure”, “empty peduncle”, “horizontal bunch” and “angled bunch” in addition to the “Grand Naine”. The somaclones “pale green”, “black” and “vertical upward bunch” were separated from other variants based on PC1. The somaclones “Dwarf plant” and “horizontal bunch” were separated from the other variants at PC2. On the other hand, the somaclones “Pale green pseudostem”, “Weak plant” and “Extra dwarf” were located at the highest level and “bright spot” was located at the zero level at PC3.
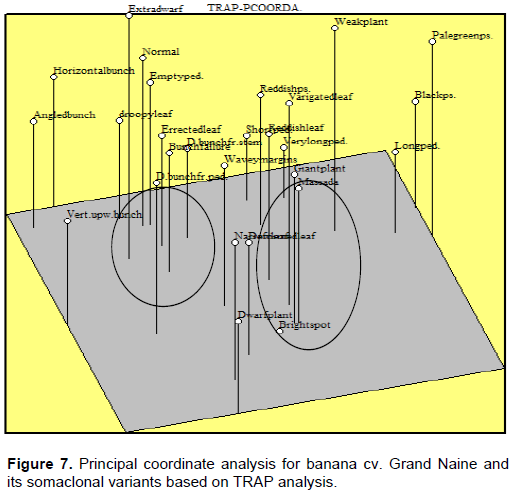
The results obtained by principal coordinate analysis are similar to the results of the cluster analysis. Both analyses revealed high level of genetic variance among somaclones. Many factors are known to influence in vitro induced variation; however, it has been proposed that hypo/hyper methylation of DNA, which may trigger genome-wide changes, may be the underlying cause (Damasco et al., 1998). The inherent instability of the cultivar being micropropagated was another major factor influencing the production of dwarf off-types. Oh et al. (2007) reported that the molecular basis of somaclonal variation is not precisely known, but both genetic and epigenetic mechanisms have been proposed; whereas James et al. (2007) stated that the source of this variation may be derived from variation pre-existing in the mother plant or it may be induced in vitro. Sales and Butardo (2014) reported that somaclonal variation is due to prolonged subculture and high 2, 4-D concentration.
Molecular analysis based on Sequence Related Amplified Polymorphism (SRAP) and Target Region Amplified Polymorphism (TRAP) using 12 arbitrary primers revealed genetic variability between cv. “Grand Nain” and 26 somaclones. Most of the somaclones aggregated together depending upon the different PCs, this suggests that most somaclones may reflect epigenetic changes which happened during in vitro culture. The somaclone “pale green” may be genetically different from the normal plant according to the principal coordinate analysis which suggests that its change is not epigenetic. The results reflect the efficiency of SRAP and TRAP markers in detecting banana somaclonal variation.
The authors have not declared any conflict of interests.
REFERENCES
|
Abdellatif KF, Hegazy AE, Aboshama HA, Emara HA, El-Shahed AA (2012) Morphological and molecular characterization of somaclonal variations in tissue culture-derived banana plants. J. Genet. Eng. Biotechnol. 10(1):47-53.
Crossref
|
|
|
|
Abdellatif KF, Soliman YA (2013). Genetic relationships of cotton (Gossypium barbadense L.) genotypes as studied by morphological and molecular markers. Afr. J. Biotechnol. 12(30): 4736-4746.
Crossref
|
|
|
|
|
Alwala S, Suman A, Arro JA, Veremis JC, Kimbeng CA (2006). Target region amplification polymorphism (TRAP) for assessing genetic diversity in sugarcane germplasm collection. Crop Sci. 46:448-455.
Crossref
|
|
|
|
|
Anderson JA, Sorrels ME, Tanksley SD (1993). RFLP analysis of genomic regions associated with resistance to pre- harvest spouting in wheat. Crop Sci. 33:453-459.
Crossref
|
|
|
|
|
Damasco O, Smith M, Adkins S, Hetherington S, Godwin I (1998). Identification and characterization of dwarf off-types from micropropagated Cavendish bananas. Acta-Hort. 490:79-84.
Crossref
|
|
|
|
|
Eldemery SMM, Abdellatif KF, El-Absawy EA, Emara HA, El- Rodeny WM, Zakaria AM (2016). Gene expression induced in faba bean (Vicia faba L.) by Orobanche crenata and its impact on the field level. Egypt. J. Genet. Cytol., 45:279-295.
|
|
|
|
|
FAO (Food and Agricultural Organization). Statistics 2016 data available at the website: www.fao.org
|
|
|
|
|
Garcia SAL, Talebi R, Ferreira CF, Vroh BI, Paiva LV, Kema GHJ, Souza MT (2011). Identification and validation of EST-derived molecular markers, TRAP and VNTRS for banana research. Acta-Hort. 897:69-80.
Crossref
|
|
|
|
|
Gulsen O, Karagul S, Abak K (2006). Diversity and relationships among Turkish okra germplasm by SRAP and phenotypic marker polymorphism. Biologia 62:41-45.
|
|
|
|
|
Hegazy AE, Aboshama HM, Emara HA, El-Shahed AA (2010). Biotechnological Studies on Banana Plant: 1. Screening of Vitroplants for Somaclonal Variations in: 28th International Horticultural Congress, Lisbon, Portugal, 22–27 August, P 63.
|
|
|
|
|
Hu J, Ochoa OE, Truco MJ, Vick BA (2005). Application of the TRAP technique to lettuce (Lactuca sativa L.) genotyping. Euphytica 144:225–235.
Crossref
|
|
|
|
|
Hu J, Vick BA (2003). Target region amplification polymorphism: a novel marker technique for plant genotyping. Plant Mol. Biol. Rep. 21:289-294.
Crossref
|
|
|
|
|
Jaccard P (1908). Nouvelles recherches sur la distribution florale. Bull. Soc. Vaudoise Sci. Nat. 44:223-270.
|
|
|
|
|
James A, Peraza-Echeverria S, Peraza-Echeverria L, Herrera-Valenci V (2007). Variation in micropropagated plants. Acta-Hortic. 748:55-63.
Crossref
|
|
|
|
|
Krishna H, Alizadeh M, Singh D, Singh U, Chauhan N, Eftekhari N, Sadh RK (2016). Somaclonal variations and their applications in horticultural crops improvement. 3 Biotechnol. 6:54.
|
|
|
|
|
Krishna H, Eftekhari M, Modareskia M, Modareskia M (2015). Assessment of clonal fidelity in micropropagated horticultural plants. J. Chem. Pharm. Res. 7(12):977-990.
|
|
|
|
|
Li G, Quiros CF (2001). Sequence-related amplified polymorphism (SRAP), a new marker system based on a simple PCR reaction: its application to mapping and gene tagging in Brassica. Theor. Appl. Genet. 103:455-546.
Crossref
|
|
|
|
|
Liu Z, Anderson JA, Hu J, Friesen TL, Rasmussen JB, Faris JD (2005). A wheat intervarietal linkage map based on microsatellite and target region amplified polymorphism markers and its utility for detecting quantitative trait loci. Theor. Appl. Genet. 111:782-794.
Crossref
|
|
|
|
|
Oh TJ, Cullis MA, Kunert K, Engelborghs I, Swennen R, Cullis CA (2007). Genomic changes associated with somaclonal variation in banana (Musa spp.). Physiol. Plant. 129(4):766-774.
Crossref
|
|
|
|
|
Rohlf FJ (1998). NTSYSpc. Numerical taxonomy and multivariate analysis system, version 2.02c. Exeter Software, New York.
|
|
|
|
|
Roux N, Strosse H, Toloza A, Panis B, Dolezel J (2004). Detecting ploidy level instability of banana embryogenic cell suspension cultures by flow cytometry. Banana improvement: cellular molecular biology, and induced mutations. Proceedings of a meeting held in Leuven, Belgium, 24-28 September, pp. 251-261.
|
|
|
|
|
Saghai-Maroof MA, Soliman KM, Jorgensen RA, Allard RW (1984). Ribosomal DNA spacer length polymorphism in barley. Mendelian inheritance, chromosomal location and population dynamics. Proc. Nat. Sci. 81:8014-8018.
Crossref
|
|
|
|
|
Sales EK, Butardo NG (2014). Molecular Analysis of Somaclonal Variation in Tissue Culture Derived Bananas Using MSAP and SSR Markers. Inter. J. Biol. Biomol. Agric. Food Biotechnol. Eng. 8(6):615-622
|
|
