Full Length Research Paper

ABSTRACT
Hormesis is a biphasic dose (concentration)-response phenomenon characterized by low dose stimulatory and high dose inhibitory effects exerted by stressors on living organisms. Recently, there has been increased interest in the phenomenon and statistical models for its exploration in toxicological studies. The bilogistic model of Beckon et al. is one of such models for modeling biphasic dose-response relationships in toxicological studies. However, there is no explicit formula for the estimation of effective doses (EDK) with the model. In this study, a simple general approach was suggested to reparameterize the model, leading to a range of mathematical models for determination of effective doses at both stimulatory and inhibitory ranges in inverted U-shaped hormetic dose-response relationships. The reparameterized models were tested on experimental data from three different in vitro experimental systems obtained from literature and our experiment. They were successfully applied to test for significance of hormesis and estimate effective doses and their statistical properties. In addition, reparameterization of the model for a particular effective dose (EDK) did not affect estimation of other parameters (such as x1, x2, β1, β2 and M). The reparameterized models provided useful tools for adequate exploration of the tested hormetic dose-response relationships. The extended models could hopefully be versatile in characterization of variable hormetic dose response relationships in many toxicological disciplines.
Key words: Toxicity, hormesis, hormesis quantities, model extension, concentration-responses.
INTRODUCTION
Hormesis is a dose-response relationship characterized by a low dose stimulation and high dose toxicity of a stressor. This phenomenon has been reawakened after a long period of marginalization and controversies. Hormesis has been reported to be generalizable, occurring in all forms of organisms for many endpoints and induced by physical and chemical agents including heavy metals, herbicides, phenols, parthenin, perfluorinated carboxylic acids, antibiotics, mycotoxins, bacteriocins and ionic liquids (Mulkiewicz et al., 2007; Shen et al., 2009; Belz and Cedergreen, 2010; Migliore et al., 2010; Murado and Vázquez, 2010; Belz et al., 2011; Wang et al., 2011; Li et al., 2014; Wang et al., 2014; Nweke et al., 2015). Hormesis has attracted a renewed interest among toxicologists, resulting in the development of new tools to study and accumulate scientific reports on the phenomenon. Thus, there has been a growing interest in statistical models to study hormetic dose-response relationships.
The literature contains a wide range of statistical models for characterizing hormetic dose-response relationships. The applications of these models in toxicological studies with emphasis on their strengths and weaknesses were reviewed by Nweke and Ogbonna (2017). The Brain-Cousens model (Equation 1) derived from the general monotonic log-logistic equation is one of the earliest and well-known dose-response models enabling hormesis (Brain and Cousens, 1989).
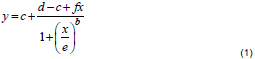
In Equation 1, y is the response, x is the dose (concentration), d represents the mean response of the untreated control, c is the response at infinite dose, f measures the rate of stimulation of the response at low dose (f > 0 is a necessary condition for the presence of hormesis), e and b lost their interpretations as the ED50 and relative slope at ED50, respectively and thus have no straightforward biological meaning (Schabenberger et al., 1999; Cedergreen et al., 2005). The influences of parameters f, e and b on the shape of the curves are shown in Figure 1. Notably, if the value of f is negative, the curve has a valley instead of a peak (Figure 1a).
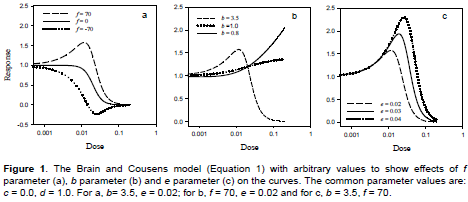
Although the Brain-Cousens model has been used to describe hormetic dose-response relationships in toxicological studies, it has some drawbacks. The value of b in the model is restricted to greater than 1. At b < 1 the model does not produce any dose-response curve (Figure 1b) (Cedergreen et al., 2005). Thus, the model cannot describe shallow dose-response curves. The Brain-Cousens model is also less suitable for data exhibiting a broad hormetic dose range and/or an early increase in response at low dose (Belz and Piepho, 2012). In the Brain-Cousens model, the switching function for describing hormesis is linear and curve increases progressively from d. Thus, the model cannot describe the initial “no-effect” and pre-stimulation toxicity at low doses (Belz and Piepho, 2012; Beckon et al., 2008). In addition, the Brain-Cousens model has no explicit expression for the ED50 and other effective doses. In order to solve this problem, the model was reparameterized to include ED50 and other effective doses as parameters in the model (Van Ewijk and Hoekstra, 1993; Schabenberger et al., 1999). The reparameterizations of Brain-Cousens model by Schabenberger et al. (1999) for determination of effective doses (EDK) and dose of maximum stimulation (M) are shown in Equations 2 and 3, respectively.
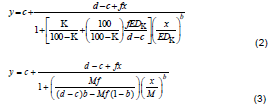
where K is the percentage inhibition and EDK is the dose of the effecter that elicited K inhibition of the response (such that K = 50 for ED50, K = -10 for ED-10 and K = 0 for LDS).
These reparameterized models are used in toxicological studies to estimate the effective doses and their statistical properties (Nweke et al., 2015, 2016; Schabenberger et al., 1999; Zelaya and Owen, 2005; Zou et al., 2013).
Due to the inadequacies of the Brain-Cousens model, Cedergreen et al. (2005) modified the model to introduce a six-parameter version (Equation 4).
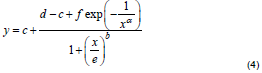
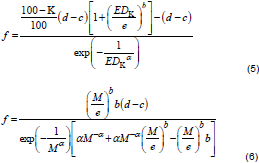
In Equation 4, f is the hormesis parameter (f > 0 as a necessary condition for hormesis), parameters c and d are defined as in Equation 1, while parameters α, b and e have no straightforward biological interpretation (Cedergreen et al., 2005). A reparameterization of Cedergreen-Ritz-Streibig model could be used for estimation of effective doses (EDK) and dose (M) at which maximum stimulation occurred by replacement of parameter f with the functions shown in Equations 5 and 6, respectively.
According to Cedergreen et al. (2005), the model is more robust in terms of variation of data and describing both very large and relatively small hormetic effects when compared to the Brain-Cousens model. The Cedergreen-Ritz-Streibig model could better describe data sets characterized by early increase in response at low dose and a broad hormetic dose range (Belz and Piepho, 2012). In addition, the model is more flexible than the Brain-Cousens model to describe dose-response relationships where there is toxicity before the initiation of stimulatory response. Belz and Piepho (2012) compared the utility of Brain-Cousens and Cedergreen-Ritz-Streibig models in describing the hormetic response of four plants to fifteen chemical stressors and affirmed that the diverse hormetic dose responses cannot be described by a single model. Some hormetic dose-responses were better described by either Brain-Cousens model or Cedergreen-Ritz-Streibig model. Interestingly, the data set describing the phytotoxic effect of 2-phenylethyl-isothiocyanate on root growth of Amaranthus hybridus could neither be appropriately fitted by the Cedergreen-Ritz-Streibig model nor the Brain-Cousens model (Belz and Piepho, 2012). The improved flexibility of Cedergreen-Ritz-Streibig model was attributed to the introduction of the parameter α (Zhu et al., 2013). Nevertheless, the value of α has to be fixed when the available data is not enough to determine the rate of increase statistically. In order to allow for explicit determination of effective doses and their statistical properties, Belz and Piepho (2012) reparameterized the original equation. The Cedergreen-Ritz-Streibig model has been widely used to especially describe herbicide hormesis in plants (Cedergreen et al., 2007; 2009; Cedergreen and Olesen, 2010; Belz and Leberle, 2012).
Another model proposed for description of hormetic dose-response relationships is the bilogistic model (Equation 7) of Beckon et al. (2008).
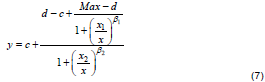
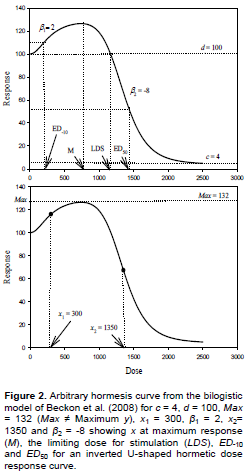
In Equation 7, parameters d and c are as defined in Equation 1 and the parameter Max is the theoretical maximum (not ymax) that would be approached asymptotically by the rising component of the equation in the absence of the descending component (or vice versa), β1 represents the rising slope (+), x1 is the dose at midpoint of the rising curve, β2 represents the falling slope (-), x2 is the dose at midpoint of the falling curve. The bilogistic model plotted with arbitrary values of the parameters is as shown in Figure 2. The bilogistic model can be viewed as a modification of the Brain-Cousens model, by introduction of a logistic weighting function at hormesis region which describes the rising curve of the dose-response model. The model reduces to log-logistic model if any of the slope parameters is zero, thus allowing simple statistical test for hormesis. The bilogistic model provided better description of hormetic dose-response relationships than the Brain-Cousens model when tested with empirical data (Beckon et al., 2008). The parameter Max is only a theoretical maximum and not the actual maximum effect that would be approached by the upslope in the absence of the downslope. Therefore, there is disagreement between the fitted Max and its corresponding theoretical interpretation. This limitation has been highlighted by Zhu et al. (2013) and the model was therefore adjudged as inappropriate for describing hormetic data in their study. However, they acknowledged that the bilogistic model is statistically sound and performed better than the Brain-Cousens and Cedergreen-Ritz-Streibig models with respect to the data under review.
The bilogistic model comprises one logistic ascending curve and one logistic descending curve similar to the descending curve of Brain-Cousens and Cedergreen-Ritz-Streibig models. Thus, the model is particularly suited for hormetic data having logistic dose-response relationship at low doses. In addition, the bilogistic model provides considerable improvements when modeling data that include a wide range of doses from well below to well above the dose corresponding to maximum response (Beckon et al., 2008). The bilogistic model, like the original Brain-Cousens and Cedergreen-Ritz-Streibig models, has no explicit parameter for the effective doses. The Brain-Cousens and Cedergreen-Ritz-Streibig models have been extended to allow estimation of effective doses (Van Ewijk and Hoekstra, 1993; Schabenberger et al., 1999; Belz and Piepho, 2012). However, there has been no similar extension of the bilogistic model. According to Zhu et al. (2013), mathematical manipulation is not suitable for the bilogistic model because of its complexity and multiparametric nature. Reparameterization of models for the purpose of estimating effective doses has been discouraged to promote the use of bisection method based on monotone functions (Cedergreen et al., 2005; Zhu et al., 2013). Nonetheless, the computation of effective doses and their standard errors by a combined application of bisection and delta methods has its limitations. Applying the delta method, Cedergreen et al. (2005) could not estimate the limiting dose of stimulation (LDS) which is the dose at which hormesis vanishes (ED0). In addition, the dose for maximum stimulation (M) was obtained without standard errors and confidence intervals. Thus, use of reparameterized function can be a more convenient tool for estimating effective doses in biphasic dose-responses. Reparameterization of the Cegergreen-Ritz-Sreibig model has been shown to be applicable to calculation of arbitrary effective doses at both stimulatory and inhibitory ranges (Belz and Piepho, 2012, 2015).
A wide range of hormetic dose-response patterns which cannot be described by a particular hormesis model are usually generated in toxicological studies. Each model has its own strengths and weaknesses. Therefore, application of a specific model is dependent on the uniqueness of the data under analysis. The bilogistic model has been shown to be superior to Brain-Cousens and Cedergreen-Ritz-Streibig models in modeling some hormetic dose-responses (Beckon et al., 2008; Belz and Piepho, 2012). Undoubtedly, the model presents an additional statistical tool for the analysis of biphasic dose-response relationships where other models may fail. It is therefore important to reparameterize the model for determination of effective doses and hormesis quantities. This would present expanded possibilities and help to get rid of the bias inherent in using other models for a specific dose-response pattern where the bilogistic model will be more appropriate. Hence, the purpose of the present work was to provide a general method for reparameterization of the bilogistic model to allow for the estimation of effective doses (EDK) at both stimulatory and inhibitory ranges and the dose at which maximum stimulation occurred (M). Using hormetic dose-responses for illustration, the modeling approach was applied to characterize inverted U-shaped curves.
MATERIALS AND METHODS
Reparameterizations
The bilogistic hormesis model (Beckon et al., 2008) does not include any effective dose as a parameter in its original form. Thus, this study extended the model to generate other functions that expressed it in terms of parameters that correspond to the effective doses of dose-response relationships. The bilogistic model was reparameterized to incorporate the arbitrary effective doses (EDK including ED-10 [K= -10}, ED50 [K= 50] and ED0 [K = 0] also called LDS) and the dose at which the maximum stimulatory effect occurred (M) by applying the defining relationship described by Schabenberger et al. (1999).
Reparameterization for EDK
The defining relationship for an arbitrary effective dose (EDK) for K % inhibition of response is:
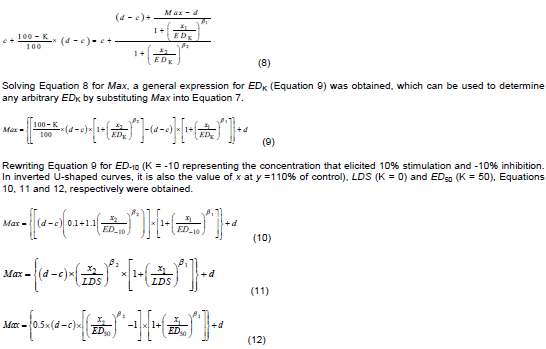
Substituting Max (in Equations 10 to 12) into the original bilogistic model (Equation 7), leads to extended functions allowing for hormesis and in which ED-10, LDS, and ED50 can be incorporated.
Reparameterization for M
In order to obtain the expression for the dose M, at which maximum stimulatory effect occurred, Equation 7 was differentiated with respect to x to obtain the first derivative of the function. In order to achieve this, Equation 7 was first simplified as Equation 13 and differentiated with respect to x.
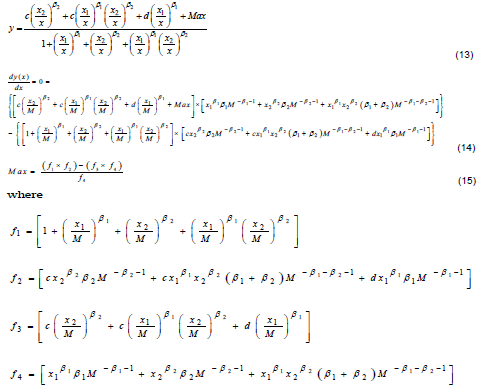
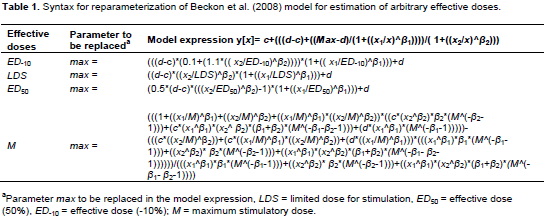
The first derivative of the function must equal zero at maximum stimulation (x=M). Thus, the defining relationship as shown in Equation 14 was obtained. Solving Equation 14 for Max gives Equation 15. By substituting Max (in Equation 15) into Equation 7, a 7-parameter hormesis dose-response model for the incorporation of M into the bilogistic model was obtained. Although these models appear complex, they can easily be coded into a nonlinear regression package using syntaxes shown in Table 1.
The hormesis data
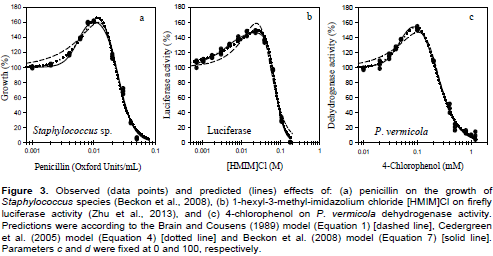
Three sets of hormetic dose-response data from three different experimental systems were used in this study to evaluate the original and the reparameterized models. The dose-response data include: (1) the biphasic effects of penicillin on growth of Staphylococcus species (Beckon et al., 2008). The growth of Staphylococcus sp. at different concentrations of penicillin was transformed relative to the control response (% of control) as described by Nweke and Ogbonna (2017), (2) the biphasic effects of 1-hexyl-3-methyl-imidazolium chloride ([HMIM]Cl) on firefly luciferase activity after 15-min exposure (Zhu et al., 2013). The relative luminescence units (RLUs) of the luciferase exposed to [HMIM]Cl were measured with SpectraMax M5 microplate reader (Molecular Devices Inc., USA) with a 96-well microplate (Zhu et al., 2013). The data were transformed to percent inhibition by multiplying the relative ratios by 100 and then converted to an inverted U-shaped dose-response relationship (% of control) by subtracting the percent inhibition from 100 as described elsewhere (Nweke and Ogbonna, 2017) and (3) the biphasic effects of 4-chlorophenol (4-CP) on Providencia vermicola dehydrogenase activity. The assay was based on reduction of 2,3,5-triphenyltetrazolium chloride to triphenyl formazan in response to varying concentrations of 4-CP. The data were generated in our laboratory using 24-h dehydrogenase activity assay as described by Nweke et al. (2014). The concentration-effect data were transformed relative to control as described by Nweke and Ogbonna (2017).
Dose-response modeling
As mentioned earlier, the Beckon et al. (2008) model (Equation 7) reduces to log-logistic model if any of the slope parameters (β1 and β2) is zero, thus allowing simple statistical test for hormesis. The growth of Staphylococcus sp., firefly luciferase activity or dehydrogenase activity in P. vermicola as a function of concentrations of penicillin, [HMIM]Cl or 4-CP respectively were fitted into the original model (Equation 7) using user-defined function in TableCurve 2D v. 5.01 curve fitting software by least squares minimization of residuals to test for the statistical significance of hormesis. In all data, the 95% confidence interval of the slopes β1 and β2 did not include zero indicating significant hormetic effects of the respective substance on the tested response. The parameters of the model were estimated freely without constraint at the first instance. The data were also fitted to Equation 7 without constraint on c while d was fixed at 100% and then with c and d fixed at 0 and 100%, respectively. The initial values of x1, x2, c and d used in the curve fitting were graphically deduced from x-y data plots. The initial values of Max, β1 and β2 were manually adjusted until the predicted curve became close to the observed data. Subsequently, all parameters were automatically optimized to best initial parameter estimates in TableCurve 2D software. The values of ED-10, LDS, ED50 and M were estimated by reparameterization according to Equations 10, 11, 12 and 15, respectively using graphically-anticipated initial parameters as optimized in TableCurve 2D. The ED-10 has two possible values, one on the left side of M (ED-10L) and another on the right side of M (ED-10R). In order to differentiate the two ED-10 values, constraint was applied to limit value below or above M. The model parameters were estimated with d fixed at 100% and with c and d fixed at 0 and 100%, respectively while fitting ED-10, LDS, ED50 and M reparameterizations. The value of ymax was computed from the mean value of M and other parameters by using the M reparameterization.
In order to compare the bilogistic model of Beckon et al. (2008) with Brain-Cousens and Cedergreen-Ritz-Streibig models, the hormesis data were also fitted with the two models in their original forms using TableCurve 2D as described earlier. Models were compared based on three goodness-of-fit statistics: Adjusted coefficient of determination (R2adj), root mean squared error (RMSE) and Akaike information criterion (AIC). The calculation of R2adj was implemented in TableCurve 2D V5.01. The RMSE was calculated as shown in Equation 16.
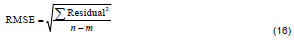
where residual is the difference between the observed and predicted responses, n is the number of observations and m is the number of model parameters.
The AIC values were generated by performing nonlinear regression in SAS 9.2 statistical software. In addition, the effective doses and the dose at maximum stimulation (M) for all the dose-response relationships were also calculated by fitting the data into the reparameterized Brain-Cousens (Equations 2 and 3) and Cedergreen-Ritz-Streibig (Equations 5 and 6 substituted into Equation 4) models. The values obtained from the three models were compared using Duncan post-hoc tests implemented with IBM SPSS Statistics 25.
RESULTS
Figure 3 shows the three data sets as observed responses as well as responses predicted from the original Brain-Cousens (Equation 1), Cedergreen-Ritz-Streibig (Equation 4) and bilogistic (Equation 7) models. All the three hormesis data sets were well fitted by each of the three models and detected significant hormetic effects of penicillin, 1-hexyl-3-methyl-imidazolium chloride and 4-CP on the growth of Staphylococcus sp., firefly luciferase activity and dehydrogenase activity in P. vermicola, respectively. The Brain-Cousens and Cedergreen-Ritz-Streibig models can be reduced to monotonic sigmoidal model if f equals zero. The values of f (p < 0.01) in both models for all the data sets did not include zero. In all the data sets, 95% confidence interval of the slopes and the p values (p < 0.01) showed that β1 and β2 did not include zero indicating significant hormetic effects of the respective substance (Table 2). The Brain- Cousens model could fit the data sets fairly well with the lowest adjusted R2 which were greater than 0.97(penicillin data), 0.95 ([HMIM]Cl data) and 0.98 (4-CP data). The bilogistic model of Beckon et al. (2008) had the lowest RMSE for all the data sets (Figure 4). With the exception of 4-CP data set, the bilogistic model had the lowest AIC values in all the data sets. Judging from the plots and residuals, the bilogistic model provided a better description of the three hormesis data especially at low doses. At high doses, described by the downward curve (x ≥ M), the responses predicted from the three model tend to overlap indicating insignificant differences between them (Figure 3). Generally, the order of goodness-of-fit of the bilogistic model for the hormesis data was, effects of ionic liquid on luciferase activity > effects of 4-chlorophenol on P. vermicola dehydrogenase activity > effects of penicillin on the growth of Staphylococcus sp.
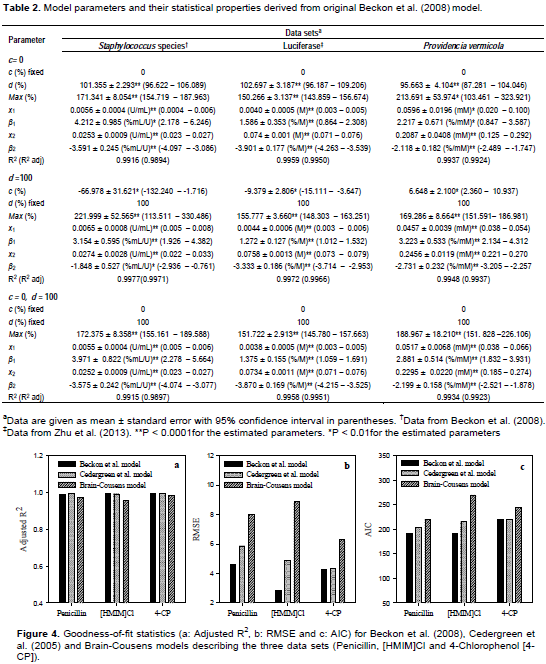
The parameters and their statistical properties as derived from the original model are shown in Table 2. Applying constraint on parameters c and d has bearing upon the estimated values of other parameters. In Staphylococcus sp. and luciferase data sets, the estimated value of Max increased when d was fixed at 100% and c allowed to be determined iteratively (Table 2). In addition, this reduced the values of β1, increased the value of β2 and increased the value of x1. Conversely, in the P. vermicola data, fixing d at 100% and allowing c to be determined iteratively reduced the value of Max, increased the value of β1, reduced the value of β2 and reduced the value of x1. Generally, allowing c to be determined resulted to a better goodness-of-fit in terms of the R2. However, unrealistic negative values of c were produced in Staphylococcus and luciferase data sets. In P. vermicola data set, positive value of c was determined. This is because the response did not tend to zero with increasing concentrations of 4-CP.
The model parameters and their statistical properties derived from the ED-10, LDS, ED50 and M reparameterizations are shown in Tables 3 to 5. Generally, allowing c to be determined improved the goodness-of-fit characteristics in all the data sets. The reparameterization of the bilogistic model did not affect the goodness-of-fit characteristics. The values of the adjusted R2 remained same with all reparameterizations for a particular hormesis data. In addition, reparameterization of the model for a particular effective dose did not affect estimation of other parameters (such as x1, x2, β1, β2and M). In each hormesis data, the values of each parameter either remained same or varied insignificantly (p > 0.05) in different model reparameterizations.
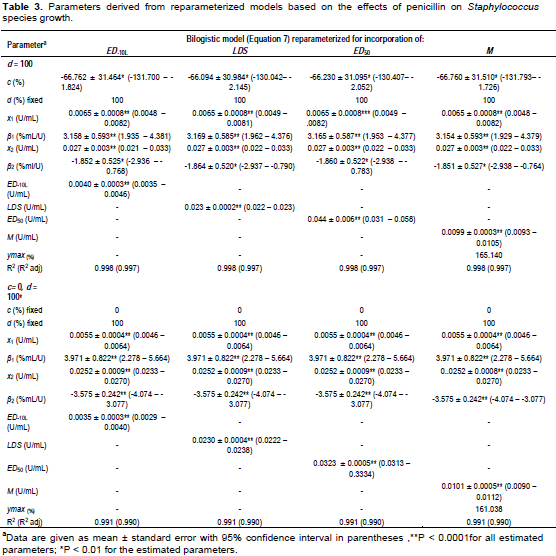
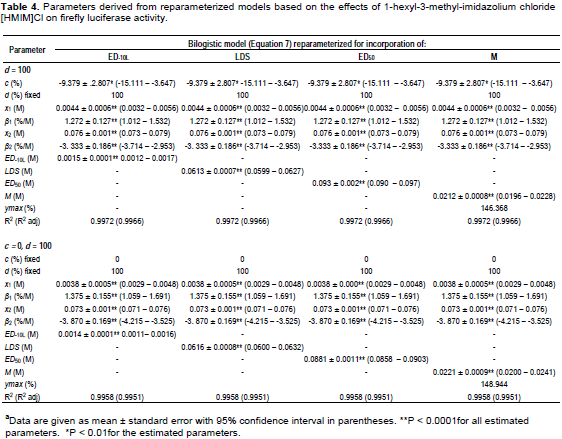
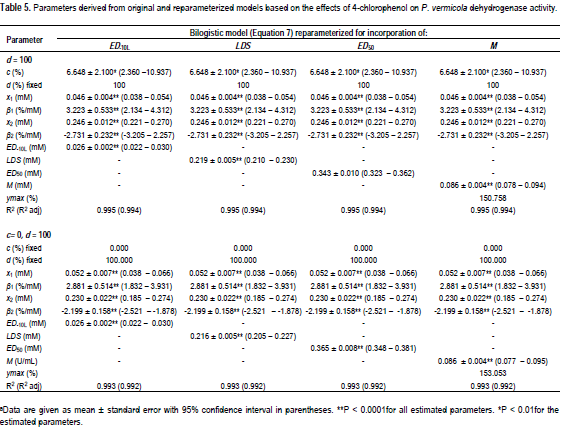
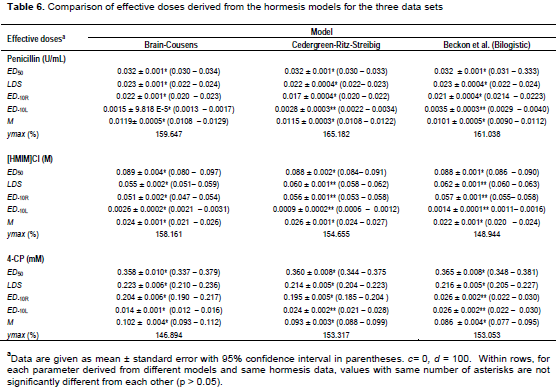
The goodness-of-fit statistics for the hormesis data fitted to the hormesis models in their original forms are as shown in Figure 4. The comparison of effective doses derived from the three hormesis models for the three data sets are shown in Table 6. The ED50 of penicillin, 1-hexyl-3-methyl-imidazolium chloride and 4-CP derived from the bilogistic model were 0.032 ± 0.001 U/ml, 0.088 ± 0.001 M and 0.365 ± 0.008 mM, respectively. The dose of maximum stimulation (M) obtained from the bilogistic model were 0.0101 ± 0.0005 U/ml, 0.0221 ± 0.0009 M and 0.086 ± 0.004 mM for penicillin, 1-hexyl-3-methyl-imidazolium chloride and 4-CP, respectively. There were no significant differences among the ED50 and M values derived from the three models for all the hormetic dose-response relationships. With the exception of the luciferase data, the LDS values of penicillin and 4-CP did not vary significantly among the three hormesis models. Generally, the ED-10L obtained from Brain-Cousens model differed significantly from the values obtained from the other models. The Brain-Cousens and Cedergreen-Ritz-Streibig models overestimated the ymax in the penicillin and 1-hexyl-3-methyl-imidazolium chloride data. In the 4-CP data, the Brain-Cousens model underestimated underestimated the ymax.
DISCUSSION
Modeling biphasic dose-response relationship is important for optimizing plant, animal and human nutrition and for accurate evaluation of the effectiveness and toxicity of pharmaceuticals and other chemicals that produce biphasic effects (Beckon et al., 2008). Accurate descriptions of hormetic dose-response relationship have bearing upon establishment of safe limits for hormetic substances including food additives, drugs and environmental pollutants. Mathematical models are important tool for understanding the biological bases of dose-response relationship leading to improvements in protection of plant, animal, human and environmental health. In this case, the bilogistic model proposed by Beckon et al. (2008) presented a formidable tool to characterize effects of substances that produce both stimulatory and inhibitory effects on living system. The bilogistic model was shown to be superior to Brain-Cousens and Cedergreen-Ritz-Streibig models in describing the three hormetic data sets presented in this study. According to the goodness-of-fit statistics (R2, RMSE and AIC), the bilogistic model of Beckon et al. (2008) provided a better description of the hormesis data. Generally, the graphical agreement between observed and fitted values in all the hormesis data was best with the bilogistic model. Although the Cedergreen- Ritz-Streibig model produced somehow similar results when compared with the bilogistic model, it overestimated the value of ymax in the Staphylococcus data set. The major difference observed in the fitting of the data to the models occurred mainly at low dose region. The ED-10L values for instance obtained from the Brain-Cousens model for all the hormesis data are significantly lower or higher than values obtained from the other models. The high dose region (x ≥ M) described by the downward curve seems to be unaffected. This could be attributed to the fact that in all the models, the switching function that determines the downward curve is same logistic function. The switching function describing the low doses is linear for Brain-Cousens model but logistic for the bilogistic model. Thus, the Beckon et al. (2008) model would be particularly suited for data with logistic dose-response relationship at low doses (0 ≤ x ≤ M) to be described by upward curve. A typical example is hormetic data having delayed stimulation at low doses. In addition, Beckon et al. (2008) model can represent dose-responses across a wide range of doses. In toxicological studies, a wide variety of dose-response patterns are generated which cannot all be described by any known single model. The bilogistic model is therefore an important candidate in the list of models for description of hormetic dose response relationships.
Given that hormesis is becoming more frequent in toxicological studies and that the bilogistic model describes certain hormetic dose-response relationship better than other models, it is necessary to describe a method for determination of effective doses using this model. The application of the bilogistic model when it offers better fit to a dose-response data will help to get rid of errors inherent in using other models that do not adequately describe a hormetic data or in ignoring response stimulation at sub-inhibitory doses. According to Schabenberger et al. (1999), ignoring hormesis and fitting data with monotonic function can lead to substantial bias in estimates of effective dosages. Although Zhu et al. (2013) suggested that mathematical manipulation is not suitable for a complex expression like the bilogistic model of Beckon et al. (2008), this study successfully extended the bilogistic model to enable estimation of any effective dose while accommodating hormesis. The extensions presented here allows determination of effective doses at both stimulatory and inhibitory dose ranges.
Fitting data to nonlinear model with many parameters such as the bilogistic model can potentially be challenging. There is no explicit expression for the parameters of this model and so the parameter values must be estimated by iterative process. The ability of nonlinear regression to achieve rapid convergence partly depends on good initial parameter estimates (Mcmeekin et al., 1999). Selecting good initial estimates of the model parameters is therefore a prerequisite to successful curve fitting of a nonlinear model with many parameters. The ease of this selection depends on the interpretability of the parameters. Practically-interpretable parameters often lead to better initial parameter estimate and consequently simplify the model fitting process (Mcmeekin et al., 1999). This is because the initial parameter value can easily be deduced from the x-y plot of the observed data. Some parameters of the bilogistic model (such as d, c, x1, x2, ED-10, ED50. LDS and M) are interpretable and can be easily deduced from x-y plot of the observed data. Other parameters cannot be easily deduced from the observed data. For instance, Max is a theoretical maximum response to be reached by rising curve in the absence of descending curve or vice versa.
The interpretation of Max is not in agreement with its fitted value. Other parameters that cannot easily be deduced are the slope parameters β1 and β2. However, the fact that β1 must have a positive value while β2 must have a negative value would be helpful. Selecting good initial estimates for such non interpretable parameter can be time consuming and require some kind of experience. However, the process of selecting good initial estimates to ensure convergence is simplified with TableCurve 2D.
By supplying the values of the interpretable parameters and making smart guess of the values of non-interpretable parameters to make the regression line somehow close to observed data, the initial estimates of all parameters can be updated automatically to optimal values in TableCurve 2D. In doing this, care must be taken to ensure that unrealistic values are not produced especially in cases (like ED-10) where two values are possible. In Table Curve 2D, and possibly other statistical softwares, application of constraint on ED-10 may not be critical. The initial parameter estimate for any particular ED-10 (ED-10L or ED-10R) could be optimized in TableCurve 2D by selecting value around the required ED-10. Since ED-10 is an interpretable parameter, this approach of using graphically-deduced initial estimates can simply be applied to estimate ED-10L or ED-10R without applying constraint.
Another practical challenge observed in fitting the bilogistic model is the poor estimation properties of the upper (d) and lower (c) asymptotes. When allowed to be estimated iteratively, unrealistic negative values of the lower asymptote were produced in the Staphylococcus sp. and luciferase data sets. In these data sets, there was no obvious saturation of effect at infinite doses. Similarly, estimation of upper asymptote (d) could result to values with wide standard error and 95% confidence limit. As pointed out by Schabenberger et al. (1999), it is important to consider whether estimation of lower (c) and upper (d) asymptotes is necessary. In our data, theoretical considerations suggested that the lower and upper asymptotes should be 0 and 100%, respectively. The statistical properties of other model parameters improved when c and d were fixed as 0 and 100%, respectively. The reparameterization of the bilogistic models is the substitution of Max with a function containing interpretable parameters. Generally, these extensions did not affect estimation of other parameters and goodness-of-fit especially when the value of c and d were fixed. However, minor variations which are not statistically significant may occur. Thus, the values of ED-10, LDS, ED50 and M were estimated with good statistical properties. In addition, the value of ymax was slightly affected when c and d were fixed.
The reparameterized models were successfully applied to estimate effective doses and their confidence intervals. Although reparameterization of models was discouraged by Cedergreen et al. (2005) and recommended the use of bisection and delta methods implemented in some statistical software, delta method could only allow the estimation of EDK doses with statistical properties and to extract M without statistical properties. In addition, the mathematical operation is not implementable in some statistical software. The reparameterized models can easily be coded into any curve fitting statistical software. Hence, the approach as recommended by Cedergreen et al. (2005) may not be easier than reparameterization for some users (Nweke and Ogbonna, 2017). Furthermore, the limitations of the delta method with respect to statistical properties of M underline the importance of reparameterization as an alternative approach for exploration of hormesis quantities in hormetic dose-response relationships. The competitiveness of this approach remains a pending question that is worth exploring (Belz and Piepho, 2012).
CONCLUSION
This study described a general approach to estimate the effective doses at hormetic and toxic dose ranges in inverted U-shaped dose-response relationships by reparameterization of a bilogistic model. The extended models were successfully applied to test for significance of hormesis and estimate effective doses and their confidence limits by non-linear curve fitting. Therefore, the suggested reparameterizations would result in accurate determination of the effective doses, their standard errors and confidence limits in dose (concentration)-response relationships that could be best described by the bilogistic model. The use of the bilogistic model where it is most suitable will help to remove errors that may arise from the use of other hormesis models that do not adequately represent the data. In addition, the models will be applicable in the study of variability of inverted U-shaped dose-response relationships in many disciplines. These models could potentially help to refine regulatory guidelines for protection of human, animal, plant and microbial populations which would have bearing upon the management of environmental health.
CONFLICT OF INTERESTS
The authors have not declared any conflict of interests.
REFERENCES
|
Beckon WN, Parkins C, Maximovich A, Beckon AV (2008). A general approach to modeling biphasic relationships. Environmental Science & Technology 42(4):1308-1314. |
|
|
Belz RG, Cedergreen N, Duke SO (2011). Hericide hormesis - can it be useful in crop production? Weed Research 51(4):321-332. |
|
|
Belz RG, Cedergreen N (2010). Parthenin hormesis in plants depends on growth conditions. Environmental and Experimental Botany 69(3):293-301. |
|
|
Belz RG, Leberle C (2012). Low dose responses of different glyphosate formulations on plants. Proceedings of 25th German Conference on Weed Biology and Weed Control, March 13-15, Braunschweig, Germany. |
|
|
Belz RG, Piepho HP (2012). Modeling effective dosages in hormetic dose-response studies. Plos One 7(3):1-10. |
|
|
Belz RG, Piepho HP (2015). Statistical modeling of the hormetic dose zone and the toxic potency completes the quantitative description of hormetic dose responses. Environmental Toxicology and Chemistry 34(5):1169-1177. |
|
|
Brain P, Cousens R (1989). An equation to describe dose responses where there is stimulation of growth at low doses. Weed Research 29(2):93-96. |
|
|
Cedergreen N, Felby C, Porter JR, Streibig JC (2009). Chemical stress can increase crop yield. Field Crops Research 114(1):54-57. |
|
|
Cedergreen N, Olesen F (2010). Can glyphosate stimulate photosynthesis? Pesticide Biochemistry and Physiology 96(3):140-148. |
|
|
Cedergreen N, Ritz C, Streibig JC (2005). Improved empirical model describing hormesis. Environmental Toxicology and Chemistry 24(12): 3166-3172. |
|
|
Cedergreen N, Streibig JC, Kudsk P, Stephen O, Duke SO, Mathiassen SK (2007). The occurrence of hormesis in plants and algae. Dose-Response 5(2):150-162. |
|
|
Li Y, Zhang B, He X, Cheng W-H, Xu W, Luo Y, Liang R, Lao H, Huang K (2014). Analysis of individual and combined effects of Ochratoxin A and zearalenone on HepG2 and KK-1 cells with mathematical models. Toxins 6(4):1177-1192. |
|
|
Migliore L, Godeas F, De Filippis SP, Mantovi, P, Bonazzi G, Barchi D, Testa C, Rubattu N, Rambilla G (2010). Hormetic effect(s) of tetracyclines as environmental contaminant on Zea mays. Environmental Pollution 158(1):129-134. |
|
|
Mulkiewicz E, Jastorfi B, Skladanowski AC, Kleszczy?ski K, Stepnowski P (2007). Evaluation of the acute toxicity of perfluorinated carboxylic acids using eukaryotic cell lines, bacteria and enzymatic assays. Environmental Toxicology and Pharmacology 23(3):279-285. |
|
|
Murado MA, Vázquez JA (2010). Basic toxicodynamic features of some antimicrobial agents on microbial growth: a dynamic mathematical model and its implications on hormesis. BMC Microbiology 10(1):1-14 |
|
|
Mcmeekin TA, Olley JN, Ross T, Ratkowskey DA (1999). Predictive Microbiology, Theory and Applications. John Wiley. New York p. 68. |
|
|
Nweke CO, Ahumibe NC, Orji JC (2014). Toxicity of binary mixtures of formulated glyphosate and phenols to Rhizobium species dehydrogenase activity. Journal of Microbiology Research 4(4):161-169. |
|
|
Nweke CO, Ike CC, Ibegbulem CO (2016). Toxicity of quaternary mixtures of phenolic compounds and formulated glyphosate to microbial community of river water. Ecotoxicology and Environmental Contamination 11(1):63-71. |
|
|
Nweke CO, Orji JC, Ahumibe NC (2015). Prediction of phenolic compound and formulated glyphosate toxicity in binary mixtures using Rhizobium species dehydrogenase activity. Advances in Life Sciences 5(2):27-38. |
|
|
Nweke CO, Ogbonna CJ (2017). Statistical models for biphasic dose-response relationship (hormesis) in toxicological studies. Ecotoxicology and Environmental Contamination 12(1):39-55. |
|
|
Shen K, Shen C, Lu Y, Tang X, Zhang C, Chen X, Shi J, Lin Q, Chen Y (2009). Hormesis response of marine and freshwater luminescent bacteria to metal exposure. Biological Research 42(2):183-187. |
|
|
Schabenberger O, Tharp BE, Kells JJ, Penner D (1999). Statistical test for hormesis and effective dosages in herbicide dose-response. Agronomy Journal 91(4):713-721. |
|
|
Van Ewijk PH, Hoekstra JA (1993). Calculation of the EC50 and its confidence interval when subtoxic stimulus is present. Ecotoxicology and Environmental Safety 25(1):25-32. |
|
|
Wang LJ, Liu SS, Yuan J, Liu HL (2011). Remarkable hormesis induced by 1-ethyl-3-methyl imidazolium tetrafluoroborate on Vibrio qinghaiensis sp.-Q67. Chemosphere 84(10):1440-1445. |
|
|
Wang HW, Wang JQ, Zheng BQ, Li SL, Zhang SL, Li FD, Zheng N (2014). Cytotoxicity induced by ochratoxin A, zearalenone, and a-zearalenol: Effects of individual and combined treatment. Food and Chemical Toxicology 71:217-224. |
|
|
Zelaya IA, Owen MDK (2005). Differential response of Amaranthus tuberculatus (Moq ex DC) JD Sauer to glyphosate. Pest Management Science 61(10):936-950. |
|
|
Zhu XW, Liu SS, Qin LT, Chen F, Liu HL (2013). Modeling non-monotonic dose response relationships: Model evaluation and hormetic quantities exploration. Ecotoxicology and Environmental Safety 89:130-136. |
|
|
Zou X, Lin Z, Deng Z, Yin D (2013). Novel approach to predicting hormetic effects of antibiotic mixtures on Vibrio fischeri. Chemosphere 90(7):2070-2076. |
|
Copyright © 2024 Author(s) retain the copyright of this article.
This article is published under the terms of the Creative Commons Attribution License 4.0


