Full Length Research Paper

ABSTRACT
The genetic and morphological diversity of soybean germplasms was studied using random amplified polymorphic DNA (RAPD) markers and morphological traits such as plant height, height of cotyledon leaves, basal leaf length, basal leaf width, basal leaf area, terminal leaflets number, terminal leaflet length, terminal leaflet width, terminal leaflet area and basal leaf petiole length. A total of 30 germplasms were investigated. The number of amplification products obtained ranged between 6 and 9. An average of five bands was obtained per primer set. The RAPD analysis of the 30 soybean germplasms revealed a total of 23 bands, amplified by 14 different oligonucleotide primers. Sixteen of these bands were highly polymorphic with percentage polymorphism at 70%, indicating the germplasms investigated had a high level of genetic diversity. The consensus tree generated from the genetic diversity analysis placed the soybean germplasms into five groups at an agglomerate coefficient of 0.6 (similarity level). Similarly, cluster analysis from the morphological characterisation revealed 5 clades with an average distance between clusters of 0.75. There was a significant lack of correlation between the RAPD markers and the morphological traits evaluated. Although, both analyses grouped the soybean genotypes into 5 clades, the composition of the individual clusters were very variable and divergent with the correlation between the largest clusters in the molecular and morphological characterisation at only 35-42%.
Key words: Soybean, germplasm, random amplified polymorphic DNA (RAPD), genetic diversity, morphological variability, polymorphism.
INTRODUCTION
Soybean (Glycine max) is a leguminous plant. It originated from Asia and presently, China and United States of America are the world’s largest producers (FAO, 2011). In Nigeria, soybean cultivation started since 1928 and presently, Benue, Niger and some parts of Kaduna States are the major producing areas in the country. As a single seasonal crop, it is grown in middle of June and harvested at the beginning of dry season (October – November) to avoid field losses (International Institute for Tropical Agriculture- IITA, 2009).
The advent of molecular biology has revolutionized the field of plant systematics and has been used successfully in establishing phylogenetic relationships at all taxonomic levels (Bohs, 2005). It has also been used in DNA fingerprinting of plant genomes (Cervera et al., 1998) and in genetic diversity studies (Isshiki et al., 2008). The use of molecular techniques in genetic diversity studies is supported by the finding that evolutionary forces such as natural selection and genetic drift produce divergent phylogenetic branching which can be recognized because the molecular sequences on which they are based, share a common ancestor (Singh et al., 2010). A number of genetic maps have been developed for soybean with several types of molecular markers. Hwang et al. (2009) mapped 1810 simple sequence repeats (SSR) site markers in some recombinant inbred populations of soybean, from which they constructed high-density linkage maps.
Random amplified polymorphic DNA (RAPD), when compared with other molecular markers, is more effective in this regard as it is simple, rapid, requires only a small quantity of DNA and it is well adapted for nonradioactive DNA fingerprinting of genotypes (Cao et al., 1999). It is also able to generate numerous polymorphisms (Williams et al., 1990). More recent studies have used molecular markers to identify genetically diverse plant introductions to be used for crosses in cultivar improvement programs (Thompson and Nelson, 1998a, b; Thompson et al., 1998; Narvel et al., 2000). These studies have had more success than conventional selection programs in producing productive lines from plant introductions crossed with elite genotypes. Khare et al. (2013) used RAPD to investigate the genetic diversity and relatedness of 38 soybean germplasms; they found 259 RAPD marker loci with 253 of them polymorphic. Perić et al. (2014) compared three methods in the assessment of diversity in soybean, and RAPD was found to be more superior in assessing differences among genetically similar genotypes. Alamri (2014) also studied inter simple sequence repeat (ISSR) and RAPD markers in detecting genetic variation in soybean. The results revealed that the levels of polymorphic loci detected with the two marker systems were in general moderate and similar. Very recently, Pakyürek and Akçin (2015) also used RAPD markers to study genetic diversity in seven different soybean cultivars, the results revealing significant polymorphisms. In Nigeria, not much has been done on the nature of genetic diversity and characterization of Glycine max, especially using molecular tools. There is a need for extensive evaluation of new germplasms found in Nigeria to determine their genetic diversity.
This research work aimed to assess the morphological variability and molecular diversity of soybean (Glycine max.) using RAPD markers.
MATERIALS AND METHODS
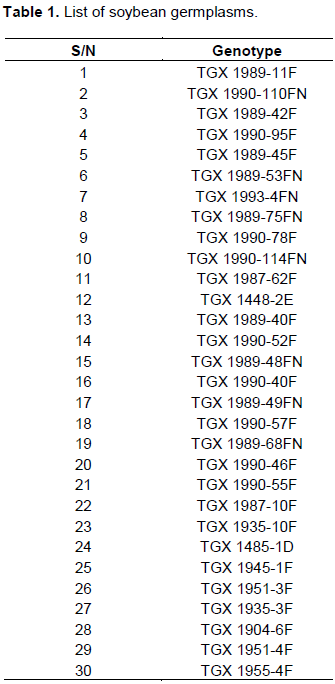
Thirty soybean germplasms (representing several independent breeding sources from IITA) used in this study were obtained from Molecular Biology Laboratory, University of Agriculture, Makurdi, Benue State, Nigeria. The soybean germplasms are shown in the Table 1.
Planting of soybean germplasms
Three seeds of each germplasm were planted in plastic pots and thinned to two stands per pot at seven days after planting.
Collection of DNA sample on Fast Technology Application (FTA) Plant card (Whatman, 2014)
Young leaves of soybean at 14 days after planting were excised from the plants. Depending on the size of the leaves, either whole leaves or portions of the leaves were mechanically crushed and disrupted on FTA plantsaver cards using porcelain pestle. The crushed leaves on FTA plantsaver cards were air-dried at room temperature for 1 h. Afterwards, 2 mm circles of FTA plantsaver cards containing leaf tissue were collected using a Harris Micro-Punch (Life Technologies) and was transferred into a thin-wall micro centrifuge tubes.
Preparation of plant genomic DNA
200 μl of FTA purification reagent was added to each of the micro centrifuge tubes from above. The micro centrifuge tubes were vortex and mixed for 1–2 s at low speed. The tubes were incubated at room temperature for 5 min, and the wash solution was discarded. The washes were repeated with FTA reagents 2 more times, followed by 2 more washes with 1TE buffer (10 mmol/L Tris, 0.1 mmol/L ethylene diamine tetracetic acid (EDTA), pH 8.0). The FTA paper cards were air-dried at room temperature for 1 h, and the paper punches placed directly into
Polymerase chain reaction (PCR) protocol
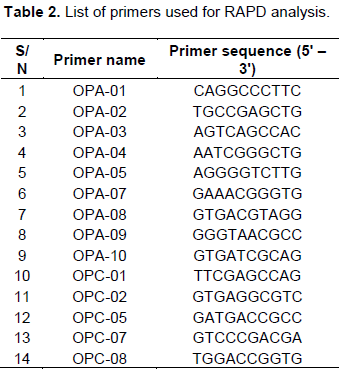
Aliquots of DNA samples from each genotype were amplified with each of the 14 oligonucleotide primers (Inqaba Inc. South Africa) listed in Table 2 using a thermal cycler. The PCR were carried out in 25 μl volumes containing 6.5 μl of 10 × Taq buffer, 4 μl of 2 mM dNTP mix, 1 μl primer, 1 μl of Taq polymerase, 1 μl MgCl2, 10.5 μl Nuclease-free water and 1 μl template DNA. The PCR method has an initial denaturation step at 94°C for 5 min, followed by 44 cycles of 94°C for 1 min, 35°C for 1 min, and 72°C for 2 min. A final extension step was given at 72°C for 7 min (Mundewadikar and Deshmukh, 2014). The reaction was repeated two times for each selected primer.
Gel electrophoresis
The PCR products were electrophoresed on 2% agarose gel in a horizontal gel electrophoresis tank. 10 μl of DNA ladder and 16 μl of PCR product were loaded on the gel and resolved for about 40 min. The gel was stained with ethidium bromide and visualized on a Benchtop UV transilluminator and photographed with digital camera for scoring.
Scoring and data analysis
The data for RAPD analysis were scored from digital photographs of ethidium bromide-stained agarose gels using the Ultraviolet Bench Top illuminator. DNA bands were considered to be similar if they occurred exactly at the corresponding position on the gel. Band size was determined by comparing with a standard DNA ladder run alongside the soybean genotypes. An RAPD band profile, presence (1) or absence (0) was recorded into a binary matrix. This matrix was subjected to genetic similarity analysis using root mean square distance (RMSD) coefficient, and clustering was done using a dendrogram constructed by an Unweighted Paired group Method using Arithmetic Averages (UPGMA) (Garcia et al., 1999).
Morphological characterisation
The morphological traits analyses were carried out at three weeks of planting. Parameters measured in centimetres included: Plant height, height of cotyledon leaves, basal leaf length, basal leaf width, basal leaf area, terminal leaflets number, terminal leaflet length, terminal leaflet width, terminal leaflet area and basal leaf petiole length. Plant height was measured from ground level to stem tip for three plants and mean plant height was recorded. Cotyledon height was measured from ground level to cotyledon tip, for three plants and mean cotyledon height was recorded. Basal leaf length was measured from lamina tip to the point of intersection of the lamina and stem and basal leaf width was measured from tip to tip between the widest lamina. The leaf area (basal and terminal) of each leaf was calculated using the method described by Pandy and Singh (2011). Data generated was subjected to hierarchical clustering using UPGMA, and a dendrogram was generated for the 10 traits studied using SAS 9.3.
RESULTS
The RAPD analysis of the 30 samples revealed a total of23 bands (Table 3). Sixteen of these bands were highly polymorphic with percentage polymorphism at 70%. The amplified band sizes varied between 100 and 1100 bp. The numbers of amplification products obtained were in the range 6 to 9. Multiplex of OPA-01, OPA-02, OPA-03 and OPA-04 primers produced the minimum number of polymorphic bands (6), OPA-05, OPA-07, OPA-08 and OPA-09 primers produced the highest number of polymorphic bands (9) and multiplex of OPA-10, OPC-01, OPC-02, OPC-05 and OPC-07 primers produced 8 polymorphic bands representing 100% polymorphism. An average of 5 bands was also obtained per primer set. Figures 1 to 3 show the band profiles of RAPD markers for the thirty soybean germplasms studied. The band fragments of multiplex OPA-01, OPA-02, OPA-03 and OPA-04 primers ranged from 120 to 500 bp.
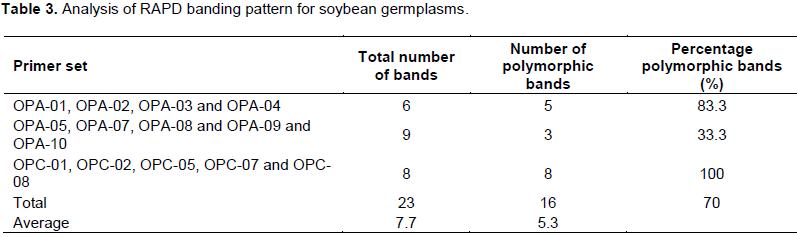
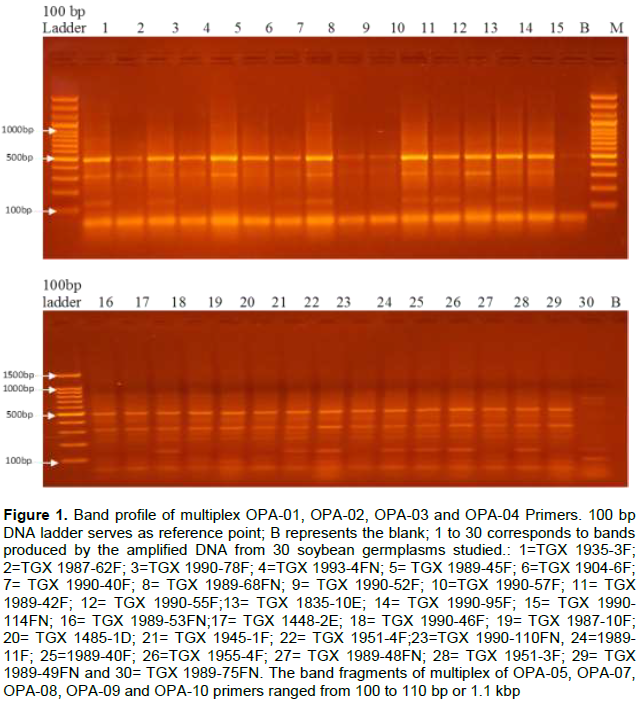
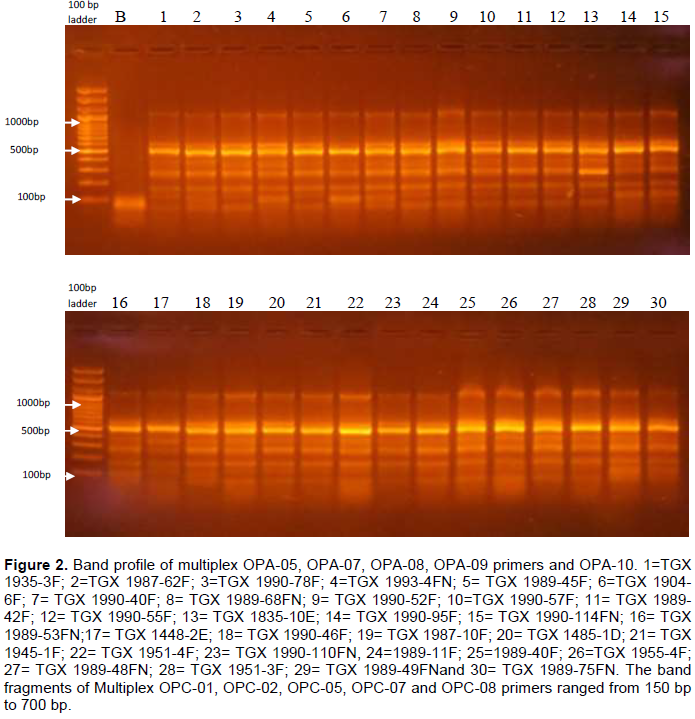
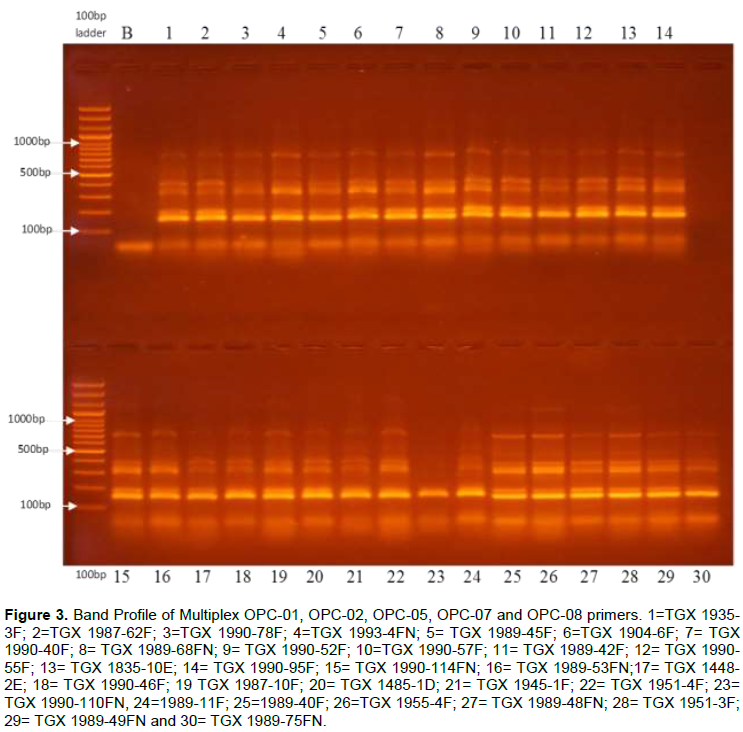
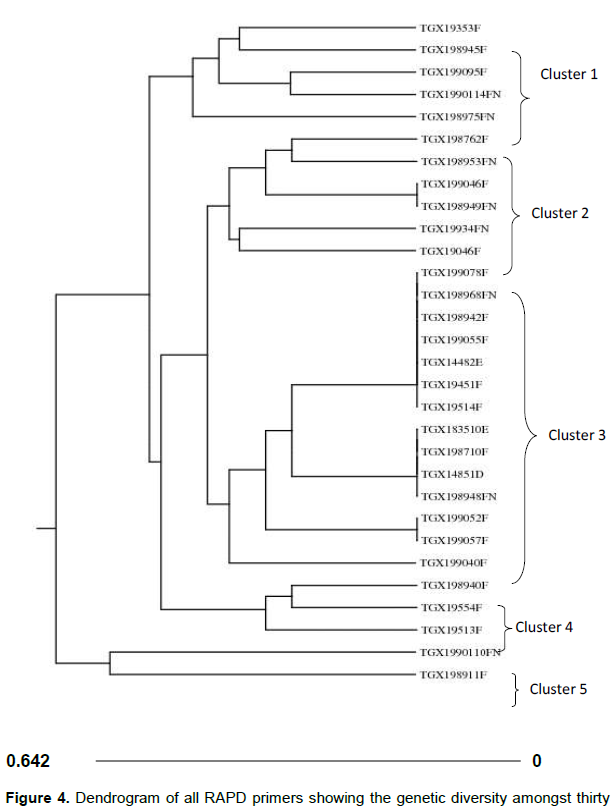
Figure 4 represents the distance matrix tree from the RAPD markers showing the degree of genetic diversity and/or relatedness of the 30 soybean germplasms. The consensus tree generated placed the soybean germplasms into 5 groups at an agglomerate coefficient of 0.6 (similarity level). Cluster 1 revealed the genetic relatedness of 5 germplasms namely, TGX 1935-3F, TGX 1989-45F, TGX 1990-95F, TGX 1990-114FN and TGX 1989-75FN. Cluster 2 comprised of six germplasms namely, TGX 1987-62F, TGX 1989-53FN, TGX 1990-46F, TGX 1989-49FN, TGX 1993-4FN and TGX 1904-6F. Cluster 3 being the cluster with the largest germplasms comprised of 18 closely related germplasms namely, TGX 1990-78F, TGX 1989-42F, TGX 1989-68FN, TGX 1990-55F, TGX 1448-2E, TGX 1945-1F, TGX 1951-4F, TGX 1935-10E, TGX 1987-10F, TGX 1485-1D, TGX 1989-48FN, TGX 1990-52F, TGX 1990-57F and TGX 1990-40F. Cluster 4 comprised of 3 germplasms namely, TGX 1989-40F, TGX 1955-4F and TGX 1951-3F. Lastly, cluster 5 consisted of 2 germplasms (TGX 1989-11F and TGX 1990-110FN) which are outliers that are genetically different from all other germplasms.
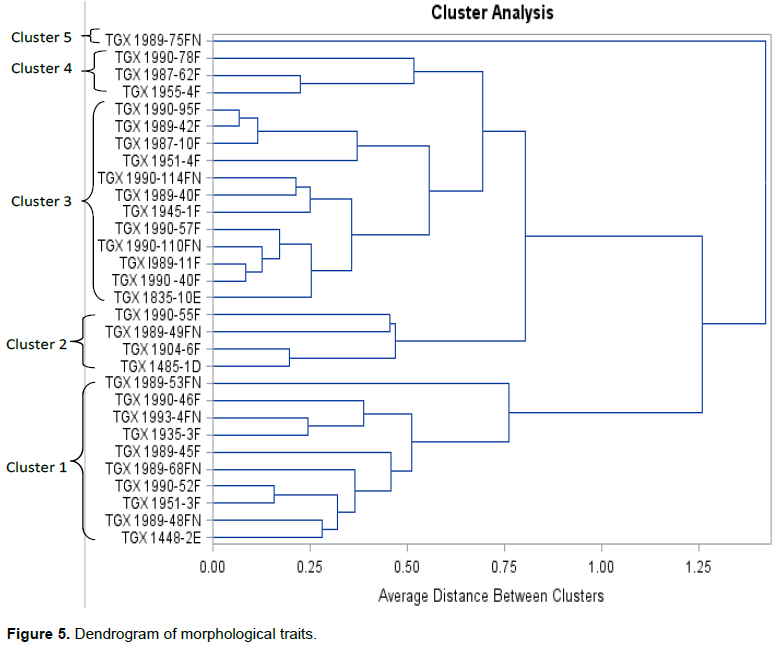
Similarly, cluster analysis from the morphological characterisation of the soybean germplasms (Figure 5) revealed 5 clades with an average distance between clusters of 0.75. Cluster 1 comprised ten germplasms namely, TGX 1448-2E, TGX 1989-48FN, TGX 1951-3F, TGX1989-68FN, TGX 1990-52F, TGX 1989-45F, TGX 1935-3F, TGX 1993-4FN, TGX 1990-46F and TGX 1989-53FN. Four germplasms namely, TGX 1485-1D, TGX 1990-46F, TGX 1989-49FN and TGX 1990-55F were grouped into cluster 2. Cluster 3 consists of twelve germplasms that are morphologically related namely, TGX 1835-10E, TGX 1990 -40F, TGX 1989-11F, TGX 1990-110FN, TGX 1990-57F, TGX 1945-1F,TGX 1989-40F, TGX 1990-114FN, TGX 1951-4F, TGX 1987-10F, TGX 1989-42F and TGX 1990-95F. Cluster 4 has three germplasms namely, TGX 1987-62F, TGX 1955-4F and TGX 1990-78F. Also, the dendrogram shows that cluster 5 consists of an outlier (TGX 1989- 75F) that is morphologically different from all other germplasms.
DISCUSSION
The high degree of polymorphism revealed by the RAPD markers was further accentuated by the observation fromthe cluster analysis. The molecular characterization of the 30 soybean germplasms with RAPD markers revealed 70% polymorphism, indicating a high level of genetic diversity in the soybean germplasms investigated. This result also shows that the RAPD markers were highly polymorphic and informative. The result is in agreement with the report of Chowdhury et al. (2001) that RAPD markers are efficient for measuring genetic diversity and relatedness as well as identifying varieties of soybeans. This is the first report of genetic diversity analysis of advanced soybean genotypes (breeding lines) in Nigeria using RAPD markers. This result is in concordance with the previous reports of Singh et al. (2008) who reported 89.9% polymorphism, while Li and Nelson (2005) reported 56% polymorphism in their studies using RAPD primers. However, Thompson et al. (1998) observed a low level (36%) of DNA variation among 35 soybean genotypes using RAPD primers. Conflicting reports on the extent of observed polymorphism in soybean in different studies could be attributed to the unique nature of the genetic materials under investigation and sequences of the primers.
There was a significant lack of correlation between the RAPD markers and the morphological traits evaluated. Although, both analyses grouped the soybean genotypes into 5 clades, the composition of the individual clusters were very variable and divergent. For example, cluster 3 was the largest cluster in both cases with 12 and 14 members for genetic and morphological relatedness respectively but, the correlation was only 35-42% (TGX 1989-42F, TGX 1987-10F, TGX 1951-4F, TGX 1945-1F and TGX 1990-57F). Furthermore, whereas TGX 1990-110FN and TGX 1989-11F were outliers and genetically distinct and distant from the other germplasms in the RAPD dendrogram, they were shown to be morphologically related to at least 10 other germplasms in cluster 3. Also, TGX 1989-75FN was morphologically different to all the other germplasms and hence an outlier in the dendrogram. In the genetic characterisation however, it was shown to be genetically related to 4 other germplasms in cluster 1. This lack of correlation between genetic and morphological diversity have been previously reported in other plant species (Doebley, 1989). It could well be as Zannou et al. (2008) surmised that during the process of domestication, modifications in a few genes can lead to marked phenotypic differences.
In terms of morphological characterisation, this study agrees with several earlier studies on soybean using morphological markers (Malek et al., 2014; Ojo et al., 2012; Iqbal et al., 2008; Cui et al., 2001) such as branch number, plant height, pod number and seed weight, seed shape, seed eye colour, yield, etc. which have all provided useful information for proper classification of soybean germplasms.
CONCLUSION
Summarily, this study reveals the presence of significant genetic variability in the 30 soybean genotypes investigated. Genetic diversity and/or relationship assessments could provide useful information for efficient utilization of these germplasms, especially during future improvement programmes. This result also showed that the RAPD markers were highly polymorphic and informative, clearly grouping the genotypes into distinct clusters. Although, the correlation between the largest clusters in the molecular and morphological characterisation was only 35-42%, enlarging the sample size in subsequent investigations could provide a clearer picture and perhaps better information between the two. Nevertheless, advanced breeding lines of soybean which have undergone cycles of artificial selection, should not be neglected when further improvement of soybean is considered.
CONFLICT OF INTERESTS
The authors declare that there is no conflict of interests regarding the publication of the paper.
REFERENCES
|
Alamri S (2014). Comparative analysis of soybean (Glycine max) accessions using inter simple sequence repeat (ISSR) and randomly amplified polymorphic DNA (RAPD) markers. MSc. Thesis. The School of Graduate Studies, Laurentian University, Sudbury, Ontario, Canada. |
|
|
Bohs L (2005). Revision of Solanium section. Syst. Bot. Monog. 61:1141-1155. |
|
|
Cao W, Scoles G, Hucl P, Chibbar RN (1999). The use of RAPD analysis to classify Tritcum accessions. Theor. Appl. Genet. 98:602-607. |
|
|
Cervera MT, Cabezas JA, Sancha JC, Martinez de Toda F, Martinez-Zapater JM (1998). Application of AFLPs to the Characterization of grapevine genetic resources. A case study with Accession from Rioja (Spain). Theor. Appl. Genet. 97:51-59. |
|
|
Chowdhury AK, Srinives P, Tongpamnak P, Saksoon P (2001). Genetic diversity based on morphology and RAPD analysis in vegetable soybean. Kor. J. Crop Sci. 46(2):112-120. |
|
|
Cui Z, Carter Jr. TE, Burton JW, Wells R (2001). Phenotypic diversity of modern Chinese and North American soybean cultivars. Crop. Sci. 41(6):1954-1967. |
|
|
Doebley J (1989). Isozyme evidence and evolution of crop plants. In: Isozymes in Plant Biology. Soltis DE, Soltis PS (Eds.). Dioscorides Press, Portland, OR. pp. 165-191. |
|
|
Food and Agriculture Organization of the United Nations (FAO) Production Yearbooks (1988 to 2011). |
|
|
Food and Agriculture Organisation of the United Nations. FAO Statistics Division, FAOSTAT database (2011). |
|
|
Hwang TY, Sayama T, Takahashi M, Takada Y, Nakamoto Y, Funatsuki H, Hisano H, Sasamoto S, Sato S, Tabata S, Kono I, Hoshi M, Hanawa M, Yano C, Xia Z, Harada K, Kitamura K, Ishimoto M (2009). High-density Integrated Linkage Map Based on SSR Markers in Soybean. DNA Res. 16:213-225. |
|
|
International Institute of Tropical Agriculture (IITA) (2009). Genetic Resources for Tropical Agriculture, Pamphlet, P 32. |
|
|
International Institute of Tropical Agriculture–IITA (2009): Soybean crop. |
|
|
Isshiki S, Iwataa N, Khana MMR (2008). ISSR variations in Solanium melongena L. and related species. Sci. Hort. 117:186-190. |
|
|
Iqbal Z, Arshad M, Ashraf M, Mahmood T, Waheed A (2008). Evaluation of soybean [Glycine max (L.) Merrill] germplasms for some important morphological traits using multivariate analysis. Pak. J. Bot. 40(6):2323-2328. |
|
|
Khare D, Bisen A, Nair P, Tripathi N (2013). Genetic diversity in soybean germplasms identified by RAPD markers. AsPac J. Mol. Biol. Biotechnol. 21(3):121-123. |
|
|
Lin JJ, Fleming R, Kuo J, Mathews BF, Saunders JA (2000). Detection of plant genes using a rapid, nonorganic DNA purification method. Biotech. 28: 346-350. |
|
|
Malek MA, Rafii MY, Afroz MSS, Nath UK, Mondal MMA (2014). Morphological characterization and assessment of genetic variability, character association, and divergence in soybean mutants. Sci. W. J. 12 p. |
|
|
Mundewadikar DM, Deshmukh PR (2014). Genetic variability and diversity studies in soybean [Glycine max (L.) Merrill] using RAPD Marker. Int. J. Sci. Res. Pub. 4(9):1-4. |
|
|
Ojo DK, Ajayi AO, Oduwaye OA (2012). Genetic relationships among soybean accessions based on morphological and RAPDs techniques. Pert. J. Trop. Agric. Sci. 35(2):237-248. |
|
|
Omoigui LO, Ishiyaku MF, Ousmane B, Gowda BS, Timko MP (2011). Application of Fast Technology for analysis (FTA) for sampling and recovery of Deoxyribonucleic acid (DNA) for molecular characterization of cowpea breeding lines for Striga resistance. Afr. J. Biotechnol. 10(85):19681-19986. |
|
|
Pakyürek M, Akçin A (2015). Determination of Genetic Polymorphism among Soybean (Glycine max. L. Merrill) Cultivars Developed in Recent Years through RAPD Markers. Int. J. Sec. Metabol. 2(1):3-7. |
|
|
Perić V, Nikolić A, Babić V, Sudarić A, Srebrić M, Dordević V, Drinić SM (2014). Genetic relatedness of soybean genotypes based on agromorphological traits and RAPD markers. Genetika 46(3):839- 854. |
|
|
Singh RJ, Nelson RL, Chung G (2006). Genetic Resources, Chromosome Engineering, and Crop Improvement: Oilseed Crops, Vol. 4. London: Taylor & Francis. P 15. |
|
|
Singh RK, Bhatia VS, Yadav S, Athale R, Lakshmi N, Guruprasad KN, Chauhan GS (2008). Identification of genetically diverse genotypes for photoperiod insensitivity in soybean using RAPD Markers. Physiol. Mol. Biol. Plants. 14(4):369-375. |
|
|
Singh RK, Mishra SK, Singh SP, Mishra N, Sharma ML (2010). Evaluation of microsatellite markers for genetic diversity analysis among sugarcane species and commercial hybrids. Aust. J. Crop Sci. 4:116-125. |
|
|
Thompson JA, Nelson RL (1998). Utilization of diverse germplasms for soybean yield improvement. Crop Sci. 38:1362-1368. |
|
|
Thompson TA, Nelson RL, Vodkin LO (1998). Identification of diverse Soybean germplasm using RAPD markers. Crop Sci. 38(5):1348-1355. |
|
|
Whatman (2014). Protocol on Plant DNA extraction using FTA Plantsaver method. |
|
|
Williams JGK, Kubelik AR, Refalski JA Tingey SV (1990). DNA Polymorphisms amplified by arbitrary primers are useful as genetic markers. Nucl. Acids Res. 18:6531-6535. |
|
|
Zannou A, Kossou D K, Ahanchede A, Zoundjihekpon J, Agbicodo E, Struik PC, Sanni A (2008). Genetic variability of cultivated cowpea in Benin assessed by random amplified polymorphic DNA. Afr. J. Biotechnol. 7(24):4407-4417. |
|
Copyright © 2024 Author(s) retain the copyright of this article.
This article is published under the terms of the Creative Commons Attribution License 4.0


