Sesame (Sesamum indicum L.) of the family Pedaliaceae is an important and old oil crop that is cultivated mainly in the tropical and subtropical regions of Asia and Africa for several economic values. Several molecular markers have been employed to study the genetic diversity of this important crop. The study focused on the genetic diversity through polymorphism information content (PIC) by the use of Simple Sequence Repeat markers among randomly collected 22 Sesame germplasm across 2 ecological zones stored in NACGRAB seed Genebank, Nigeria. The extraction procedure followed Cetyltrimethylammonium Bromide (CTAB) and the recovered DNA were good with average concentration of 337.00 ng/µL and average quality of 1.795. 30 primers were designed but only 12 with highest genome coverage were used to analyzed the genetic data with NTSYS pc ver.2.02 and Power Marker ver.3.5. The PIC ranged between 0.36 in Primer OTO2 and 0.76 in Primer OTO5. The evolutionary relationship was constructed based on the polymorphic primers and according to their ecological locations. The populations were divided to 2 major clads. Of the 2 ecological zones, the more diverse ecological zone is the derived Savana with 13 accessions, while the less diverse is the humid forest with 9 accessions.
Sesame (Sesamum indicum L., 2n = 26), belonging to the Pedaliaceae family with 60 species organized into 16 genera (Singh et al., 2015) is one of the oldest cultivated plant, considered important for its edible oil (Anilakumar et al., 2010). Myanmar takes the lead position in sesame production closely followed by India and China (Koppelman et al., 2015). Sesame is very important to human being in so many ways, especially in dietary preparation and besides direct consumption, sesame seeds are also used as an active ingredient in cosmetic industry (Dossa et al., 2016), decorative elements, antiseptics, bactericides, viricides (Bedigian, 2010), disinfectants, moth repellants
(Bedigian 2011) and antitubercular agents because they contain natural antioxidants such as sesamin, sesamoland sesamolin (Badril et al., 2014; Elleuch et al., 2007).
The presence of genetic diversity is a desirable requirement for any breeding program (Dossaet al., 2017a). Nigeria, being one of the most important Sesame producing countries aims to make systematic efforts to characterize and document the genetic variability of Sesame in the country. The insight of genetic variation between and within populations gives pivotal information which is indispensable for the formulation of management strategy channeled towards crop improvement program and conservation of biodiversity (Pandeyet al.,2015). Morphological and agronomic characteristics as well as isozyme and molecular marker analysis have been used to determine genetic diversity in crop species (Alemuet al.,2013). The use of morphological and agronomic characteristics is prone to strong influence of environmental interference. Molecular markers offer a reliable means of identification and to understand the genetic variability in crops as it overcomes the limitation of environmental influence (Wu et al., 2014) and sesame research has witnessed a rapid development of genetic tools particularly molecular markers and their application in genetic diversity studies and marker assisted breeding (Dossa et al., 2017b; Uncu et al., 2017).
Different molecular marker systems have been developed, with its merit and demerits in terms of ease of use and degree of information to study genetic diversity. The universal markers include the randomly amplified polymorphic DNA (RAPD), restriction fragment length polymorphism (RFLP), amplified fragment length polymorphism (AFLP), sequence-related amplified polymorphism (SRAP), inter-simple sequence repeats (ISSR), specie-specific marker such as simple sequence repeats (SSR), diversity arrays technology (DArT), restriction-site associated DNA sequencing (RADseq), single-nucleotide polymorphism (SNP), specific-locus amplified fragment sequencing (SLAFseq), random selective amplification of microsatellite polymorphic loci (RSAMPL) (Dossa et al., 2017a) and expressed sequence tags-SSR (EST-SSR). The choice of marker is determined by the kind of study to be undertaken. A suitable marker is characterized by high polymorphism, co-dominant inheritance, frequency of occurrence and even distribution throughout the genome (Welsing et al., 2005), selective neutral behavior, easy access, easy and fast assay, low cost and high throughput, high reproducibility, and transferability between laboratories, population and/or species (Woldesenbet et al., 2005).
Microsatellites or simple sequence repeat (SSR) is considered a good choice because of high abundance and reproducibility, easy scoring, low cost, extensive coverage, high polymorphic information content (PIC)and its co dominant nature (Wei et al.,2014; Pandey et al., 2015; Dossa et al., 2017a).
The efficiency of SSR is not faultless as its application was limited in sesame and the pioneer findings on sesame specific primers reported polymorphism in 10 SSRs in sesame (Dixit et al., 2005) compared to more than 1000 SSR loci in soybean (Xin et al., 2012; Song et al., 2004).This paradigm has however shifted recently since the completion of genome sequencing for this oil rich crop. The combination of agro-morphological and molecular markers is the best choice to characterize germplasm as it gives the opportunity to comparatively analyze the phenotypes from field experiments with molecular phenotypes and genotypes from laboratory studies (Pham et al., 2011).
Sesame research has witnessed three different periods: Germplasm collection era, classical breeding and genetics era and presently the Omics era. Advancement in Omic era has projected sesame research to a higher level of seed improvement (Dossa et al., 2017b). The completion and availability of the full nuclear genome sequence gives unlimited access to reference genome information for the study of genetic traits and comparative genomics (Wang et al., 2014).
The whole sesame genome was sequenced with the help of high-throughput next-generation sequencing and informative SSRs were identified to be distributed throughout the whole genome sequence (Dossa et al., 2017a). Botstein and others (Nagy et al., 2012)published one of the first reports where PIC became the popular scientific approach for calculation of genetic variabilities through a widely acceptable formula to measure the informationcontentofmolecularmarkers.PIC determines the value of a marker for detecting polymorphism within a population, depending on the number of detectable alleles and the distribution of their frequency (Wei et al., 2014).PIC gives an evaluation of the ability of molecular makers to discriminate a given population (Vilas, 2014).
This research was conducted to determine, using SSR markers, the extent of genetic variation or distance among twenty two accessions of sesame cultivars collected from the forest and savannah agro ecological zones in Nigeria. They are now conserved in the gene bank of the National Centre for Genetic Resources and Biotechnology.
Sample collection
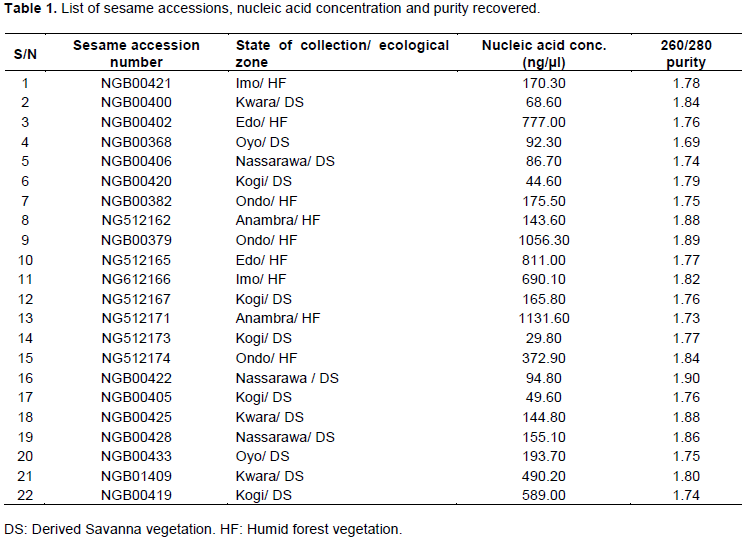
About 22 Sesame accessions from NACGRAB’s seed genebank that their field collections were within eight States of the Federation (Nigeria) but restricted to only two ecological zones were collected with their Accession Numbersfor this studiesas recorded in Table 1. The samples were potted in glass house and allowed to grow for 3 weeks before collection for analysis.
DNA extraction procedure
About 2 g of leaves from 3 weeks old of potted sesame was ground after being surface sterilized with ethanol and 700µl of freshly prepared modified CTAB extraction buffer (200mMTris, pH 7.5; 50mM EDTA, pH 8.0; 2M NaCl; 2% CTAB; 1% beta-mercaptoethanol (just before use))was added in mortar and pestle. The resultant mixture was homogenized and incubated in 65°C water bath for 20min. It was allowed to cool for 7 min and 600µL chloroform: isoamylalcohol (24:1) was added in the tubes. The mixture was placed in an orbital shaker at 450 rpm for 1 h. The supernatant recovered after centrifugation at 10,000 rpm for 7 min was transferred into new tubes and up to 600µL Isopropanol was added and kept in -20°Cfreezer overnight for DNA precipitation. The pellet was collected by centrifugation at 10,000 rpm for 2 min and washed with 70% ethanol up to 3 times. Pellet was air-dried in hood until no further trace of ethanol. An average of 150 µL nuclease free water was added to elute the DNA.
DNA quantitation
Nanodrop spectrophotometer 2000 model was used to check the quality and quantity of the extracted DNA prior to amplification of the gene regions.
Gene amplification
Primers were designed from 3 gene regions of S. indicum with the following accession numbers: XM_011086313; XM_011086585 and XM_020696983. Up to 30 primers were designed and tested but only 12 most polymorphic, with widest genome coverage were used for the analysis (Table 2). The good amplification result was produced and retried for reproducibility in total reaction volume of 20 µL (2.5 µL of 10x PCR buffer, 1.0 µL 25 mM MgCl2, 1.0 µL of 10µM forward primer, 1.0 µL 10µM reverse primer, 1.0 µL DMSO, 2.0 µL 2.5Mm DNTPs , 0.1 µL Taq 5u/ul , 3.0 µL 10ng/µl DNA, 8.4 µL H2O) for the following PCR reactions: 94°C for 5min incubation, 94°C for 15 s denaturation; 58°C for 20 s annealing; 72°C for 25 s extension; 72°C for 7 min final extension and held finally at 4°C till samples taken out of PCR machine. The product was checked on gel electrophoresis and viewed with 100 bp ladder in trans-illuminator.
Data analysis
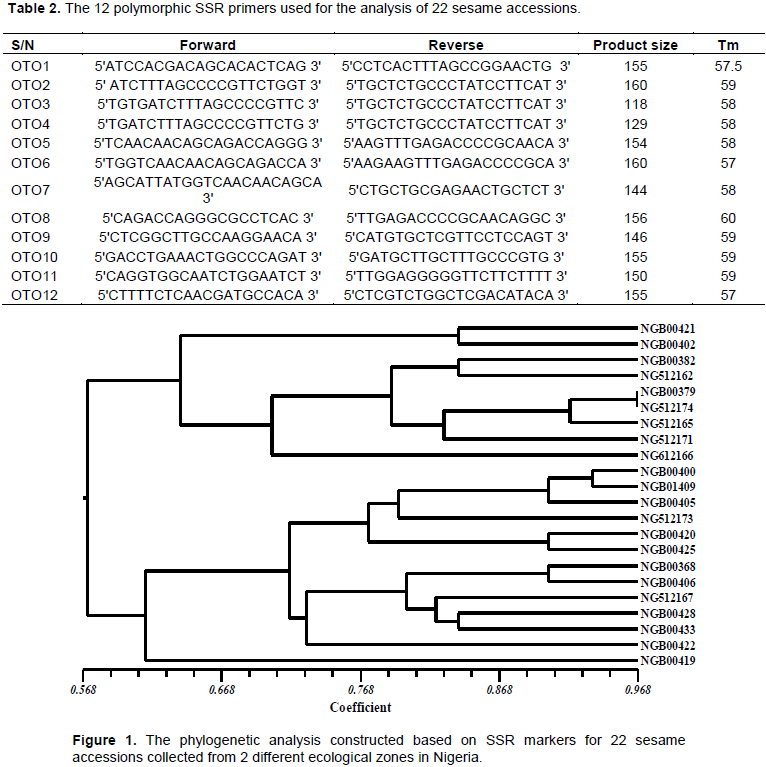
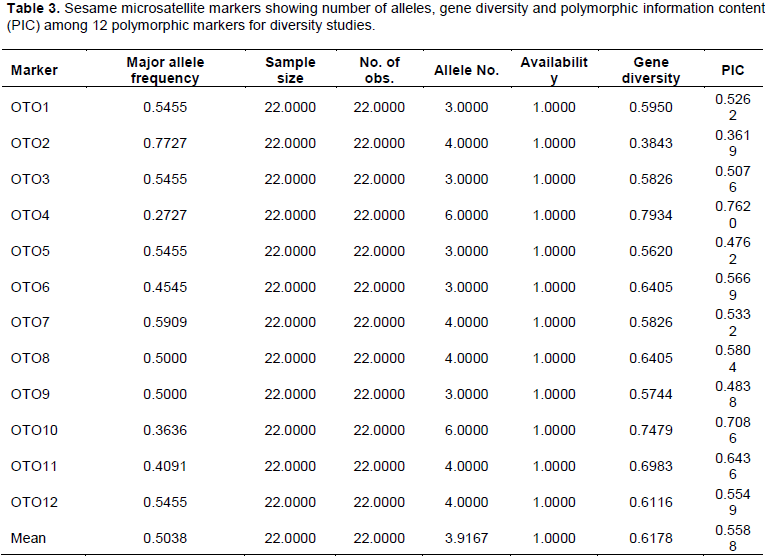
The data generated from the product of amplification and gel-electrophoresis were subjected to analysis using NTSYS pc ver.2.02 (Figure 1) and Power Marker ver.3.5 (Table 3).
The mean value for DNA purity of 1.79 recovered (Table 1) is close to the acceptable figure of 1.80 which is a prerequisite for downstream analysis (Desjardins and Conklin, 2010). The 12SSR primers (Table 2) revealed polymorphic motifs by producing variable number of alleles which are different in sizes (Table 3).
The total number of alleles identified at 12 primer loci across the 22 accessions of sesame is 47 (Table 3). These alleles ranged between 3 and 6 per locus. The average number of alleles per locus is 3.92. The loci with the highest number of alleles are found in OTO4 (6) and OTO10 (6). These two SSR loci with the highest variation of polymorphic motifs are best for discriminating the 22 accessions of sesame used in this study. In the same way, the frequency of the major alleles shared across the 22 accessions at each locus are between 27% (OTO4) and 77% (OTO2) covering about 50% (11 genotypes/accessions). A moderately high level of diversity was found among the 12 loci examined ranging between 0.38 and 0.79 with average of 0.62. The implication of the number of allele diversity and their frequency among the accessions is referred to as polymorphic information content (PIC) (Shahriar et al., 2014). PIC value of each marker is estimated on the basis of its alleles. There is significance in the variation of PIC for all the studied SSR loci. In this study, the level of polymorphism among the 22 sesame accessions was evaluated by calculating PIC values for each of the 12 SSR loci. The PIC values ranged from 0.36 (OTO4) to 0.76 (OTO2) with an average of 0.59 per locus (Table 3). The SSR primer loci with highest PIC is however more informative than what we had on the number of alleles. The PIC ofOTO4 (0.76) is higher than OTO10 (0.70) which clearly revealed that marker OTO4 becomes the best locus for discriminating the 22 accessions among the used markers followed by OTO10, OTO11, OTO8 and so on.
Furthermore, the Unweighted Pair-Group Method with Arithmetic mean (UPGMA) revealed 3 major clusters and one outlier (Figure 1). Two genotypes are however very close with up to 97% similarity (NGB00397 and NG512174). Following the site of these samples collection, they both came from Ondo state, humid forest vegetation. Although, they differ phenotypically and were collected from different locations in the same ecological zone, it was inferred that they possess similar genetic characters. In addition to this, the dendrogram separated into two major clusters on the node 57% based on the different ecological distribution of the genotypes. One cluster is made of 13 genotypes and are found to be the collections from the drier vegetation, the derived Savanna. While the second cluster comprise of 9 genotypes collected from the humid forest vegetation. These studies also proved certain patterns of association between genetic similarity and geographical proximity in sesame as also reported by Dossa et al. (2017b). Furthermore, it had been reported that the frequency of cross-pollination in sesame could be as high as 60% (Dossa et al., 2016). Hence the percentage similarity of geographically-close accessions may be insignificant and non-divergent. This is a plausible reason why breeders essentially must consider the geographical divergence of two parental genotypes if they really want to achieve any significant variation in their expected Sesame progenies which is similar to the report of Wei et al.(2014).
The authors have not declared any conflict of interests.
The authors wish to acknowledge the generous release of the germplasm of Sesame seeds from the seed genebank by the head of the Department and his staff who assisted in collection from the extremely cold vault.
PIC, Polymorphism information content; CTAB, cetyltrimethylammonium bromide; RAPD, randomly amplified polymorphic DNA; EDTA, ethylene di-amine tetra-acetate.