This study was undertaken to evaluate the extent and pattern of genetic diversity for immature pod traits in Ethiopia cowpea landrace collections. Eighty one landraces and improved cultivars were tested in a 9 x 9 simple lattice design. Analysis of variance revealed highly significant (P<0.01) or significant (p<0.05) differences among the genotypes for all traits. The first four principal components were able to explain 81% of variation for quantitative traits and 76% for qualitative traits. The genotypes were grouped into three distinct clusters, the first, second and third clusters with 60, 15 and 25% of the genotypes in that order. The landraces were distributed all over the clusters while the improved cultivars were absent in the second cluster. Shannon-Weaver diversity indices also showed existence of adequate genetic variability among the genotypes for qualitative traits. Shannon-Weaver diversity indices ranged from the lowest of 0.50 for pod curvature to the highest of 0.99 for pod shape. The study clearly showed that, even if the genotypes were classified into a few cluster, there was adequate divergence among the clusters showing existence of considerable genetic variability for immature pod traits for exploitation in future breeding for better green pod yield and quality in cowpea.
Cowpea (Vigna unguiculata (L.) Walp) is one of the most important grain legumes native to Africa (Timko and Singh, 2008). Cowpea is globally grown in tropical Africa, Asia, Latin America and Southern USA (Trinidad et al., 2010)under a wide range of soil pH including under low soil fertility, acidic soils and under drought-prone conditions (Badiane et al., 2012). The global area coverage of cowpea is estimated to around 11 million hectare from which 6 million tons of grain is produced with the share of Africa being 96% of world cowpea grain production (FAOSTAT, 2018). In Ethiopia, cowpea is grown almost in all lowland areas but the major production complexes are located in the Southern and Western parts of the country (Bedru et al., 2019; Sisay et al., 2019).
Cowpea is grown by farmers for different purposes including the nutritious tender leaves, immature pods, fresh peas and dry grain (Chikwendu et al., 2014; Gerrano et al., 2017; Mamiro et al., 2011). In terms of nutritive value, cowpea is an excellent source of protein, particularly to the poor people who could not afford animal products, essential minerals, vitamins and folates (USDA, 2015). Cowpea hay is also an important feed for animals during the dry seasons (Timko and Singh, 2008). The crop has deep roots which help to stabilize the soil, protect the surface and preserve the moisture (NRC, 2006). Like other legumes, cowpea also restores soil fertility by fixing atmospheric nitrogen (Nielsen et al., 1997). Thus, this crop can contribute greatly towards meeting the food requirement of people in areas where food security and malnutrition are major challenges.
Despite the manifold merits of cowpea in Ethiopia, the national production and productivity is far below the potential partially due to the biophysical challenges constraining productivity in smallholder farms and the inadequate technological interventions. Information on the cowpea production and productivity is scantly but a few sources show that the average national yield of cowpea in Ethiopia is estimated to be 400 kg ha-1 (Bedru et al., 2019), while yields of 2200 to 3200 kg ha-1 have been commonly recorded from improved varieties with proper crop management and protection practices (MoA, 2012). It showed the comparative advantages of genetic and agronomic interventions. From the breeding efforts by the research system hitherto, however, only six improved varieties were released (MoA, 2018), indicating the potential for further research particularly in cowpea breeding efforts.
It is obvious that genetic diversity in plant genetic resources provides an opportunity for plant breeders to develop new and improved cultivars with desirable characteristics including for farmers' preferred traits (Govindaraj et al., 2015). The success of crop breeding programs by and large depends on the magnitude of genetic diversity present in the breeding source materials, heritability of the trait under consideration and the level of selection intensity applied (Falconer, 1989). Genetic diversity is a prerequisite for the identification of superior genotypes, which may be recommended for direct release as commercial cultivars for wider production, but also for the identification of desirable parents to use as source materials in breeding programs (Rajaravindran and Natarajan, 2011). Ethiopia is believed to have considerable genetic diversity for cowpea both at phenotypic and genotypic levels (Belayneh et al., 2016; Mulugeta et al., 2016; Sisay et al., 2019; Tesfaye et al., 2019). Apart from genetic diversity for the regular morpho-agronomic traits at phenotypic level and for molecular diversity at genotypic level, information on the magnitude and pattern of phenotypic diversity for immature pod traits in Ethiopian landrace collections is scanty. Thus, this study was proposed to determine the extent and pattern of genetic diversity among cowpea collections using immature pod related phenotypic traits.
Plant material and experimental design
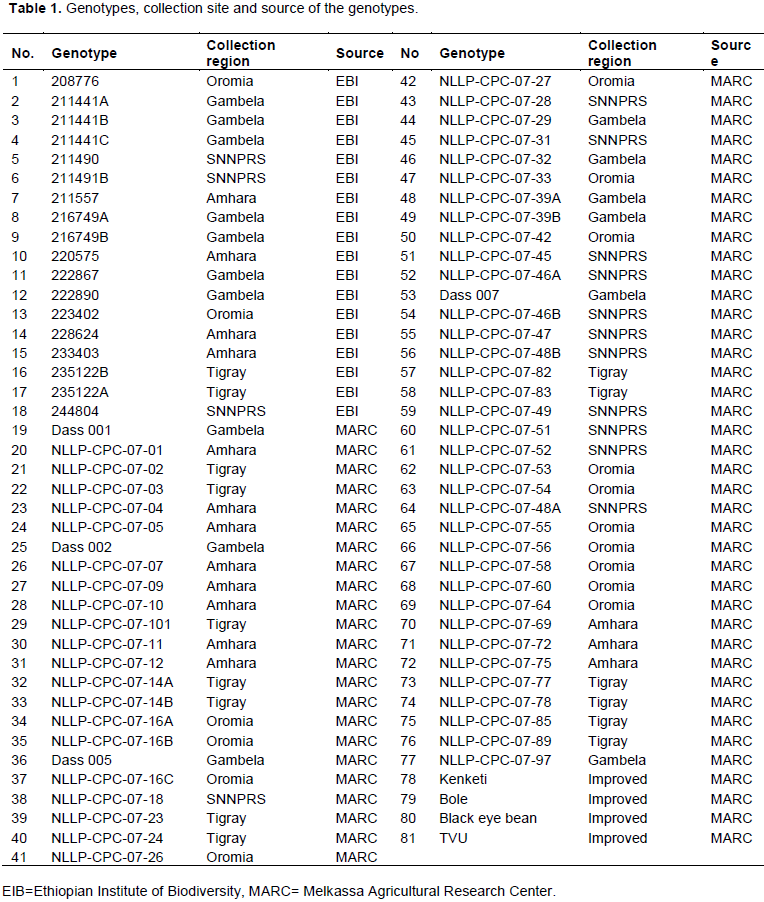
Eighty one cowpea genotypes including 77 Ethiopian landraces collections kindly provided by the Ethiopian Institute of Biodiversity and Melkassa Agricultural Research Center and four improved varieties were selected for the study (Table 1). The experiment was conducted in the experimental field of Melkassa Agricultural Research Center in Ethiopia under irrigated conditions. Complete block design like randomized complete block design become less efficient as the number of treatment increases, primarily block size increases proportionally with the number of treatments, and the homogeneity of experimental plot within a large black is difficult to maintain (Gomez and Gomez, 1984). To this effect, 9 x 9 simple lattice design was employed. The seeds were directly sown on a 2.25 m x 3.0 m plot of three rows with 75 cm inter row and 20 cm intra row spacing. All crop management and protection practices were kept constant as per the recommendation for the site.
Data collection
Quantitative characters including days to 50% flowering, days to first pod picking, terminal leaflet length, terminal leaflet width, number of primary branches, green pod length and width, average green pod weight and pod yield per plant were recorded. All data were taken on plant basis except days to 50% emergence and days to first pod picking which were recorded on plot basis. Qualitative variables including growth pattern, pod attachment to peduncle, pod color, immature pod pigmentation pattern, absence or presence of secondary color in the pod, hue of secondary color, pod shape, pod curvature, pod suture string and pod texture of the surface were also scored using the standard descriptors for cowpea germplasm characterization (IBPGR, 1983).
Statistical analysis
Analysis of variance was performed based on the model for simple lattice design following Gomez and Gomez (1984). SAS version 9.2 statistical package was used for the analysis (SAS Institute Inc., 2010). Records on the quantitative variables were pre-standardized to means of zero and variances of unity before clustering to avoid bias due to differences in measurement scales (Manly, 1986). The optimum number of clusters in data set were determined by using gap statistics (Tibshirani et al., 2001). Analysis were done using different packages of R in R environment (R Development Core Team, 2019). Hierarchical cluster analysis was used to group the genotypes based on their similarities. The distance was measured using Euclidean distance and the distance matrix was used to construct the dendrogram using ward D2 linkage method. Intercluster distances were calculated based on the standardized Mahalanobis's D2 statistics as:
D2ij = (xi - xj)' cov-1 (xi - xj)
Where, D2ij = the distance between cases i and j; xi and xj = vectors of the values of the variables for cases i and j; and cov-1 = the pooled within groups variance-covariance matrix. The significance of D2 values was tested by comparing the D2 values between any two clusters against tabulated chi-square (χ2) values at p = -1 degrees of freedom where p refers to the number of quantitative characters considered.
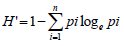
The diversity index (H’) of Shannon and Weaver (1949) was used to measure the level of genetic variation for qualitative traits. The index (H’) was estimated as follows:
Where: H’ = Shannon diversity Index; pi = the proportion of accessions in the ith class of an n–class character; n = the number of phenotypic classes of traits. Each diversity index value was divided by its maximum value (logen) and normalized, to keep the values between 0 and 1. Principal components based on correlation matrix were calculated using the same software as in clustering.
1=Days to 50% flowering, 2= Plant height (cm), 3= Days to 1st pod picking, 4= Terminal leaflet length (cm), 5= Terminal leaflet width (cm), 6= Number of primary branches, 7= green pod length (cm), 8= green pod width (mm), 9=Av. weight of green pod (g), 10= Pod yield (g/plant).
Analysis of variance
The range, mean square and CV of 10 quantitative characters of 81 cowpea genotypes are presented in Table 2. The range in the period from sowing to 50% flowering and days to first pod set was almost equal to 57 and 56 days, respectively. Similarly, the difference between the maximum and minimum mean value of plant height, terminal leaflet length, terminal leaflet width, pod length, pod width, average pod weight and pod yield were 160 cm, 5 cm, 5.9 cm, 4.4, 7.8 cm, 4.2 mm, 3.9 g and 717 g, respectively. The mean number of days to 50% flowering ranged from 42 days for genotypes 222867, 216749 B and NLLP-CPC-07-29 to 99 days for genotype NLLP-CPC-07-56. For days to first pod picking, the mean number of days ranged from 54 days for genotype 222867 to 110 days for genotypes NLLP-CPC-07-04 and NLLP-CPC-07-56. These phenological traits, 37% of the genotypes had taken more number of days to flowering compared to the grand mean (58 days) while 28% of the genotypes had taken more number of days to first pod picking compared to the grand mean (70 days). A wide range of variation in immature pod yield was recorded, which ranged from 30 g per plant for genotype NLLP-CPC-07-24 to 747 g per plant for genotype NLLP-CPC-07-54. The wide range for most of the traits indicated the diversity among the cowpea genotypes and also suggests the possibility of improving these traits through selection. The range and mean of days to 50% flowering and first green pod picking, plant height, number of primary branch, average pod weight and immature pod yield were generally larger than the previous reports (Khanpara et al., 2015; Shanko et al., 2014; Srinivas et al., 2017).
Most of the characters studied showed very highly significant (P<0.001) differences among genotypes except immature pod width which was significant at p<0.05. The analysis of variance revealed significant differences among the genotypes for the ten quantitative characters indicating the presence of adequate variability, which can be exploited through selection. Different reports indicated there is substantial phenotypic variability among cowpea varieties for different characters (Animasaun et al., 2015; Cobbinah et al., 2011; Gerrano et al., 2015; Lazaridi et al., 2017; Menssen et al., 2017; Molosiwa et al., 2016).
Diversity based on quantitative traits
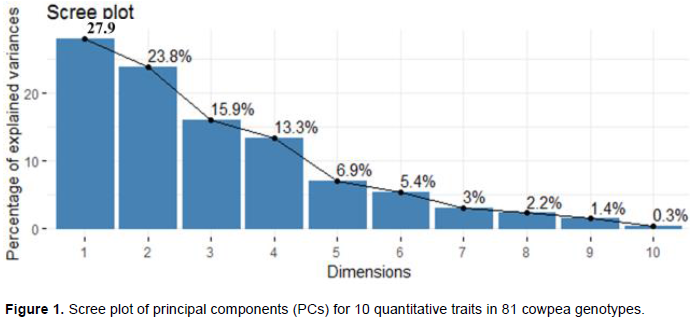
Principal component analysis (PCA) reflects the importance of the largest contributor to the total variation at each axis of differentiation (Sharma, 1998). To decide how many components to maintain; different methods were recommended, an eigenvalue greater than one indicates that PCs account for more variance than accounted by one of the original variables in standardize data. This is commonly used as a cutoff point for which PCs are retained (Kaiser, 1960). An alternative method to determine the number of PCs is to look at a scree plot, which is the plot of eigenvalues ordered from the largest to the smallest. The number of component is determined by the point beyond which the remaining eigen values are all relatively small and of comparable size (Jolliffe, 2002; Peres-neto et al., 2005). Accordingly, based on the scree plot (Figure 1) and eigenvalues (Table 3) four principal components (PCs) having eigenvalues between 1.33 and 2.79, extracted a cumulative of about 81% of the total phenotypic diversity maintained (Table 3). Manggoel and Uguru (2011)reported the first three components contributed 78.11% of the variability among the 10 cowpea accessions using 10 quantitative traits evaluated.
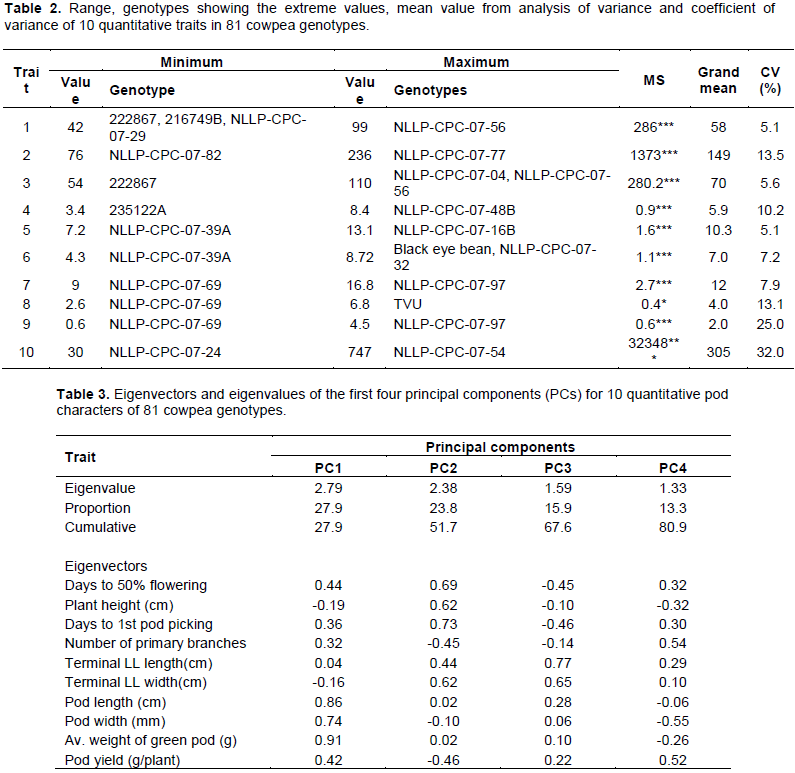
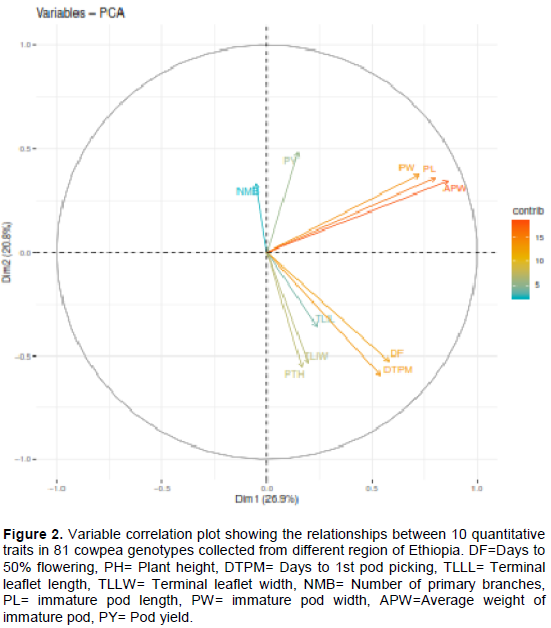
According to Chahal and Gosal (2002) characters with the largest absolute values closer to unity within the principal components influence the clustering more than those with lower absolute values closer to zero. The first principal component explains up to 27.9% of the total variance, and this was due mainly to variations in pod characters (average pod weight, pod length and width (Table 3). High contribution of pod character reported by Tesfaye et al. (2019) and in their report, about 77% of the total variance in 18 quantitative traits of 324 Ethiopian cowpea accessions could be explained on the basis of seven principal components and the first 22.6% of the total variance was due to mainly to pod length, seed length, seed width and seed yield per plot. Days to 50% flowering, days to first pod picking, plant height, and terminal leaf width were the main contributor for the variation in the second PC, which contribute 23.8% from the total variations. Similarly, the proportion of the total phenotypic variance of the genotypes accounted for by the third and fourth PCs were about 15.9 and 13.3%, respectively. The major contributor character for the third PC were variations mainly in the terminal leaflet length and width; and by less extent the phenological traits while variations in pod width, number of primary branches and pod yield contribute to the fourth PC. The PCA confirmed that the collected Ethiopian cowpea landraces have high diversity and all of the traits considered appeared to have high contributions towards the total phenotypic variability.
In the variable correlation plot (Figure 2), variables that are closed to the center of the plot are less important for the first components. Accordingly, a number of primary branches (NMB) and terminal leaflet length (TLLL) contribute less for principal components 1 and 2. Pod characters such as pod length (PL), pod width (PW), and average pod weight (APW), and crop maturity parameters (days to 50% flowering (DF) and first pod picking (DTPM)) were the major variables contributed for the variance of the first two components.
To observe the overall distribution pattern and correlations among the data attribute cluster analysis was done based on ten morphological traits related to the immature pod character of cowpea. The optimum number of clusters as determined by gap statistics was 3 (Figure 3a). The average linkage clustering method classified the 81 cowpea genotypes into three distinct clusters (Figure 3b). The number and name of genotypes in each cluster with their collection regions are presented in Table 4.
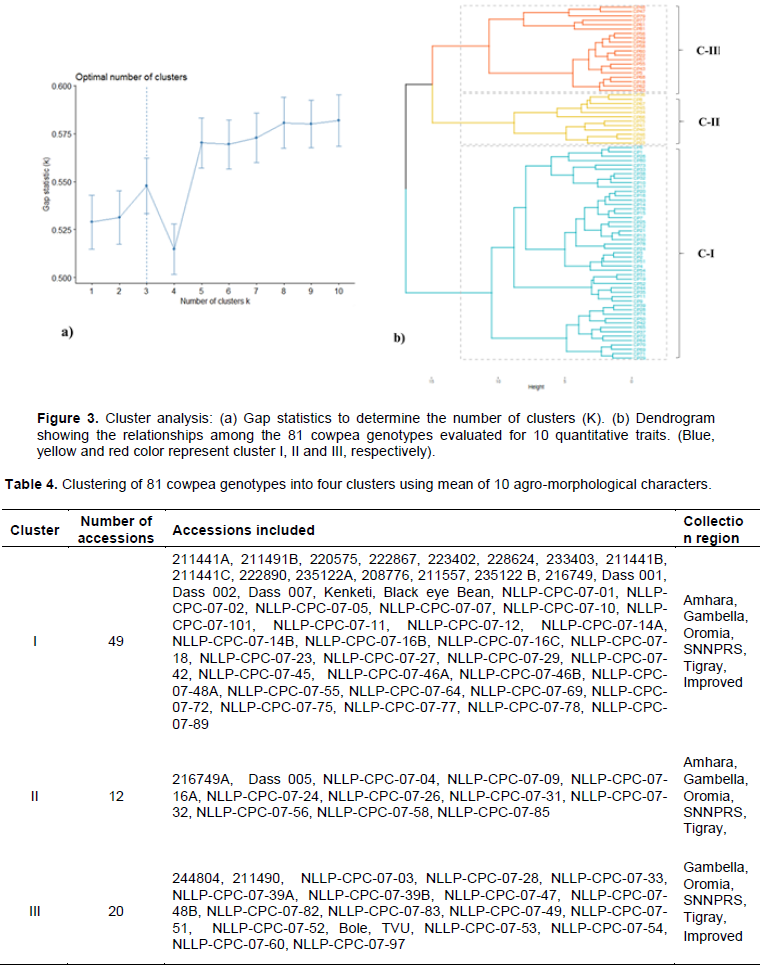
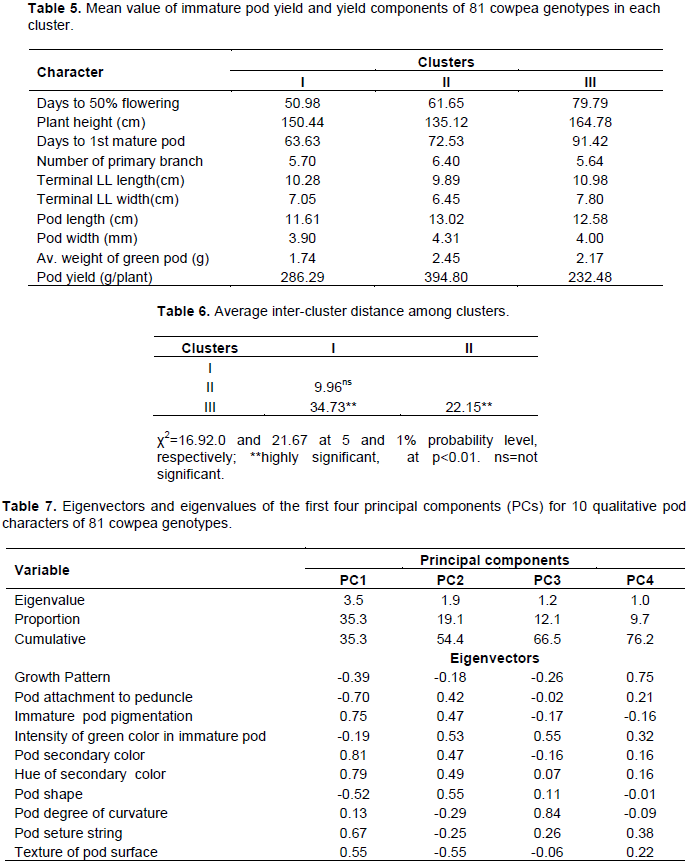
Cluster I was the largest group having 49 (60%) genotypes comprised from all collection regions, improved cultivars and are characterized by early maturing genotypes, with the mean value of 51 days and 64 days for 50% flowering and first pod picking, respectively. The pod length, width and weight of this group were smaller. The second cluster consisted of about 15% of the genotype but all are landraces from all collection regions. This group was characterized by high yield and yield component traits (pod length, pod width, average pod weight and a number of the primary branch). The third group had 20 (25%) genotypes with large leaf areas (leaflet length and width), highest plant height and late maturing genotypes. The third cluster with high yield and genotypes in this cluster is a good source of pod yield per plant. The mean value of the 10 quantitative characters in each cluster is indicated in Table 5.
The pairwise generalized squared distance (D2) among the three clusters based on Mahalanobis’s D2 statistics revealed the maximum and highly significant genetic distance was recorded between cluster I and III (D2= 34.73) followed by cluster II and cluster III (D2= 22.15). Non-significant (P>0.05) inter-cluster distance was observed between clusters I and II (D2=9.96), indicating that genotypes in these two clusters had relatively little genetic divergence (Table 6). Thus, the crossing of genotypes from these two least distanced clusters produces little heterotic expression in the F1 population and low range of variability in subsequent segregating populations.
Diversity based on qualitative traits
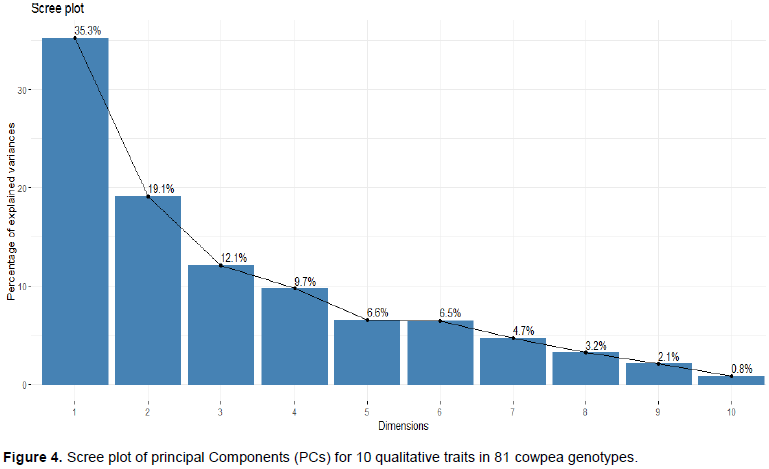
In the principal component analysis (PCA) of 10 qualitative traits in 81 cowpea genotypes, four principal components were retained based on eigenvalues and scree plot (Table 7 and Figure 4). The qualitative traits showed that the first four PCs explained 35, 19, 12 and 10%, respectively of the total variance. The correlation between the variables and components for PC1 was mainly due to pod secondary color, the hue of secondary color, immature pod pigmentation, and pod attachment to peduncle and pod suture string. The texture of the pod surface and pod shape contributes to the variance in the PC2. The third component was related to the Intensity of green color in the immature pod and pod degree of curvature while PC4 was mainly due to the growth pattern of the genotypes.
Frequency distribution patterns, percent of proportion and Shannon-Weaver Diversity Index (H’) were estimated for 81 cowpea genotypes from 10 qualitative traits (Table 8). The dominant (81%) growth pattern among the genotypes was indeterminate growth habit and 68% of the genotypes did not have pigment in its immature pod. The proportion of genotypes with preferred immature pod characters like medium to dark green pod color, with the absence of secondary color in its pod, round shape cross-section, straight pod and fibreless were 27, 72, 51, 89 and 52%, respectively. Immature pod with very smooth and smooth surfaces were 10 and 33%, respectively. Proulx et al. (2010)indicated that for fresh pod quality the acceptable pod quality is pods with bright green color with no secondary color, tender, and firm, snap very easily, no sign of shriveling and abnormality. Thus, this result indicated the existence of considerable diversity to develop varieties for green pod purposes. For most genotypes, the pod attached to the peduncle was pendent (47%). Those genotypes with secondary color in their pods, the hue of secondary color were dominantly pink (83%) and only 17% of the genotypes were red colored.
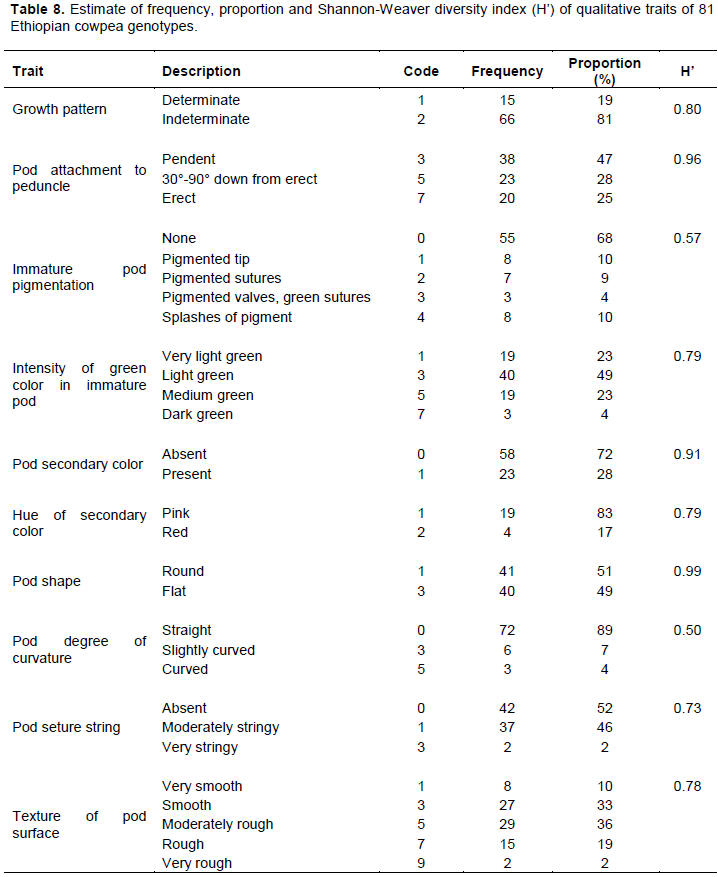
Shannon-Weaver diversity index (H’) was used to compare diversity among qualitative traits. The value of the Shannon diversity index ranged from 0.50 to 0.99. Higher value of H’ observed for pod shape (0.99) followed by pod attachement to peduncle (0.96) and pod secondary color (0.91). The frequency class of pod curvature was unbalanced, 72, 6 and 3 for straight, slightly curved and curved pods, respectivelly and due to this the H’ was low (0.50). A low H’ indicates extremely unbalanced frequency classes for an individual trait and a lack of genetic diversity (Perry and Mclntosh, 1991).
Ethiopian cowpea landraces were found to be divers for immature pod characters based on the quantitative and qualitative traits tested. Thus, there is an opportunity to develop cowpea varieties for immature pod purposes from available local germplasm collections either through selection or hybridization. Genotypes with good quality for immature pod purposes can be used as a source of new cultivars with improved features or as a gene pool of useful traits in breeding programs.