African Journal of
Environmental Science and Technology

  • Abbreviation: Afr. J. Environ. Sci. Technol.
  • Language: English
  • ISSN: 1996-0786
  • DOI: 10.5897/AJEST
  • Start Year: 2007
  • Published Articles: 1128

Full Length Research Paper

Non-carbon benefits for effective implementation of REDD+: The case of Bale Mountains Eco-Region, Southeastern Ethiopia

Sisay Nune Hailemariam
  • Sisay Nune Hailemariam
  • Addis Ababa University, P. O. Box 1176, Addis Ababa, Ethiopia.
  • Google Scholar
Teshome Soromessa
  • Teshome Soromessa
  • Addis Ababa University, P. O. Box 1176, Addis Ababa, Ethiopia.
  • Google Scholar
Demel Teketay2
  • Demel Teketay2
  • Department of Crop Science and Production, Botswana College of Agriculture, Private Bag 0027, Gaborone, Botswana.
  • Google Scholar


  •  Received: 01 July 2015
  •  Accepted: 15 September 2015
  •  Published: 30 October 2015

 ABSTRACT

The study was conducted in four districts, namely Nansebo, Harenna Buluk, Dolo Mena and Dodolla, Southeastern Ethiopia with the following objectives - to: (i) investigate species richness and similarity, diversity, evenness and stand structure of the woody species; (ii) determine the amount of carbon stock stored in the above-ground biomass of woody species; (iii) establish the relationship between the Shannon diversity indices and carbon stock, (iv) identify the most important forest non-carbon benefits obtained by the local communities from the forests; and (v) determine contribution of forest resources to the local economy when compared with other incomes generated from agriculture, including livestock. Data generated by FARM Africa were used to achieve objectives (i) - (iii). To achieve objectives (iv) and (v), a focus group discussion and household survey were conducted. A total of 125 species of woody species, representing at least 45 families and 77 genera, were recorded. The Shannon diversity and evenness indices of the woody species ranged between 2.8 (Dodolla) and 3.5 (Harenna Buluk) and 0.79 (Nansebo) to 0.82 (Dolo Mena), respectively. The woody species had densities ranging from 550 (Dodolla) to 2106 (Harena Buluk) individuals ha-1. The above-ground carbon stock stored ranged between 148.88 (Dodolla) and 246.27 (Dolo Mena) tons ha-1. About 10 products and services were mentioned by the respondents as important non-carbon benefits from the forests. The non-carbon benefit with the highest contributions in the three districts was fuelwood, while coffee had the highest contribution in Dolo Mena. The contribution of forests to the local economy was significantly compared with other incomes.  Forests contributed 40.2% to the household income in Harenna Buluk District and 18.8% in Nansebo District. Considering non-carbon benefits in the design and implementation of reducing emissions from deforestation and forest degradation (REDD+) is important to ensure its acceptance by local communities.
 
Key words: Bale, eco-region, non-carbon benefit, reducing emissions from deforestation and degradation (REDD+).


 INTRODUCTION

Reducing emissions from deforestation and forest degradation (REDD) was discussed during Conference of Parties to the United Nations Framework Convention on Climate Change (UNFCCC) in Bali (COP 13). But, the idea of REDD+ was first introduced in 2005 by developing countries at the eleventh conference of parties to the UNFCCC as RED (Vijge and Gupta, 2014). The second ‘D’, referring to forest degradation, emerged later in 2007 (Wertz-Kanounnikoff and Angelsen, 2009). Since then, progresses have been made with regard to REDD+. In 2010, in Cancun, REDD+ emerged to emphasize that developing countries should be encouraged to contribute to mitigation actions in the forest sector by the full scope of REDD+ activities through: (i) reducing emissions from deforestation; (ii) reducing emissions from forest degradation; (iii) conservation of forest carbon stocks; (iv) sustainable management of forests; and (v) enhancement of forest carbon stocks (UNFCCC, 2011).
 
Some experts argue that the plus sign, such as conservation, sustainable management of forests and enhancement of forest carbon stocks, might deprive the rights of local communities in the long run as REDD+ activities may focus on carbon intensive projects.  Additionally, viewing forests only for their carbon sequestration purpose underestimates their non-carbon benefits. Non-carbon benefits are benefits gathered from forest, which can be tangible or intangible. Tangible forest resources include wood, leaves, grasses, forest coffee, forest honey, fruits, medicinal plants, fish, meat from hunting, etc. Intangible forest resources include water that comes from forest, pollen from forest flowers, erosion prevention, nutrient supply, etc. There is assumption that carbon finance alone might not be attractive enough to local communities and forest managers when compared with other land use options. Furthermore, there is high demand for non-carbon forest resources. Incorporating carbon as a component of multiple objectives management alters the economics of forest enterprises (up to 30% increase in revenue) and, thus, acts as a catalyst to create an economic incentive for forest plantation development, but not sufficient to compensate the 70% (Yitebitu et al., 2010). Annual carbon payments in agro-forestry contracts in Mozambique were equivalent to about two months of wage labor. Thus, carbon payments appeared to play a relatively weak role in improving household incomes (Groom and Palmer, 2012).
 
Tropical deforestation accounts for up to a fifth of global anthropogenic carbon dioxide emissions (Groom and Palmer, 2012). For instance, between 1990 and 2000, some 16 million ha of tropical forests were lost per year (McDermott et al., 2012). Agriculture land expansion and biomass energy consumption have been attributed as the main causes. Worldwide, about 1.6 billion people heavily depend on forest resources for their livelihoods (FAO, 2001). Therefore, the lives of these people are directly affected by forest degradation and deforestation.
 
REDD+ created a lot of expectations. Local communities, politicians, governments and NGOs are hoping that modest carbon finance might be established to offset parts of the greenhouse gases (GHGs) from the atmosphere as well as mitigate the emissions. Failure to establish carbon finance mechanism and meet the expectations may cause REDD+’s collapse in the future. But if the design considers all benefits from the forestry sector, REDD+ might be successful. To do that, there is a need to establish proper indicators to monitor those non-carbon benefits and link REDD+ to a broader landscape.
 
Among the various benefits that a landscape in general and forest resources in particular provide to local communities, removal and mitigation of GHGs, biodiversity non-carbon benefits, and tangible and intangible non-carbon benefits are worth mentioning. The Environmental System of Accounting has a system to measure the contribution of such non-carbon benefits to the national economy (Bann, 1998; Lang et al., 2003). Nune et al. (2013) have estimated that the Ethiopian Forest Sector contributed 11 and 9% to the GDP in 1995 and 2005, respectively. However, this contribution did not get the attention of the decision makers until REDD+ emerged. REDD+ incentives currently cover for only small portion of the total value of the forests (only GHG removals and mitigation).
 
The current negotiation at the international level seems to be focused on the use of forests in reducing CO2 emission with little attention to their other benefits, which ensure food security to billions of the poor in developing countries. The main argument behind such attitude is that estimating carbon is relatively simple when compared with the other benefits, such as biodiversity and watershed values. Furthermore, the international community is currently more concerned with problems related to GHG emissions. Although, the effort to reduce GHG emissions is commendable, the argument at this stage is that it is possible to consider the biodiversity value while targeting CO2 levels. When local communities fail to enjoy the benefits of biodiversity and other landscape non-carbon benefits, including the cultural and customary benefits, as a result of weak policies that undermine incentives, they tend to overexploit environmental resources because of lack of sense of ownership. Hence, strategically, it is better to give sufficient emphasis to biodiversity and other non-carbon benefits when REDD+ is implemented.
 
Many ecological functions associated with the   provision of ecosystem non-carbon benefits to   agriculture are closely related to the biodiversity in associated semi-natural patches (Burel et al., 2013). Biodiversity and other forest non-carbon benefits might be difficult to maintain or improve unless they are considered as part of the development plan of a country and given equal weight similar to food security or poverty reduction. Tscharntke et al. (2012) argued that conventional agricultural intensification often results in contamination by pesticides and fertilizers, which can affect human health and create non-target effects on wildlife and functional agro-biodiversity (Gibbs et al., 2009). When multiple ecosystem non-carbon benefits are considered, more efficient outcomes can be achieved where the net gains of land use change   are maximized (Bryan, 2013).
 
Forest non-carbon benefits are non-carbon benefits that are derived from forests, usually categorized under two main groups, that is, non-carbon benefits that are tangible and monetized easily, and non-carbon benefits that are intangible and difficult to monetize. Tangible non-carbon benefits include firewood collection, timber and grass harvesting, fruits, forest coffee, medicines, and water resources.
 
Intangible forest non-carbon benefits are those non-carbon benefits a local community gains because of the existence of forests, such as pollination, microclimate adjustment, carbon sequestration, biodiversity and watershed or catchment protection. Forest non-carbon benefits fall either in one or both of the climate change adaptation and mitigation part of the climate change discourse. Incorporating non-carbon benefits in the REDD+ payment scheme would enhance the interest of local community and local government to engage in the implementation of the REDD+ effectively and sustainably.
 
There are safeguard policies developed by multilateral organizations, such as the Forest Carbon Partnership Facility (FCPF) in the World Bank and the UN-REDD+ as well as private and NGO certification schemes (Voluntary Carbon Standard, Carbon, Community, Biodiversity Alliance and REDD+ Social and Environmental Safeguards), which are designed to be implemented at national and project levels. Multi-lateral funding programs have drawn heavily on existing safeguards for international aid, while private certification schemes have specialized in different niche priorities at the project level. With regard to the substance of safeguard requirements, the involvement of donors and investors appears correlated with a stronger emphasis on carbon and risk mitigation while greater NGO involvement and the decoupling of safeguards design from REDD+ funding appear correlated with greater emphasis on social rights and benefits (McDermott et al., 2012). For FCPF and UN-REDD+ countries, interest is ultimately contingent on serving the central aim of REDD+, that is, reducing forest carbon emissions.
 
REDD+ methods approved by Voluntary Carbon Standard (VCS) do not address environmental or social safeguards (McDermott et al., 2012). Carbon, Community and Biodiversity Alliance (CCBA), on the other hand, considers social benefits as additionality. CCBA requires that projects should generate measurable and verifiable additional net social benefits that are ‘‘equitably shared among community members and constituent groups’’ (CCBA, 2008; McDermott et al., 2012). CCBA evaluates projects on the basis of whether or not they are pro-poor and benefit more vulnerable households and individuals.
 
McDermott et al. (2012) have developed a “continuum of safeguards prioritization” from pure carbon to non-carbon values (VCS, FCPF & UN-REDD, CCBA, REDD+SES and Non-REDD). Based on its analysis, VCS considers pure carbon, whereas organizations who oppose the idea of carbon-focused payments altogether, outside of the above-mentioned organizations, consider Non-REDD+ but other benefits. In some cases, a combination of standards is possible, e.g. VCS and CCBA. Under CCBA, co-benefits are considered.
 
The choice of organizations in the implementation of REDD+ determines what benefits should go to communities. Furthermore, lack of measuring and reporting mechanisms for non-carbon benefits in the safeguards of multilateral funding and VCS may pose a great challenge for future REDD+ implementation. The success or failure of REDD+ will be determined not only by carbon emission reductions, but also by equity for local communities and indigenous peoples (Jaung and Bae, 2012).
 
The objectives of this study were to: (i) investigate species richness and similarity, diversity, evenness and stand structure of the woody species; (ii) determine the amount of carbon stock stored in the above-ground biomass of woody species; and (iii) establish the relationship between the Shannon diversity indices and carbon stock stored in the above-ground biomass of woody species in the forests of four districts found in the BMER, (iv) identify the most important forest Non-Carbon Benefits obtained by the local communities from the forests; and (v) determine contribution of forest resources to the local economy when compared with other incomes generated from agriculture, including livestock production.
 
The results from the study are expected to assist government (both federal and regional) and other concerned parties to consider non-carbon benefits prior to any decision or negotiation they make regarding REDD+ since non-carbon benefits are not only crucial for the livelihoods of the communities but also might be determining factors for the success of the REDD+ initiatives.


 MATERIALS AND METHODS

Study area
 
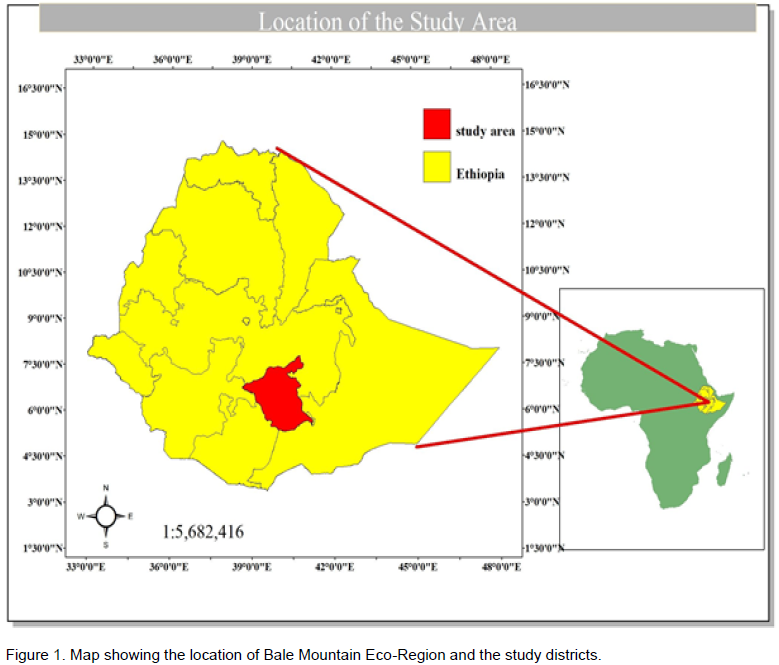
The study was carried out in Bale Mountains Eco-Region (BMER), southeastern Ethiopia. Geographically it is located between latitude 5°16ꞌ54ꞌꞌN and 7°52ꞌ55ꞌꞌN, and longitude 38°37ꞌ52ꞌꞌE and 41°13ꞌ0ꞌꞌE (Figure 1). The BMER is found within one of the Afromontane forests. The Afromontane rain forest is mainly distributed in two geographically different and wide apart regions namely South-west and South-East forests (Friis, 1992). Both areas are part of the Eastern Afromontane Biodiversity Hotspot. The two sites are known for their non-carbon resources among which Non-Timber
 
 
Forest Products (NTFP), where forest dependent communities practice their customary rights, such as collection of wild coffee, honey and spices, which are abundant. In the BMER there is Participatory Forest Management (PFM). There are more than 60 forest user groups who are responsible for the management of this forest area.
 
Sixteen districts (locally known as Woredas), namely Agarfa, Dinsho, Adaba, Dodolla, Goba, Sinana, Gololcha, Gasera, Delo Mena, Kokosa, Berbere, Harana Buluk, Nansebo, Mada Walabu, Goro and Guradhamole form the BMER. The forests in the BMER are mainly high forests composed of six forests formerly designated as “forest priority areas”, namely, Aloshe Batu, Goro Bale, Harana Kokosa, Kubayu, Menna Angetu and Adaba Dodolla (EFAP, 1994). According to FARM-Africa (FARM Africa, 2008), the total forest area of the BMER was 690,000 ha in 2011, of which 193,000 ha was covered by the Bale Mountain National Park (BMNP), which was not included in this study.
 
About 1,904,279 people live in the sixteen districts (CSA, 2013) of which BMER comprises 61.4%. BMNR receives almost eight months of precipitation (March-October). Temperature varies from the lowest less than 7.5°C at the Sannati Plateau to over 25°C in Dolo Mena (WBISPP, 2001). 
 
The Bale Mountains, housing BMNP and surrounded by the priority forest areas, mountains, valleys, grasslands and agricultural land, represent the largest area of Afro-alpine habitat in the African continent (FARM Africa, 2008). It is home of not only the endangered Ethiopian Wolf (Canis simensis) but also diverse bird species, Mountain Nyala (Tragelaphus buxtoni), the entire population of the Giant Mole Rat (Trachyoryctes macrocephalus) and stocks of valuable genetic material, including wild coffee (Coffea arabica L.) (OFWE et al., 2014).
 
The BMER is considered as the water tower of south-eastern Ethiopia, Somalia and Northern Kenya. According to recent studies, the BMER supplies water for some 12 million people in the lowlands of southeast Ethiopia, Northern Kenya and Somalia (OFWE et al., 2014). A total of 40 rivers arise in the area, contributing to five major rivers, namely the Web, Wabi Shebele, Welmel, Dumal and Ganale (FARM Africa, 2008). These rivers are the only sources of perennial water for the arid lowlands of the eastern and southeastern Ethiopia, including the Ogaden and Somali agricultural belt (OFWE et al., 2014).
 
 
Despite its great significance, the BMER is under threat. Deforestation and forest degradation, resulting from immigration of people from other parts of Ethiopia and, hence, population increment, livestock pressure, fire and settlement, have affected the status and future of the forest resources. The projected deforestation for the period of 10 years exceeds 150,000 ha (FARM Africa, 2008), and it has been projected to continue unless proper incentives to the stakeholders in the area are provided. Failure to design attractive incentive system to the communities and the local government as well as restricting communities to access non-carbon benefits may lead to further loss of these invaluable resources. Temperature in BMER varies from the lowest, less than 7.5°C at Sannati Plateau to over 25°C at around Dolo Mena (WBISPP 2005). 
 
The ecoregion consists of conifers and broadleaved species. The large Harenna forest of the Bale Mountains is floristically very closely related to South Western Ethiopian Afromontane forests (Friis 1992). The conifers are mainly Podocarpus falcatus and Juniperes procera.
 
Tree species in the area include Oleaa europea subsp. cuspidata, Acacia abyssinica, Acacia negri, Euphorbia abyssinica and Apodytes dimidiata, Allophylus abyssinicus, Myrsine melanophloeos and Olinia rochetiana.  Epiphytes like orchids, mosses and lichens are also present. The shrub layer is primarily composed of Myrsine africana, Calpurnia aurea, Dovyalis abyssinica and Carissa spinarium. Climbers include Smilax aspera, Urera hypselodendron, Embelia schimperi, Jasminum abyssinicum and various species of the Cucurbitaceae family. The ground is usually covered with grasses, herbs, mosses and ferns.
 
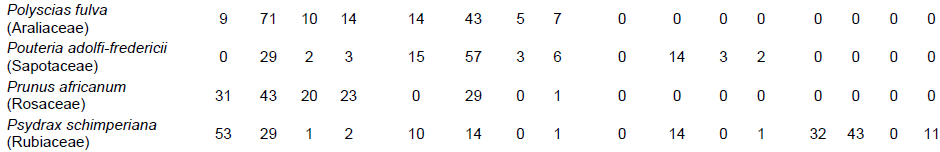
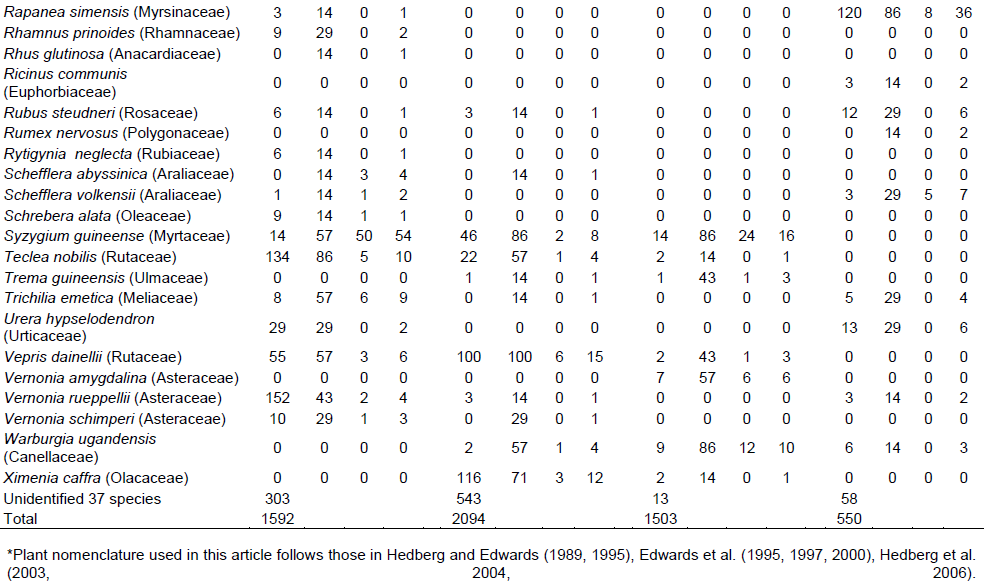
Other trees that are grouped under broadleaved tree species include Apodytes dimidiate, Celtis africana, Croton macrostachyus, Ekebergia capensis, Milletia ferruginea, Polyscias fulva, Syzigium guineense, Cassipourea malosana, Elaeodendron buchananii and Schefflera abyssinica. The most frequent small tree species include Allophylus abyssinicus, Bersema abyssinica, Bridelia micrantha, Ehretia cymosa, Maesa lanceolata, Nuxia congesta, Oxyanthus speciosus, Rothmannia uncelliformis, Teclea noblis and Vepris daniellii. Wild coffee is one characteristic species in the understory between 1000 and 2000 masl.
 
Non-timber forest products (NTFPs) that are essential for the local economy include Arabica coffee, Gesho (Rhamnus stado) and medicinal plants. Grass for domestic animal is another significant NTFP especially during the dry season. Quite a lot of cattle are dwelling in the forest during the hot season.
 
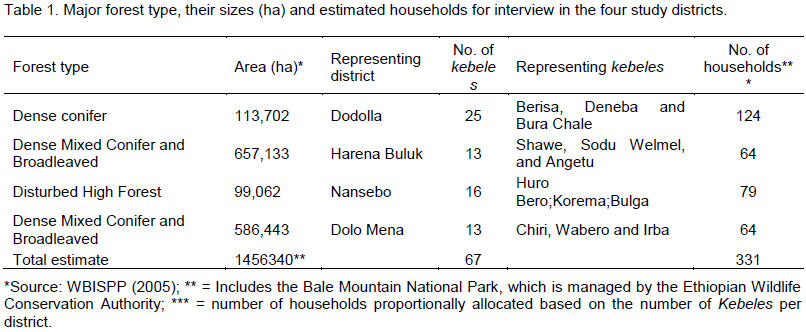
The main soil types common in the area are Cambisols, Vertisols, Luvisols, Lithosols and Nitosols (FARM Africa, SOS Sahel and OFWE, 2014). The Bale Mountains form part of the Ethiopian highlands system and was formed during the Oligocene and Miocene geological periods, between 38 - 7 million years ago. The area consists of a vast lava plateau with at least six volcanic cones, each more than 4,200 m high, which have been considerably flattened by repeated glaciations (ibid). For this study, four districts are considered. These are Dodolla, Harena Buluk, Kokosa and Dolo Mena districts (hereafter referred to as by their names). The districts housed conifers, mixed conifers, broadleaved and high forests (Table 1).
 
In the selected districts, sample households were selected using simple random sampling (SRS) method (Moore and McCabe, 2002). Three kebeles (the smallest and lowest administrative unit in Ethiopia) from each representative district were chosen. The sample kebeles in a district were considered to be representative in terms of wealth status (poor, medium and rich), age (more than 50, less than 50), sex (female and male) and education background (read and write and illiterate) of the interviewees. Accordingly, Berisa, Deneba and Bura Chale kebeles in Dodolla, Huro Bero, Korema and Bulga kebeles in Nansebo, Sodu, Welmel, Angetu and Shawe kebeles in Harena Buluk and Cheri, Wabero and Irba kebeles in Dolo Mena were chosen (Table 1). The final analyses were, then, aggregated at the district level.
 
 
Methods
 
Various methods were employed to investigate the relationships between different woody species diversity indices and carbon stock as well as the non-carbon benefits obtained by the local communities from the natural forests in the study area.
 
Relationships between different woody species diversity indices and carbon stock
 
To investigate the relationships between different woody species diversity indices and carbon stock, the dataset collected during the forest inventory carried out by FARM Africa (with written permission to use the data from FARM Africa) in the study forest resources in 2013 was used.
 
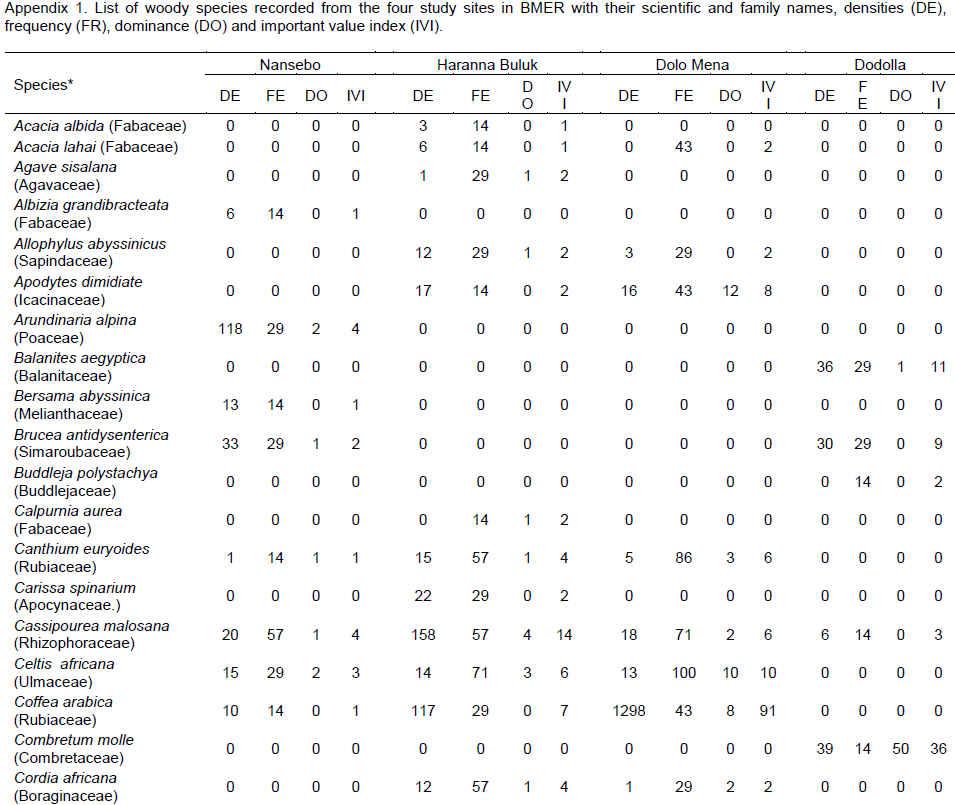
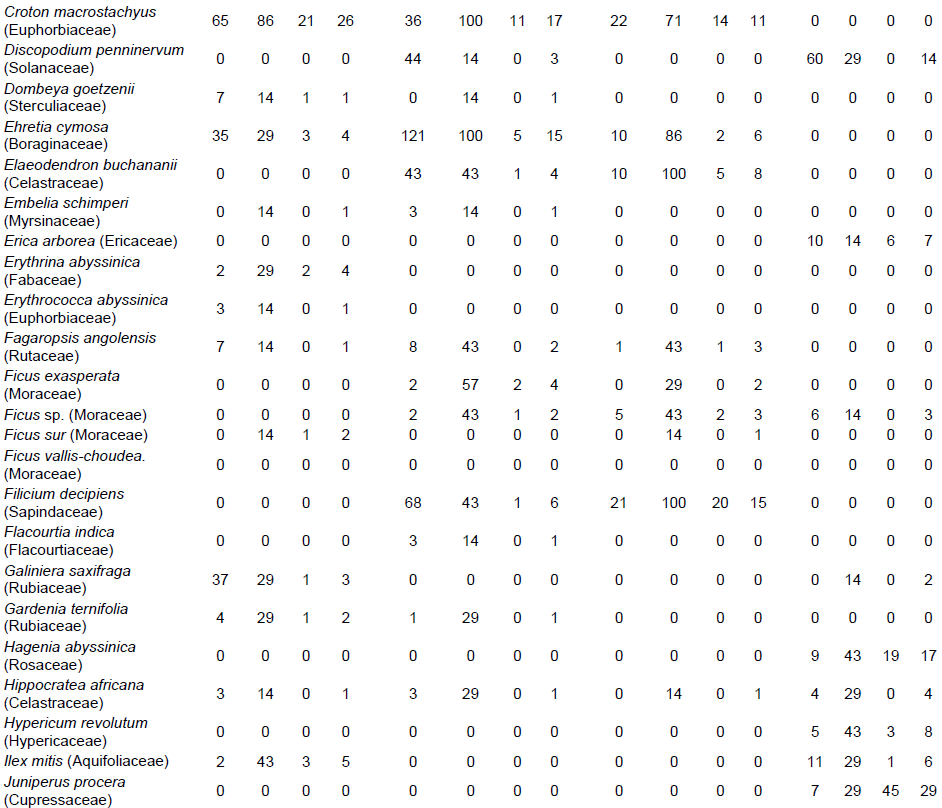
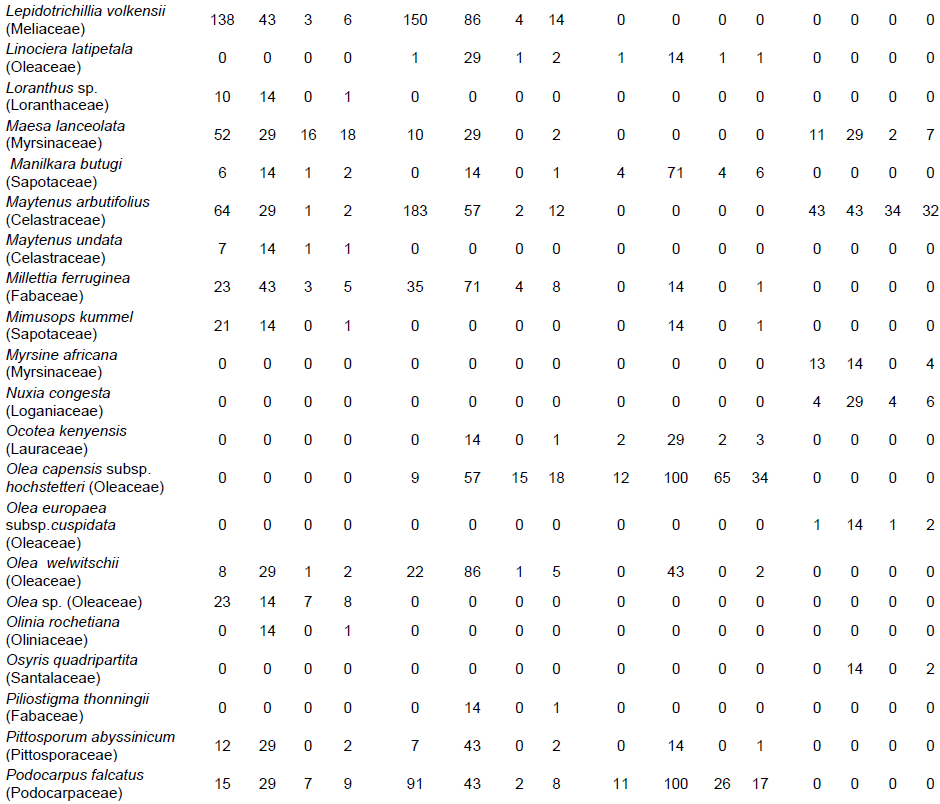
To determine species richness, diversity, densities, frequencies, dominance and, hence, important value indices of woody species as well as their carbon stock, a total of 28 square quadrats measuring 100 x 100 m (10,000 m2) were laid down randomly. In each of the quadrats, the following parameters were recorded: identity of all woody species, number of all live individuals and diameter at breast height (DBH) of individuals with DBH > 2 cm of each woody species. A calliper and graduated measuring stick were used to measure DBH and height, respectively, of the woody species.
 
Non-carbon benefits
 
To investigate the types, quantities and values of non-carbon benefits obtained by the local communities from the forest resources, household surveys (HHSs) and focus group discussions (FGD) were undertaken.
 
Household survey: To determine the number of households for the HHSs, the coefficient of variation (CV) was calculated using data from a study carried out on maize production per household in the BMER in 2013. A total of 223 households were considered to estimate the coefficient of variation (CV) in production. The mean production was about 10 quintals per household. The standard deviation was approximately 11. Using these two figures, the CV was calculated as 91%. Accordingly, the numbers of sample households for this study were determined using the following formula (Moore and McCabe, 2002; Loetsch and Haller, 1973):
 
 
Where, n = number of sample households, CV = coefficient of variation, t = Student-t and the value of 2 is considered, e = allowable error (10% allowable error is considered).  Using the above formula, the total number of sample households required for the HHSs was 331 (Table 1).
 
According to the Ethiopian Central Statistics Agency (undated publication), there are about 414 kebeles, including towns in the BMER, and the number of kebeles in each district varies. There are 67 kebeles in the four study districts of which 12 (18%) were considered as representative for the study. The 331 sample households were distributed randomly over the 12 kebeles proportional to the number of kebeles in the four districts (Table 1). However, during the actual visits, some households were found abandoned due to one or the other reason. Hence, the total number of households used in the survey was 321 rather than 331. Accordingly, 99, 77, 76 and 69 households were interviewed in Dodolla, Dolomena, Nansebo and Harena Buluk districts, respectively.
 
The HHSs were carried out by using a questionnaire developed for the purpose. The questionnaire covered issues pertaining to livelihood situation, annual income of households, their relation with forests, duration of households visit to forests to get products or non-carbon benefits, duration or number of days that livestock feeds in the forest within a year and other relevant information.
 
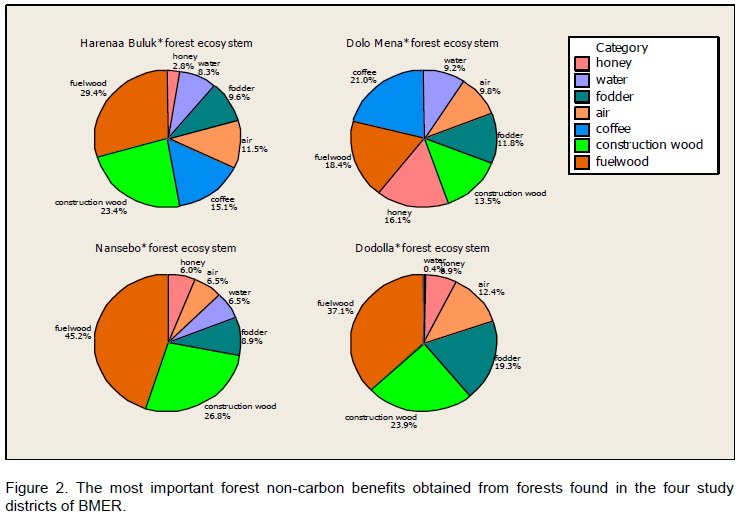
During the survey, two major research questions were addressed: (i) what are the most important forest products for local communities? (ii) What is the contribution of forests to the local economy? In this study, local economy refers to the sum of total income obtained by the households in the study area. Hence, the non-carbon benefits of the forests, such as water, watershed protection and other intangible non-carbon benefits were not considered. Values of forage obtained from the forests were estimated roughly.
 
The volume of forest products and kinds of non-carbon benefits obtained by each respondent household were assessed using semi structured questionnaires. Likewise, an attempt to assess revenue generated from crop production and livestock production was made. Each respondent was asked what non-carbon benefits he/she collects from the forest every day, every week or at any regular interval. The respondent also estimated the harvested or collected forest service and product into monetary value using the local market price.
 
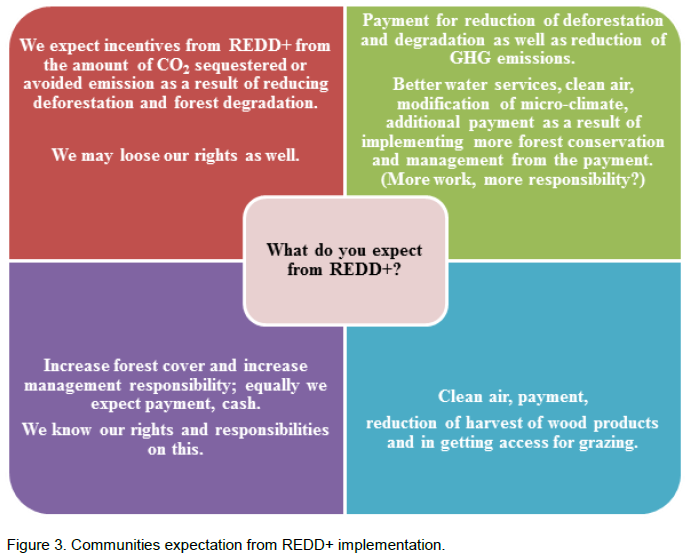
Focus group discussion: The focus group discussion (FGD) was conducted in addition to the HHS. The FGD was conducted in each sample kebele. A FGD has particular advantage to get qualitative data or information. The discussion focused on various issues concerning the environment, REDD+, crop production, livestock production, tangible forest resources and intangible forest resources, for which a list of lead topics/questions were prepared well ahead of the discussions. The discussion on environment focused on situations of forest, land, air, water and wildlife in the study areas or their vicinity. Past and present situations were addressed and the understanding of REDD+ of members of the FGD was captured. The discussion on production of major crops and livestock focused on types of crops grown and animals reared, type of inputs used, costs of production and input as well as market value per unit measurement. The discussion on tangible and intangible forest resources focused on products and non-carbon benefits that the groups get from the forest. Information on the most important forest products for market was gathered.
 
Data analyses
 
Species richness, diversity and evenness
 
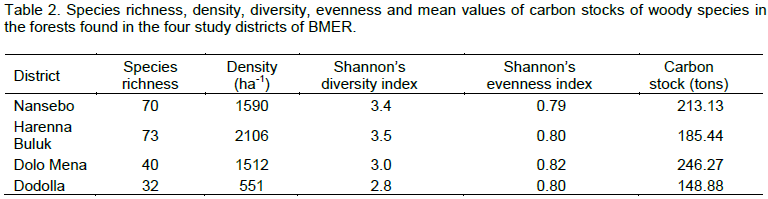
Species richnes of the study districts was determined from the total number of woody species recorded in each of the districts. It does not take into account the proportion and distribution of each species at the project sites (Neelo et al., 2013).
 
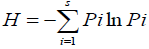
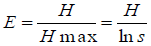
Diversity and evenness of all woody species in each district were determined using the Shannon-Wiener diversity index (H) and evenness (E) (Krebs, 1989; Magurran, 2004; Zerihun, 2012). The indices were computed using the following formulas:
 
 
Where H = Shannon-Wiener diversity index and Pi = the proportion of individuals found in the ith woody species:
 
 
Where E = evenness, Hmax is the maximum level of diversity possible within a given population, which equals ln (number of species);
 
Similarity in species composition
 
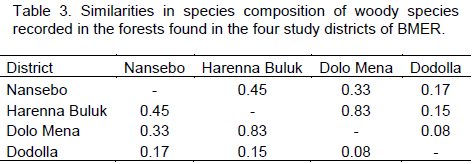
Jaccard’s similarity coefficient (J) (Krebs, 1989) was used to compute similarity in the composition of woody species between the study districts using the following formula:
 
 
Where, J = Jaccard’s similarity coefficient, C = the number of woody species common to both districts, A = the number of woody species present in one of the districts to be compared and B is the number of woody species present in the other district.
 
The values of J range between 0 and 1, 0 indicating complete dissimilarity and 1 indicating complete similarity in woody species composition (Krebs, 1989; Kent and Coker, 1992).
 
Density, frequency and dominance
 
Density was calculated by converting the total number of individuals of each species to equivalent numbers per hectare (absolute density), and as the percentage of the absolute density of each species divided by the total stem number of all species ha-1 (relative density). Frequency distribution of each species was determined from the number of plots in which the species was recorded (absolute frequency), and as a percentage (relative frequency) by dividing the absolute frequency of the species by the sum of the absolute frequencies of all the species. The absolute dominance of woody species with DBH > 2.5 cm was determined from summing the basal area (BA) of all individuals of a species. Relative dominance was calculated as the percentage of the BA of a species divided by the total BA of all species (Neelo et al., 2013, 2015).
 
Importance value index
 
The relative ecological importance of each woody species, commonly referred to as important value index (IVI), was determined by summing its relative frequency, relative density and relative dominance (Kent and Coker, 1992).
 
Carbon stock
 
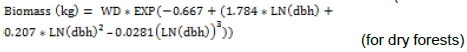
Carbon stock is the quantity of carbon in a given pool or pools per unit area (Pearson et al., 2005). In this study, above ground biomass of woody species encountered in the plots was considered as the carbon pool. Carbon stock was estimated using the DBH of all individuals of all woody species having DBH of 2 cm and above. For the estimation of carbon stock, the following algorithms, which are applicable for tropical moist and dry deciduous forests were used (Chave et al., 2005):


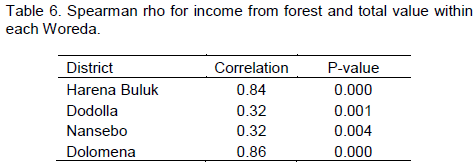
To see if there were any statistical significant differences among the mean values of carbon stock of the woody species in the forests found in the four study districts of BMER, the data were subjected to analysis of variance (ANOVA). Also, regression analysis was undertaken to test the relationships between the Shannon diversity indices and carbon stocks of woody species. Microsoft excel was used to organize data and MINITAB and SPSS 20 were used to analyze the data.
 
Household survey
 
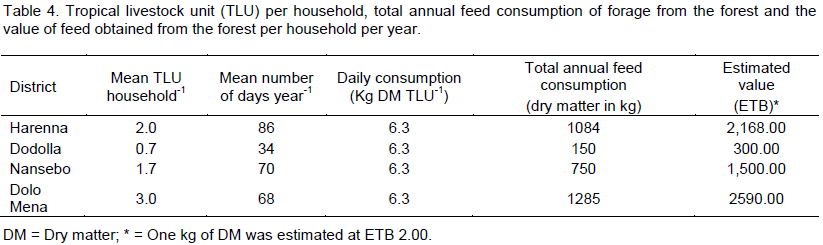
The number of livestock in the surveyed households that stay in the forest was estimated. The number was converted to tropical livestock unit (TLU). Then the TLU was multiplied by 6.25 kg to estimate the amount of forage consumed everyday by the livestock. Mean TLU per household was estimated and it varied from 0.678 to 3.011. This figure refers TLU relevant to forest grazing. Otherwise, Woody Biomass Inventory Strategic Planning Project (WBISPP, 2005) reported that TLU per farmer in Arsi and Bale Zones is 5.4 and 6.1, respectively.
 
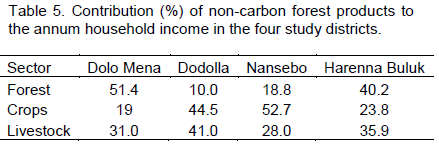
The forest non-carbon benefits considered are fuelwood, construction material, forage, forest coffee and forest honey. Local economy in this context is the aggregated economy of each household in the BMER. Therefore, the contribution of forest non-carbon benefits to each household can be aggregated to the local economy. In each surveyed household, the forest products and non-carbon benefits harvested annually were estimated. The volume harvested was valued using local market price that was given by the respondent. Similarly, production and transport cost of the products and non-carbon benefits were estimated based on the information from the respondent. Then, the difference was considered as net income to the household.
 
Forage consumption depends on the number of days the cattle stay in the forest. Total forage consumed can be estimated from these numbers of days. Then, the contribution of forests to livestock can be estimated. The households reported the number of days their cattle stay in the forest per year. The dates are grouped into the four districts and, then, ANOVA was undertaken.
 
To estimate contribution of non-carbon benefits to each household, a rapid appraisal of each product collected from the forest was carried out based on local market prices. Similar accounting was also made to crop and livestock production in the study districts.
 
Household respondents were also asked to identify the most important forest services. The responses were grouped in to two-way table and the analysis was conducted accordingly. To test the presence of differences in the use of forest non-carbon benefits by the different respondent households in the study areas, a Chi-square test was conducted. Chi-square test was used to determine whether there was a significant difference between the expected frequencies and the observed frequencies in one or more categories (Moore and McCabe, 2002). The share of forest contribution to each household was calculated as:
 
 
Where a = income generated from forest, b = income generated from crop production, c = income generated from livestock. Mean contribution of forest in each household per district was estimated. Confidence interval at 95% for each district was estimated using bootstrap in SPSS 20. 
 
Focus group discussion
 
Summaries from each FGD were compiled and synthesized to draw conclusions. To estimate the value of forage, getting recent data on price of forage from forest was not possible. Market price is available from 2007 studied by International Livestock Research Institute. This market price covers for teff [Eragrostis tef (Zucc.) Trotter] straw, barely/wheat straw, sorghum and hay. According to the study, the prices of one kilogram of teff straw, barley/wheat straw, sorghum and hay were Ethiopian Birr (ETB) 2.00, 0.6 to 1.00, 0.65 and 1.66, respectively in Sululta (Gebremedhin et al., 2009).


 RESULTS

Species richness, diversity and evenness
 
A total of 125 species of woody species, representing at least 45 families and 77 genera, were recorded from the four study districts. Of these, 70, 73, 40 and 32 were from Nansebo, Harenna Buluk, Dolo Mena and Dodolla, respectively. The Shannon diversity and evenness indices of the woody species ranged between 2.8 (Dodolla) to 3.5 (Harenna Buluk) and 0.79 (Nansebo) to 0.82 (Dolo Mena), respectively (Table 2).
 
Similarity in species composition
 
The highest and lowest similarities in woody species composition were exhibited by Haranna Buluk and Dolo Mena (0.83 = 83%), and Dodolla and Dolo Mena (0.08 = 8%), respectively (Table 3).


Density, frequency and dominance
 
The woody species had densities ranging from 550 (Dodolla) to 2106 (Harena Buluk) individuals ha-1 (Table 2).
 
The three densest woody species were  (in descending order of density) Vernonia rueppellii, Lepdotrichillia volkensii and Teclea nobilis in Nansebo, Maytenus arbutifolia, Cassipourea malosana and Lepdotrichillia volkensii in Haranna Buluk, Coffea arabica, Croton macrostachyus and Filicium decipiens in Delo Mena, and Rapanea simensis, Discopodium penninervum and Maytenus arbutifolia in Dodolla (Appendix 1).
 
The most frequent woody species were (in descending order of frequency) Croton macrostachyus, Teclea nobilis and Polyscias fulva in Nansebo, Croton macrostachyus, Ehretia cymosa and Vepris dainellii in Haranna Buluk, Celtis africana, Elaeodendron buchananii, Filicium decipiens, Olea capensis subsp. hochstetteri and Podocarpus falcatus in Delo Mena, and  Rapanea simensis, Hagenia abyssinica, Hypericum revolutum, Maytenus arbutifolia and Psydrax schimperiana in Dodolla (Appendix 1)
 
The three most dominant woody species were (in descending order of dominance) Syzygium guneense, Croton macrostachyus and Prunus africanum in Nansebo, Olea capensis subsp. hochstetteri, Croton macrostachyus and Vepris dainellii Haranna Buluk, Olea capensis subsp. hochstetteri, Podocarpus falcatus and Syzygium guneense in Dolo Mena, and Combretum molle, Juniperus procera and Maytenus arbutifolia in Dodolla (Appendix 1).
 
Importance value index
 
The three woody species with the highest IVI and, hence, the most ecologically important species, were (in descending order of density IVI) Syzygium guneense, Prunus africanum and Maesa lanceolata in Nsnsebo, Olea capensis subsp. hochstetteri, Croton macrostachyus and Vepris dainellii in Haranna Buluk, Coffea arabica, Olea capensis subsp. hochstetteri and Syzygium guneense in Dolo Mena, and Combretum molle, Rapanea simensis and Maytenus arbutifolia in Dodolla (Appendix 1).
 
Carbon stock and its relationship with Shannon diversity index
 
The carbon stock stored in the above-ground biomass of woody species in the forests found in the four study districts ranged between 148.88 (Dodolla) and 246.27
 
 
(Dolo Mena) tons ha-1 (Table 2). No statistically significant differences were found in the mean values of carbon stocks ha-1 in forests found in the four study districts [ANOVA (3, 24) = 1.34, P = 0.285]. However, Shannon index exhibited statistical difference among the districts [ANOVA (3, 24) = 3.93, P = 0.021]. Also, results of the regression analysis showed weak relationship between the Shannon diversity indices and carbon stocks of the woody species (R2 = 1.5), and the Pearson correlation was 0.268. The correlation coefficient with bootstrapped confidence interval at 95% was between - 0.061 and 0.539.
 
Non-carbon benefits Household survey
 
Various forest non-carbon benefits were mentioned by the respondent households (almost all), such as fuel wood, construction material, coffee, honey and grass (mostly). Also, a few respondent households (less than 13%) mentioned other benefits, such as medicinal plants, shade value, farm implements, rainfall and pure air. According to the respondent households, the most important forest non-carbon benefits were fuelwood, construction wood, coffee, air, fodder, water and honey (Figure 2). The forest service with the highest contributions in Nansebo (45.2%), Dodolla (37.1%) and Harenna Buluk (29.4%) was fuelwood while coffee had the highest contribution in Dolo Mena (21%). Honey, on the other hand, contributed the least in Dodolla (0.4%), Harenna Buluk (2.8%) and Nansebo (6%) while water contributed the least in Dolo Mena District (Figure 2). Construction material, fodder, water, honey were mentioned in all households. Air (clean or pure air) was also mentioned as an important service obtained from forest (contribution of 6.5 - 12.4%). There was evidence of an association between forest non-carbon benefits and districts (X2= 74.49, df = 18, P < 0.05).
 
 
The mean tropical livestock unit (TLU) exhibited statistically significant differences among the districts [ANOVA (3, 356) = 13.68, P = 0.000]. Dodolla (0.678) and Dolo Mena (3.011) districts had the smallest and highest TLU values, respectively (Table 4). The mean total number of days per year on which the livestock graze in the forests within the study districts ranged between 34 (Dodolla) and 86 (Harenna Buluk) days with an estimated daily consumption of 6.3 kg dry matter (DM) TLU-1. There was significance differences on the number of days the livestock stayed in the forest year-1 in the four study districts [ANOVA (3, 354) = 5.44, P = 0.001]. The total annual feed consumption of livestock from the forests in the study districts ranged between 150 (Dodolla) and 1,285 (Dolo Mena) kg DM with an estimated value of ETB300.00 and 2,590.00, respectively (Table 4).
 
 
Almost all the surveyed households confirmed that their means of living was from three sectors, namely forests, crops and livestock. The highest and least contributions of forests to the households were found in Dolo Mena (51.3%) and Dodolla (10.0%) districts (Table 5), respectively. Forests contributed 40.2% to the household income in Harenna Buluk District and 18.8% in Nansebo District. The result that Harenna Buluk and Dolo Mena are the highest corresponds with the results from the FGDs. Information obtained from the FGD on contribution of forest varied from 16.5% in Dodolla District to 47.4% in Harenna Buluk District. Contributions of forests to the households in the study area exhibited statistical differences [ANOVA (3, 317) = 6.78, P = 0.000]. There is very strong evidence that the four districts do not have the same mean value of forest contribution. Strong correlations were found between contributions of forests and the total household income per annum (Table 6).


Focus group discussion
 
Within the group, female respondents were more focused and to the point where they reflect their ideas on the non-carbon benefits. Fuelwood and water were the most important products for them unlike men. Free gifts from nature or their surrounding are fuelwood, water, soil, coffee, honey, grass, construction materials, medicinal plants, air, spring water, fruits, sand and stones. The relationship between land, water, forest and other environmental resources was well articulated by the participants of the FGD from the four districts. The concept of landscape for them works very well.
 
The life of local communities is supported by farming, livestock rearing, beekeeping as well as products and non-carbon benefits that they extract from the forests. Dolo Mena and Harenna Buluk are found within the BMER where forest coffee is well developed whereas Dodolla is located at the agro-ecological zone outside the coffee belt. Hence, the residents are more dependent on forest products of woody nature. Common to all districts are farming, livestock rearing, beekeeping and harvesting of wood. Trade contributes very little, for about 2% of the segments of the communities in Dodolla and Nansebo. Bamboo harvesting and trade were reported from Nansebo. From the FGD, it was learnt that at least one member of a household visits the forest every day to get a product, such as fuelwood.
 
The most important forest products that a household depends on most were ranked differently in the four study districts. For instance, coffee and honey were ranked in Dolo Mena and Harenna Buluk districts next to fuelwood. In Dodolla district, construction material, water/rain, air and honey were ranked next to fuelwood while water was ranked as number one in Nansebo district. Fuelwood, farm implements, construction materials, including climbers and fences, honey, grass, medicinal plants and furniture were prioritized from most important to least. In general, fuelwood  seems to be the most important forest  product that the communities harvest from the forest. Water and clean air were very well recognized as important non-carbon benefits from the forest ecosystem. The communities explained the relationship between forests and rainfall. Provision of grasses and thatching grasses from forest for their cattle and house construction, respectively, was discussed as well.
 
Harvesting, use and sell of medicinal plants were also discussed, but the groups confirmed that sell of medicinal plants is not done by everyone in the communities. It was indicated that only knowledgeable people harvest and trade medicinal plants. In line with this ranking, the most important products for markets were coffee, honey, medicinal plants and bamboo. In Dodolla district, fuelwood, construction material and honey were listed in addition.
 
It was noted from the FGD that a household sends not less than 10 cattle to the forest for 105 days per year in three of the four districts. Rapid population growth is reported to decrease the available grazing land, hence, use of crop residue as fodder has become a trend in Ethiopia (Mengistu, 2003) as well as the study area. In recent years, crop residue management has become an important intervention of climate-smart agriculture. Leaving crop residue in the field, rather than feeding it to cattle, protects the soil from erosion and limits weed growth throughout the year (IIRR and CTA, 2005). During FGD, the groups from Dodolla, Dolo Mena and Haranna Buluk confirmed that crop residue is used as feed for domestic animals; but, the group from Nansebo claimed that they are managing crop residue in the field and do not fed it to animals or burn it, unlike in the past. It was also noted during the discussion that the products are gathered by different members of the household. However, there was a consensus that most of the products are gathered by women. The interaction between women and the forest is very close.
 
Access to the forests is regulated by by-laws developed by the community-based organizations (CBOs). There is no prohibition of collecting the products and using non-carbon benefits from the forests as far as permit is secured from the executive committees of the CBOs.
 
When the groups were asked to explain the most pressing environmental problems, they mentioned coffee wilt disease, rust disease (in Dolo Mena), land degradation, drought as a result of rainfall variability, frost, too much rain, lack of water in the rivers and streams in some months, high and speedy wind uprooting trees, invasive species, such as ‘muja’ [Snowdenia polystachya (Fresen) Pilg.] and ‘ye-wef kollo’ (Lantana camara L.) (Dodolla), hailstorms, high speed wind with rainfall, which has not been the case in the old days (recent phenomena, according to the elders). 
 
The FGDs in all districts confirmed that the participants have heard and know about REDD+ (Figure 3). Their expectation is diverse, but they expressed that they expect payment for results they will achieve or have achieved. On the other hand, the participants in the FGD expressed their fear by emphasizing that during the implementation of REDD+, they may lose benefits, that is, the REDD+ initiatives may restrict them from obtaining the benefits that they used to get from the forests, for example, harvesting wood, improvement of coffee stands, etc. since their income is highly dependent on coffee production. In the management of forest coffee, clearing of land and reducing the regeneration and saplings of woody species may be necessary. They fear that implementation of REDD+ initiatives may not approve such activities.


 DISCUSSION

The number of woody species in four districts differed. Dodolla being dry tropical forest comprises less number of tree species than the others, and the highest number of woody species was recorded in Harena Buluk. Density of trees per hectare and Shannon diversity index were higher in Harena Buluk, whereas carbon stock was highest in Dolo Mena. But, the number of species registered in Dolo Mena is less than Harena Buluk and Nansebo. Evenness in Dolo Mena was higher than the rest of the three districts, and the highest similarity was found between the forests in Dolo Mena and Harena Buluk districts. Despite the fact that the number of species in Harena Buluk and Nansebo were higher, their similarity in woody species composition was only 45%. The lowest woody species similarity was observed between Dodolla and Harena Buluk.
 
Forest products and non-carbon benefits that are very important to the communities are highly associated with their livelihoods. Fuelwood was the most important forest benefit in three out of the four study districts. The weighted average of annual per capita energy consumption for all households in rural and urban Ethiopia is 1.16 m3s or 241 kg of oil equivalent (EFAP, 2004). Each household in the study area collects the specified amount freely. In the absence of fuelwood, it is clear that the rural community in the study area would not have other means for cooking, heating and lighting. However, coffee emerged as the most important benefit in the other district, namely Dolo Mena. In Dolo Mena, communities appreciate the contribution of forest coffee for their annual household income in addition to their daily consumption. In general, forests provide multiple benefits at local to global scales (Agrawal and Chhatre, 2009). In the context of this study, coffee and carbon can be considered as global benefits.
 
The contribution of forest to local economy is significant when compared with other incomes where non-timber forest products (NTFPs), such as forest coffee, honey and forage for livestock are extracted or harvested by the local people. Still in the absence of the above-mentioned NTFPs, the contribution from forest had positive correlation with total household income. Watson (2007) estimated that a household earns annual income of US$ 1,157.00 from crop production, US$ 228.00 from livestock, and US$ 407.00 from forest products in BMER. In her study, forest coffee was not a major force in income generation as most of her sampled kebeles were located at the upper limit of the coffee belt. Also, the income from livestock she considered was selling of live animal only. Unlike the analysis made by Agrawal and Chhatre (2009), this study indicated presence of relationship between carbon stock and benefits to the community in the case of Dodolla and Harena Buluk districts.
 
Monitoring of biodiversity in tropical forest areas, such as BMER, has significant importance. According to Woods-Schank (1990), extinction of a single plant species in tropical forests means the “demise of as many as 30 animals”. In forests that are managed by the community or through participatory forest management (PFM), more biodiversity implies effective efforts in carbon conservation because of other non-carbon benefits that come as source of livelihoods for communities. For instance, forest communities with more plant diversity provide more honey production that may be related to more pollen source with species having different flowering periods and, hence, continuous provision of pollen throughout the year for bee foraging. Another important benefit of plant diversity conservation, among many others, is decreasing susceptibility to diseases, unlike monoculture plantations. Higher plant diversity in natural forests exhibits good undergrowth and various vertical strata that makes the soil resilient to wind and rain or water disturbance. Soil disturbance may be minimal to affect stable soil carbon stock in this regard. In addition, conservation of biodiversity could ensure the sustainability of contributions of reducing emissions from deforestation and forest degradation (REDD+) to combat global climate change.
 
The objective of this study was not just to justify the importance of biodiversity. The major aim is to demonstrate that monitoring of biodiversity in addition to carbon stock is crucial for decision makers and practitioners in fighting against climate change and achieving the objectives of sustainable development. Hence, the study provides evidence that monitoring of biodiversity is possible while carbon is monitored.
 
Although weak statistical relationship between the Shannon diversity index and carbon stock was observed, the results from this study can inform the policy makers that maintaining plant diversity while also conserving/ enhancing carbon in the natural forests is possible/ important. Strassburg et al. (2010) made similar test whether species richness has correlation with carbon stock. Their study covered mammals, amphibians and bird species in the analysis of biodiversity. They have also considered both above- and below-ground biomass in the estimation of carbon stock. They found a strong association between carbon stocks and species richness. Conservation of biodiversity contributes to increased resilience of ecosystems, ecosystem stability and improved habitat (Bann, 1998).
 
One important achievement from the present study confirms that estimating plant diversity indices can be made while measuring the carbon stock without additional cost. The same data that are collected for the analysis of carbon stock can be used to estimate parameters important for the sustainable management of forests, such as basal area, density, frequency and important value index in addition to biodiversity indices.
 
Diverse forest ecosystems have diverse values for communities. This was explained by the communities and the non-carbon benefits range from shade during hot sunny days to products, such as honey, medicine and forage. Hence, forest management has to recognize and consider the needs of the local communities to sustain the flow of non-carbon benefits and products from the existing natural forests. REDD+ implementation needs to respond to the needs of the community in this regard. Though fulfilling international commitments are crucial in effecting REDD+ mechanisms, integration of all non-carbon benefits into the negotiation is more crucial for its (REDD+) success. Therefore, considering non-carbon benefits in the design and implementation of reducing emissions from deforestation and degradation (REDD+) is important. Otherwise, acceptance of REDD+ by local communities may be a challenge or completely lacking.
 
Future research needs to consider plant species less than 2 cm in diameter, seedlings, ferns and mosses. Furthermore, considering other pools in addition to above ground biomass may give different picture. 


 CONFLICT OF INTEREST

The authors did not declare any conflict of interest.


 ACKNOWLEDGEMENTS

The authors would like to acknowledge the Royal Norwegian Embassy in Addis Ababa for the financial and other material support during the collection of data. We thank FARM-Africa for allowing us to use their datasets. We are also grateful to staff members of FARM-Africa/SOS Sahel at the BMER for their relentless support during data collection. We are indebted to the local people who were willing to be interviewed. Without their willingness, this research would not have been possible.


 REFERENCES

Agrawal A, Chhatre A (2009). Trade-offs and synergies between carbon storage and livelihood benefits from forest commons. (E. Ostrom, Ed.) PNAS 17667-17670.
 
Bann C (1998). The Economic Valuation of Tropical Forest Land Use Options: A Manual for Researchers. Singapore.
 
 
Bryan BA (2013). Incentives, land use, and ecosystem Non-Carbon Benefits: Synthesizing complex linkages. Elsevier, pp. 124-134.
 
 
Chave J, Andal, C, Brown S, Cairns MA, Chambers JQ, Eamus D, Yamakura T (2005). Tree allometry and improved estimation of carbon stocks and balance in tropical forests. Springer -Verlag.
Crossref
 
 
Edwards S, Mesfin T, Hedberg I (eds.) (1995). Flora of Ethiopia and Eriterea, National Herbarium, Addis Ababa University, Addis Ababa and University of Systematic Botany, Uppsala University, Uppsala. 2:2.
 
 
Edwards S, Mesfin T, Sebsebe D, Hedberg I (eds.) (2000). Flora of Ethiopia and Eriterea, National Herbarium, Addis Ababa University, Addis Ababa and University of Systematic Botany, Uppsala University, Uppsala. 2: 1.
 
 
Edwards S, Sebsebe D, Hedberg I (eds.) (1997). Flora of Ethiopia and Eriterea, National Herbarium, Addis Ababa University, Addis Ababa and University of Systematic Botany, Uppsala University, Uppsala. Vol. 6. .
 
 
FAO (2001). How Forests can reduce Poverty. Rome: FAO.
 
 
FARM Africa (2008). Bale Mountains Eco-REgion Sustainable Development Plan: Report Phase I and II planning Workshops. Addis Ababa: FARM Africa.
 
 
Friis I (1992). Forests & Forest Trees of Northeast Tropical Africa. Birmingham: HMSO.
 
 
Gebremedhin B, Hirpa A, Berhe K (2009). improving productivity and market success of Ethiopian farmers project (IPMS). Addis Ababa: International Livestock Research Institute (ILRI).
 
 
Groom B, Palmer C (2012). REDD+ and rural livelihoods. Elsevier pp. 42-52.
Crossref
 
 
Hedberg I, Edwards S (eds.) (1989). Flora of Ethiopia, Addis Ababa University, Addis Ababa and Department of Systematic Botany. Uppsala University, Uppsala. Vol. 3.
 
 
Hedberg I, Edwards S (eds.) (1995). Flora of Ethiopia and Eritrea, Addis Ababa University, Addis Ababa and Department of Systematic Botany. Uppsala University, Uppsala. Vol. 7.
 
 
Hedberg I, Ensermu K, Edwards S, Sebsebe D, Persson E (eds.) (2006). Flora of Ethiopia and Eritrea, Addis Ababa University, Addis Ababa and Department of Systematic Botany. Uppsala University, Uppsala. Vol. 5.
 
 
Hedberg I, Friis I, Edwards S (eds.) (2004). Flora of Ethiopia and Eritrea, Addis Ababa University, Addis Ababa and Department of Systematic Botany. Uppsala University, Uppsala. 4(2).
 
 
Hedberg I, Edwards S, Sileshi N (eds.) (2003). Flora of Ethiopia and Eritrea, Addis Ababa University, Addis Ababa and Department of Systematic Botany. Uppsala University, Uppsala. 4(1). IIRR and CTA (2005). Conservation Agriculture : A Manual for Farmers and Extention Wokers in Africa. Nairobi: International Institute of Rural Reconstruction, Nairobi; African Conservation Tillage Network, Nairobi.
 
 
Jaung W, Bae JS (2012). Evaluating Socio-economic equity of REDD+ in a rights-based apporach: Rapid equity appraisal matrix. ELSEVIER, 1-12.
 
 
Kent M, Coker P (1992). Vegetation Description and Analysis. A Practical Approach. England: John Wiley and Sons Ltd.
 
 
Krebs CJ (1989). Ecological Methodology. New York: Harper Collins Publishers.
 
 
Lang GM, Hassan R, Hamilton K (2003). Environmental Accounting in Action: Case Studies from Southern Africa. Chltenham: Edward Elgar Publishing Limitted.
 
 
Loetsch F, Haller K (1973). Forest Inventory (Vol. I & II). Munchen: BLV.
 
 
Magurran AE (2004). Measuring Biological Diversity. MA: Blackwell Publishing.
 
 
McDermott CL, Coad L, Helfgott A, Schroeder H (2012). Operationalizing Social Safeguards in REDD+: actors, Interests and Ideas. Elsevier pp. 63-72.
Crossref
 
 
Mengistu A (2003). Country Pasture/Forage Resources Profile. FAO. Retrieved January 10, 2015, from FAO: http://www.fao.org/ag/AGP/AGPC/doc/counprof/ethiopia/ethiopia.htm#5.
 
 
Moore DS, McCabe GP (2002). Introduction to the Practice of Statistics. New York: W.H. Freeman and Company.
 
 
Neelo J, Teketay D, Masamba W, Kashe K (2013). Diversity, Population Structure and Regeneration Status of Woody Species in Dry Woodlands Adjacent to Molapo Farms in Northern Botswana. Open J. For. 3:138-151.
Crossref
 
 
Neelo J, Kashe K, Teketay D, Masamba W (2015). Ethnobotanical survey of woody plants in Shorobe and Xobe villages, Northwest Region of Botswana. Ethnobotanical Research Applications 5: 313-328.
 
 
Nune S, Menale K, Mungatana E (2013). Forest Resource Accounts for Ethiopia. In Hassan RM, Mungatana ED (Eds.), Implementing Environmental Accounts, Springer 28: 103-142.
Crossref
 
 
OFWE, FARM Africa, SOS Sahel Ethiopia (2014). Bale Mountains Eco-Region Reduction of Emission from Deforestation and Forest Degradation (REDD+) Project-Ethiopia. Addis Ababa: FARM Africa and SOS Sahel.
 
 
Pearson T, Walker S, Brown S (2005). Sourcebook for Land Use, Land-Use Change and Forestry Projects. Winrock International. Retrieved March 7, 2015, from http://www.katoombagroup.org/documents/cds/uganda_2011/Ag%20and%20Land%20Use%20Management/Sourcebook%20for%20LULUCF%20Projects.pdf
 
 
Strassburg BB, Kelly A, Balmford A, Davies RG, Gibbs HK, Lovett A, Rodrigues AS (2010). Global Congruence of Carbon Storage and Biodiversity in Terrestrial Ecosystems. Wiley Periodicals, Inc. Retrieved from http://onlinelibrary.wiley.com/doi/10.111/j.1755-263x.2009.00092.x/epdf
Crossref
 
 
UNFCCC (2011). Report of the Conference of the Parties on its sixteenth session, held in Cancun from 29 November to 10 December 2010: Addendum Part Two: Action taken by the Conference of the Parties at its sixteenth session. UNFCCC. Retrieved May 14, 2014, from http://unfccc.int/resource/docs/2010/cop16/eng/07a01.pdf#page=2
 
 
Vijge MJ, Gupta A (2014). Framing REDD+ in India: Carbonizing and centralizing Indian Forest Governance. ELSEVIER. pp. 17-27.
 
 
WBISPP (2001). Report of Natural Grazing Lands and Livestock Feed Resources: Oromia Regional State. Addis Ababa: MoA.
 
 
WBISPP (2005). WBISPP. A National Strategic Plan for the Biomass Energy Sector: Final Report. Addis Ababa: MoA,
 
 
Woods-Schank GG (1990). Protecting the Tropical Forests A high Priority International Task. Bonn: Bonner Universitats -Buckdruckererei, 5300 Bonn.1.
 
 
Yitebitu M, Eshetu Z, Sisay N (2010). Ethiopian Forest Resources: Current Status and Future Managment Options in view of Access to Carbon Finance. Addis Ababa: UNDP.
 
 
Zerihun W (2012). Environmental and Ecological Data Analysis. Lap Lambert Academic Publishing.


 APPENDIX


          */?>