Full Length Research Paper

ABSTRACT
INTRODUCTION
Chemistry of groundwater is an important factor determining its use. Interaction of groundwater with aquifer minerals through which it flows greatly controls the groundwater chemistry. Hydrogeochemical processes that are responsible for altering the chemical composition of groundwater vary with respect to space and time. The hydrogeochemical processes of the groundwater system help to obtain an insight into the contributions of rock/soil-water interaction and anthropogenic influences on groundwater. These geochemical processes are responsible for the spatiotemporal variations in groundwater chemistry (Matthess, 1982; Michard, 1989; Kumar et al., 2006; Swarna Latha and Nageswara Rao, 2011; Kuldip-Singh et al., 2011). Groundwater chemistry, in turn, depends on a number of factors, such as general geology, degree of chemical weathering of the various rock types, quality of recharge water and inputs from sources other than water-rock interaction (Schuh et al., 1997; Kuldip-Singh et al., 2011). Such factors and their interactions result in a various groundwater quality.
In the Souf valley, Low Septentrional Sahara, groundwater is the only source for domestic purposes. Due to rapid urbanization, extension of irrigation, domestic needs of the people has increased tremendously in recent years (D.H.W., 2011). Although some studies have been reported on chemical quality and hydrogeochemical processes operated in other regions of Low Septenrtional Sahara, very little work has been done in the Souf valley. Groundwater is being continuously exploited in the region to meet the growing demand for water supply and irrigation, which is aggravated due to insufficiency of surface water, it is essential to know the hydrogeochemical processes that occur in the aquifer system. Therefore, the main objective of this study is to characterize the aquifer waters and identify the major hydrogeochemical processes that are responsible for groundwater chemistry in the study region.
MATERIALS AND METHODS
The Souf valley is located between the longitudes 6°40' – 6°70' East and the latitudes 33° 41'-33°10' North and covers an area of ??80 000 km2. It is limited in the east by the Tunisian frontier, in the west by the dorsal of the M'Zab, in the south by the extension of Great Oriental Erg and by Choots region (Melrhir and Merouane) in the north (Figure 1). This area is characterised by a hyper arid type climate. The mean annual temperature is 22°C (average of: July 34°C and January 11°C). The diurnal variations temperatures are important in any season and the evapotranspiration potential exceeds 1,700 mm year-1. The region is characterized by low rainfall; the average annual rainfall is about 70 mm (located between 60 and 80 mm isohyets). January is the wettest month (approximately 15 mm) and July the driest (less than one mm in average) (D.H.W., 2011). It also forms an independent unit that constitutes one of the transition zones between the Saharan platform and the pre-Saharan through. It is characterized by its extended dunes with a contrasted relief and by its nearly closed local depression (Nesson, 1975).

This valley, presenting a synclinal structure, is filled by thick Meso-cenozoic sedimentary formations, often discordant, essentially composed of detrital, carbonate or evaporates deposits and based on a pre-Cambrian folded basement. Also, the greater part of these sedimentary formations is covered with sand dunes and pebbly or gravely erg thus forming the eastern part of "Great Oriental Erg". This erg, with a tormented relief, rests on a quaternary formation consisting of several tens of meters of compact and homogeneous eolian sand. This formation, which contains the water-table, sees its substratum descend to the north; its waters with those of surface runoff are spreading in the lagoons of salty soil where it evaporates depositing superficial salt crust (Nesson, 1975; Busson, 1970).
The lithostratigraphy of the study region is summarized in Figure 2: from the Cretaceous to the Eocene, successively consists of marly clays, limestone, gypsiferous marly clays and marls with lagunal facies (gypsum, anhydrid, salts and dolomitic passages) on the top. This set is surmounted by the Neogene composed of conglomerates and gravel of the Oligocene and by subhorizontal red sandy clays with gypsiferous sandstones lentils of the Mio-Pliocene. The whole is surmounted by one layer of fine sands with limestone crusts of the Plio-Quaternary (Cornet, 1961; Busson, 1970; Giraud, 1978). These sands, forming the potential aquifer, are constituted of 90% of quartz grains, limestone concretions, gypsum and silicates (Feldspars and silicate accessories: epidote zircon, rutile, tourmaline and garnet) (Dervierux, 1957; Nesson, 1975).

From the hydrogeological viewpoint, in the study area, as throughout the Lower Sahara, geomorphology and disposition of sediments in the basin have favoured the infiltration and subterranean circulation of water precipitated on outcrops with concentric halos of periphery. The alternation of permeable and impermeable deposits assured them charging as they flowed toward the depressed parts. These particularly favorable paleogeographic and geological conditions are the cause of the underground aquifers formation during ancient rainy periods (Nesson, 1975). In this area characterized by a marked aridity and limited surface flows, it is these groundwaters that make its originality, because independence of present of climatic fluctuations, except the saturation level, they form several aquifers regrouped into two major groups. From low to top, one finds: the intercalary continental aquifer (I.C), the terminal continental aquifers (T.C.) including limestones aquifer (Senonian-Eocene), sand aquifer (Mio-Pliocene) and Quaternary aquifer (water table) (Nesson, 1975; Ould, 2005).
Groundwater sampling and analyses
Samples of groundwater from sites in the study area were collected in January-March 2011. In situ parameters such as pH, electrical conductivity (EC), temperature and alkalinity (HCO3) were measured in the field. Samples for major chemical analyses were filtered and collected in plastic bottles. Chemical analyses were done by Hydraulic Direction of Oued Souf's Willaya. The geographical position of analyzed water points is shown in Figure 3.
.png)
RESULTS AND DISCUSSION
Groundwater chemistry
The statistical parameters (mean, standard deviation, variation coefficient, maximum-minimum) have been calculated for each of the physico-chemical variable and are given in Table 1. Except the carbonates and the pH which show acceptable values, all measured parameters have mean and extreme values that exceed largely the limits of the admitted portability norms.
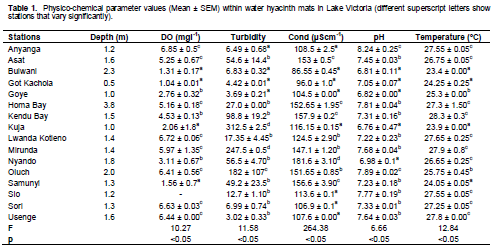
The total dissolved solids (TDS) ranged from 2361 to 14780 mg/l with a mean of 4277 mg/l. The electrical conductivity (EC) ranged from 3100 to 20000 ms/cm with a mean of 5765 ms/cm. Groundwater was found to be alkaline in nature with an average pH value of 7.6. The relative abundance of major ions was Na+ > Mg2+ > Ca2+ > K+ for cations and Cl- > SO42- HCO3- > NO3- for anions. The variability of elements in solution, expressed by the variation coefficient or by standard deviation, is very important for the majority of the analyzed parameters (Table 1) and indicates that those waters present a large difference of chemical quality from one point to another. However the spatial variability of temperature (m: 22.1, cv: 3.66%) and pH (m: 7.6, CV: 3.80%) remains low. Finally, one notes that the highest variation coefficient, corresponding to potassium variation, cannot be considered because it is essentially due to the high content of the 18 well (k:909 mg/l) whereas for the other wells, the mean is 23.5 mg/l with a variation coefficient of 54%, this can be explained by accentuated saltiness of the 18 well.
Characterisation of hydrogeochemical data
To identify and classify the different waters of the study area, hydrochemical data were processed and projected on the hydrochemical diagrams that aim to facilitate the interpretation of evolutionary trends. They are particularly in groundwater systems, when they are interpreted in conjunction with distribution maps and hydrochemical sections. An overall characterisation of hydrogeochemical data can be possible by knowing the hydrochemical facies of water, generally known as water type, using the ionic composition and various plots.
Ionic formula classification
The ionic formula calculation (Table 2), where the elements relative concentrations are expressed in % with regard to the sum of the same sign elements concentrations, reveals highly variable chemical characteristics. Thus, some of those waters present a magnesian or sulfated calcic facies secondarily chlorided sodic whereas others have a sodic sulfated facies secondarily magnesian sulfated or clearly chlorided sodic.
.png)
Piper classification
Results of the projection on the piper diagram (1944) (Figure 4) show that for cations, the waters of different wells are grouped essentially in two main families «A» and «B». The «A» family's waters are sodic with the high concentrations in magnesium, while those of the family «B» present a mixed facies with relatively high magnesium contents except of well 24 that presents a magnesian facies.
.png)
For the anions, the distinction between the two families is not clear, in fact, one notes a reversed evolution of SO4 in comparision with (Cl+NO3) of «A» toward «B» (SO4 , (Cl +CO3)¯ or inversely). For the whole cations-anions, the distinction between the two families is distinctly clear however; one records an advanced natural evolution of these waters toward a sodic sulfated facies or sodic and potassic chlorided facies (evolution of «B» toward «A»).
Identification of hydrogeochemical process
Reactions between groundwater and aquifer minerals have a significant role on water quality, which are also useful to understand the genesis of groundwater. The hydrogeochemical data are subjected to various conventional graphical plots to identify the hydrogeo-chemical processes operating in aquifer region of study area. Some of the possible identified processes are explained below.
Weathering and dissolution
Calcium, magnesium and sodium are the dominant cations present in groundwater in this region. Similarly, chloride and sulfate are also present in important amounts. The limestone, gypsum and silicate are the major sources for mineralization in the area. The ions from these sources might have been dissolved and added to the groundwater system by leaching and mixing processes. However, minerals weathering and dissolution can be suggested that a simple plot of Ca2+ + Mg2+ versus SO42- + HCO3- could provide information on the relative importance of the main minerals contributing to groundwater mineralization. In Ca2+ + Mg2+ versus SO4 2- + HCO3- (Figure 5a), the points falling along the equiline (Ca2+ + Mg2+ = SO4 2- + HCO3-) suggest that these ions have resulted from weathering of carbonates and silicates (Datta and Tyagi, 1996; Rajmohan and Elango, 2004; Kuldip-Singh et al., 2011). Most of the points in this study fall around the 1:1 line, suggesting that carbonate and silicate weathering are the major hydrogeochemical process operating in this region.
.png)
On the other side, if the ratio Ca/Mg = 1, dissolution of dolomite should occur, whereas a higher ratio is indicative of greater calcite contribution (Maya and Loucks, 1995). Molar ratio of Ca/ Mg>2 indicates the dissolution of silicate minerals, which contribute calcium and magnesium to groundwater (Katz et al., 1998). The plot of Ca/Mg ratio of the groundwater samples of the study area reveals that the dominant process is the dissolution of carbonate that present in the calcareous concretions (Figure 5b). The most of the groundwater samples found to be below 1 ratio indicate the calcite weathering prominent process. However, samples lie near the 1 ratio line revealing dolomite dissolutions and the samples lie above the ratio line 2 indicating the effect of silicate minerals. Presence of carbonates and silicates in the sand deposits could favor the weathering process.
.png)
In silicate, if the calcium and bicarbonate in ground-water solely originated from calcite, the equivalent ratio of dissolved Ca and HCO3 in the groundwater is 1:2, whereas from dolomite weathering, it is 1:4 (Garrels and Mackenzie, 1971). Similarly, if the calcium and sulphate in groundwater derived from dissolution of gypsum or anhydrite, then the Ca/SO4 ratio is almost 1:1 (Das and Kaur, 2001). In Ca versus HCO3 - scatter diagram (Figure 6a), only two groundwater samples fall on the 1:2 line and most of them lie above the 1:2 equiline, indicating the contribution of calcite weathering on groundwater chemistry. Moreover, in Ca versus SO4 diagram (Figures 6b and 7a), there are all distributions of the samples above the 1:1 equiline. This shows the dominance of carbonate weathering rather than silicate (Garrels and Mackenzie, 1971). Furthermore, it indicates the presence of dissolution of gypsum in the study area. Therefore, the abundance of Ca + Mg in groundwater can be attributed mainly to gypsum dissolution and carbonate weathering.
.png)
Also, silicate weathering can be understood by estimating the ratio between Na+ + K+ and total cations (TZ+). The relationship between Na+ + K+ and TZ+ of the study area revealed that most of the samples are plotted above the Na+ K+ = 0.5TZ+ line (Figure 7b). This observation indicates the involvement of silicate weathering in the geochemical processes, which contributes mainly sodium and potassium ions to the groundwater (Stallard and Edmond, 1983; Sarin et al., 1989; Kuldip-Singh et al., 2011). Moreover, the (Ca2+ + Mg2+)/HCO3- ratio of more than 3 of all samples suggests that silicate weathering occurs in this region in addition to the carbonate dissolution.
Ion exchange
The chemical reactions in which ion exchange between the groundwater and aquifer environment occurs during residence or travel can be understood by studying the Chloro Alkaline Indices I and II:
Ratio I: Cl / (Cl+HCO3):
Ratio II: (Na + K) / (Na + K + Ca)
Where, the concentration of ions is in meq/l.
When there is an exchange between calcium or magnesium in the groundwater with sodium and potassium in the aquifer material, both above indices are negative, and if there is a reverse ion exchange, then both indices will be positive (Schoeller, 1965, 1977). The values indicating most of the samples show negative and some wells show positive in the study area (Figure 8). This observation indicates that the normal ion exchange is the dominant process in the groundwater, whereas reverse ion exchange is also observed in some samples.
.png)
When ion exchange is a significant geochemical process for controlling the composition of groundwater, the relationship between (Ca2+ + Mg2+) versus (SO42- + HCO3-) diagram illustrates ion exchange should be linear with a slope of 1.0 (Fisher and Mulican, 1997). The plot of (Ca2+ + Mg2+) versus (SO42- + HCO3-) (Figure 5) shows that all the groundwater samples of Souf valley falls left to the 1:1 line (Figure 5a) which indicate that ion exchange tends to be dominant over reverse ion exchange process in the study area.
Evaporation
The study region experiences dry and arid climatic condition, evaporation may also contribute in water chemistry. Gibbs (1970) suggested that a simple plot of TDS versus the weight ratio of Na+/(Na+ + Ca2+) could provide information on the relative importance of the major natural mechanisms controlling groundwater chemistry. From the Gibbs plot (Figure 9a); the dominant process determining the water composition is evaporation and rock/soil-water interaction. Evaporation of surface water and moisture in the unsaturated zone is the main process in the evolvement of groundwater chemical composition. Evaporation concentrates the remaining water and led to precipitation and deposition of evaporates that are eventually leached into the saturated zone. This is expected, as evaporation greatly increases the concentration of ions formed by chemical weathering, leading to high salinity and TDS. This is clearly reflected in the Gibbs plot, which indicates a trend towards evaporations and rock dominated dissolution.
Furthermore, sodium versus chloride ratio can be used to identify the evaporation process in groundwater. Evaporation will increase the concentration of total dissolved solids in groundwater; and the Na/Cl ratio remains the same, and it is one of the good indicative factors of evaporation. If evaporation is the dominant process, Na/Cl ratio should be constant when EC rises. Hence, the plot of Na/Cl versus EC would give a horizontal line, which would then be an effective indicator of concentration by evaporation and evapotranspiration (Jankowski and Acworth, 1997; Kuldip-Singh et al., 2011). The EC versus Na/Cl diagram of the groundwater samples (Figure 9b) shows that one trend line is horizontal indicating that evaporation is the major process. The other trend line is inclined revealing that evaporation may not be the major geochemical process controlling the chemistry of groundwater or dissolution or ion exchange reaction dominating over evaporation.
Spatial repartition of waters
The geographical distribution of the two water types «A» and «B» on the study area is presented in Figure 3. The «A» water type include the well water situated to the center of the structural basin (cuvette), the latter constitutes the main hall of groundwater flow toward the Chotts, by against, the wells of «B» water type located on the basin flanks. According to this spatial distribution, the survey zone has been subdivided in three domains in order to specify the existing relations between the water's chemical quality and the aquifer lithological nature in its natural context.
In every domain, the physico-chemistry has been characterized by the following characteristic ratio: rMg/rCa, rNa+K/rCa, rSO4/rCl, rCl-Na/rCl and the S.A.R (Tables 3 and 4) calculated from means of the different ionic elements in every domain. These characteristic ratios, with others, constitute a good indicator of existing relations between the aquiferous lithology and the underground water chemical composition that circulate there (Back and Hanshaw, 1970; William et al., 1999; Dazy and Razack, 1989; Nkotagu, 1996).
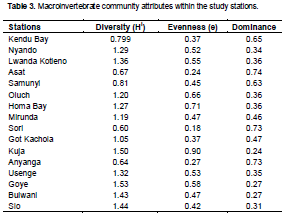
The domain I corresponds to eastern flank of the Souf valley. It is constituted sands with gypsum or sandy clays intercalations. All studied wells belong to the family «B» with a predominance of sulphates on chlorides (rSO4 /rCl =2.4), the magnesium on the calcium (rMg / rCa = 1.31) and a ratio (alkaline / calcium) less than 1: (rNa+K / rCa = 0.73).
In general, the mineralization is important and increases grossly from the east to the west, therefore in the flow direction (Figure 3). Means of conductivities and dry residues do not reveal any significant detail and are comparable to those of the other areas of the Low Septentrional Sahara. The pH is nearly constant (7.5 to 7.7).
The importance of SO4, Cl and HCO3 in waters can be explained by the respective presence of gypsum, salts and limestone in the sandy matrix crossing of these waters which make these minerals in solution. For the magnesium, it can be only the product of the silicate weathering present in the matrix (garnets and tourmalines) because this phenomenon is very widespread in the (sub) surface conditions (Schoeller, 1967, 1977; Gibbs, 1970; Petalas and Diamantis, 1999). However, if the presence of the calcium is explained by the dissolution of gypsum and limestone and partly by the silicate weathering; its deficit compared to (SO42+ + HCO3) suggests an exchange of basis (Ca++---- Mg++) between the liquid phase charged in Mg++ and the calcic solids present in the aquifer matrix (Back and Hanshaw, 1970).
Domain II occupies the central part of the basin. It is constituted of calcariferous sand with gypsum and gypseous clays in the basis. All wells' waters belong to the family «A». Waters of this domain, as compared to those of the previous domain, has an anionic abundance characterized by the predominance of chlorides on sulphates (rSO4/rCl = 0.57) with higher average saltiness (the conductivity and the dry residual are 2.5 times more important) and a comparable pH. The ratios (Mg/Ca) and (alkaline/Ca) are highest in the study zone (3.05 and 7.21, respectively). The high salinity in this domain is, presumably, owed to several complementary hydro-geochemical processes that are summarized in the following points:
1. Weathering and dissolution of salts, gypsum, carbonate and silicate, leaching on the basin flanks and the elements concentration in the depressive areas as a consequence of slowdown in flow (increasing mineralisation toward the center on the two flanks of the basin).
2. The dissolution, in situ of sulphates, salts and carbonates and the exchange of sodium with potassium contained in clays.
3. The mixture of the saturation level waters with the waters of the underlying aquifers, mainly, those of the Mio-Pliocene; mixture waters confirmed by isotope study (D.H.W, 1997; Guendouz et al., 2003).
In this domain, the reduction of the rSO4/rCl ratio is related to the solubility of salts (NaCl) and to the degree of water saturation in these elements (Kirchmer, 1983). Because waters are first charged with sulphates during their underground trail, then the chlorides (NaCl) take place in the vicinity of saturation, that iss why these waters show their rate of chlorides increasing while going toward the central zone.
The domain III is located in the West flank of the basin. It is constituted, especially, of gypseous sands with clay intercalations. All waters in this area belong to the family «B» with predominance of sulphates on chlorides and the magnesium on the calcium as for the domain I, but with a ratio (alkaline/calcium) nearly equal to 1 (rNa+K/rCa = 1.08). The global mineralisation is the weakest in the region and it increases from west toward East, always in the direction of flow. However, one records an increase of sulphates, chlorides and sodium charges. The pH, here is slightly higher with regards to the two other domains. The resemblance of chemical facies of these waters and their global context (aquifer lithology and structure) with those of the domain I, induce us to conclude that responsible processes of water salinity in the two domains are comparable if not the same.
Globaly, contents in nitrates are high in the entire region and exceed the admitted norms (in the three domains, means are two times the norm). They are especially, the consequence of the organic matter nitrification contained in worn-out water discharges. In this way, these waters are mixed with those of the water table because of the absence of a purification network in several localities of the region and the absence of an exutory outside of the aquifer system. This origin is confirmed by a bacteriological survey realised par DHW d'El Oued (D.H.W., 1997). We noted that this phenomenon is largely spilled in the Saharan regions and it has been signalled in several countries of Africa (Nesson, 1975; Nkotagu, 1996). The S.A.R is weak for both I and II domains, whereas it exceeds the value of 10 (19.92) in the domain III. This indicates that waters of this last domain are of very poor quality and then cannot be used even in agriculture.
Finally, ratio rCl-Na/rCl is positive for the domain I, whereas it is negative for the domains II and III. This is closely linked to the sodium big mobility. It indicates that the domain I, probably, constitutes a refill zone of the saturation level, potentially more favorable than the domain III, and that waters would have already done an important course in the aquiferous system in the domain III; which explains the relative importance of SO4, Cl and Na in domain III with regard to domain I (Dadi et al., 1997; Dazy and Razack, 1989).
Global scenario of waters mineralization
By dissolution of salts, gypsums and limestones or by weathering of carbonate and silicate, waters are charged with SO42-, Cl-, Na- and Ca2+. At the same time by weathering of silicate accessories, they are charged with Mg2+. While crossing, during their underground circulation, the carbonate concretions or the clayey intercalations are restrained in the sandy matrix forming the aquifer; they can exchange a part of Mg++ transported by the calcium contained in the calcic solids (late dolomitization phenomenon). They can also exchange a part of Na+ by potassium restrained in clays (these basic ion exchanges have consequence on the impoverishment in Ca++ and the enrichment in K+ of these waters). In continuing their progresses in both the western and eastern flank of the basin (domain I and III), they are charged progressively because of the favorable conditions to the ions migration. While arriving at the center (domain II), they are either slowed or braked by the tormented relief of the clayey substratum of the aquifer. They can also be braked by the presence of impermeable limits which encourages, more and more, the concentration of ions especially in the depressive places; added to this, dissolutions or ion exchange that can be produced on site, or possible miscellanies of waters. In this way, saturation level waters observe their saltiness increasing suddenly.
This global scenario of mineralisation waters of the groundwater table in Souf valley is reinforced by distribution of the waters chemistry and their spatiotemporal evolution (Figure 3). This script makes evident the roles of different natural parameters, (intern and external) linked to the aquiferous system, in the acquirement of saltiness. It shows the hydro-geochemical processes in question and can also predict water chemism, probably evolution of the water table in this region.
CONCLUSION
Ground waters in the Souf valley are highly saline (2361- 14780 mg/L TDS) and the hardness is a common characteristic feature of groundwater of this aquifer. Magnesium, calcium and sodium are the dominant cations and sulfates and chlorides are the dominant anions. They present two main waters families with geochemical evolution of facies whose chemistry is strongly influenced by different parameters linked to the aquifer system.
Dissolution, rock weathering, ion exchange, mixing and nitrification of the organic matter are the main hydrogeo-chemical processes of waters mineralization. The conjugated action of the different mineralisation processes as well as their combinations had accentuated the salinity of these waters. Their identification allowed a better interrelationship between the different present ions. The partial analysis (by domain) of the aquifer in its natural context helped us in the explanation of the global saltiness evolution; since a global scenario of mineraliza-tion shows clearly the roles of the different parameters of aquifer system specifying the processes interfering in the acquirement of global waters saltiness and can predict their probable evolution.
In this region deprived of treatment means and softening, when choosing captive fields and during implantation of drilling of potable water supply, these results would guide decision makers in selecting the right sectors containing less ionised groundwater.
CONFLICT OF INTERESTS
The authors did not declare any conflict of interest.
ACKNOWLEDGEMENT
The authors wish to thank the staffs of DHW Oued Souf for their help and collaboration.
REFERENCES
|
|||||||||||||||||||||||||||||||||||||||||||||||||||||||||||||||||||||||||||||||||||||||||||||||||||||||||||||||||||||||||||||||||||||||||||||||||||||||||||||||||||||||||||||||||||||||||||||||||||||||||||||||||||||||||||||||||||||||||||||||||||||||||||||||||||||||||||||||||||||||||||||||||||||||||||||||||||||||||||||||||||||||||||
Copyright © 2024 Author(s) retain the copyright of this article.
This article is published under the terms of the Creative Commons Attribution License 4.0


