ABSTRACT
A framework for determining the quality of beef was developed based on the assessment of Beef Supply Chain (BSC) between the slaughter and retail points. In this respect, slaughtering, distribution, retailing and consumer preferences models were developed for assessing the beef processing designed features (BPDFs) across the BSC specifically in Slaughtering Facilities (SFs), Beef Distributing Facilities (BDFs), and Beef Retailing Premises (BRPs) in Dar es Salaam and Mbeya cities. The organized ideas, rules and beliefs to a set known as a framework for determining the quality of beef was one of the outcomes of this study. This study suggests that the claim that beef-quality is a complex phenomenon and cannot be objectively determined is not always correct. Applicability of the designed framework is useful as it avoids mistakes and misunderstanding resulting from the desire to measure the quality of object. The study proposed the development of other frameworks for beef quality determination across other processing units (breeding, grazing, cattle transportation and post retailing activities for its preparation at household levels).
Key words: Beef quality determination, slaughtering facilities, beef distribution facilities, beef retailing premises, compliance level.
Abbreviation:
NOMENCLATURE
BSC, Beef supply chain; BPDFs, Beef processing designed features; BDFs, Beef distributing facilities; SFs, Slaughtering facilities; BRPs, Beef retailing premises; BTQRs, Beef quality technical requirements; FAO, Food and Agriculture Organization; r, Requirements; x, Requirement variable; n, Number of designed features of a given requirement; X1, Sum of a given variables in two dimension; R, Range; XЄS, A set of all stimulant factors; XЄD, A set of all de-stimulant variables; Max, Maximum; Min, Minimum; z, Normalized beef processing designed feature; ZUM, Zero unitilization method; r × n, a two dimension arrangement of requirements and number of designed features of a given requirement; Q, Synthetic variable; qi, Sum of complied normalized processing designed features; CI, Compliance Index; k, Group classifying parameter; TS, Total score; OV, Overall.
The current means of determining the quality of retailed beef depends on mass inspection specifically on grading systems like Meat Standards Australia (MSA) and United States Department of Agriculture (USDA) of the processed products at the end of production (Tatum et al., 2011). The quality of beef like any other products is also determined based on factors like price in such a way that the higher the quality of the product, the better the price, and vice versa (Becker, 2002). In this respect, other studies have shown that there is lack of global implementable framework for determining the quality of beef in trading (Becker, 2000; Grunert et al., 2004; Robles et al., 2011; Bevilacqua et al., 2013).This has led to the difficulty in making decision on the suitability of
beef at purchasing point based on the available quality attributes (Becker, 2000; Grunert et al., 2004; Robles et al., 2011; Bevilacqua et al., 2013). In this respect, service quality (the comparison of the expectations with performance) based frameworks that comprehensively characterize various factors across the Beef Supply Chain (BSC) were developed for overwhelming the multi-faceted nature of the term ‘quality’ in business strategy (Seth et al., 2005; Dhanalaksmi et al., 2010; Gupta and Singh, 2012; Bevilacqua et al., 2013). The named frameworks were developed based on different factors of their respective areas of suitability, such as geographical, demographic, social and economic factors.
Quality cues based frameworks for measuring the suitability of beef were widely formalized and used by a set of indicators, ranging from small numbers to a dozen by carcass/meat classification systems. For, example, degree of marbling (dispersion of fat within lean) has been used for a long time in many developed countries as the main assessment index in the systematic methods and standards for evaluating beef quality (Polkinghorne and Thomson, 2010; Cheng et al., 2015; Gagaoua et al., 2017). Although various grading systems were developed and extensively implemented in meat trade, two main draw backs were not yet addressed. The first one is related to the complexity and heterogeneity of beef carcass that is too high to be evaluated by a single classification system. Another drawback is connected with different interest, views and interpretations among the beef processing stakeholders (breeders, slaughtering personnel, retailers and consumers) along the beef supply chain on the meaning of the term quality.
Different from other studies on the framework for quality determination, this study went deep in quality measurement by designing the infrastructural beef processing designed features (BPDFs). In connection to this, beef supply units, that is, Slaughtering Facilities (SFs), Beef Distributing Facilities (BDFs) and Beef Retailing Premises (BRPs) were assessed based on both their availability and compliance of BPDFs across the BSC. Therefore, this study was designed to work as a benchmarking model for conceptualization and designing of frameworks for quality measurement of various products across the processing chain.
Beef quality concept
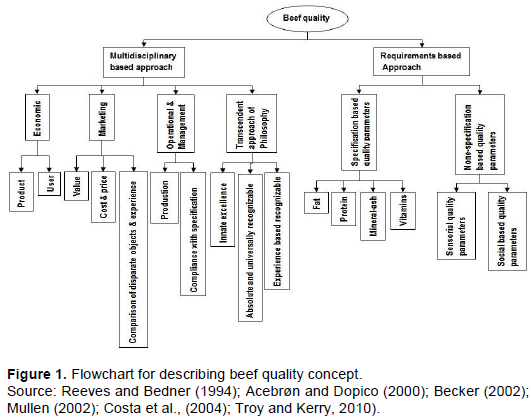
Beef quality is conceptually described by using a flowchart that divides the scholars into multi-disciplinary and requirements-based schools of thought as shown in Figure 1. In multi-disciplinary based group, beef quality is classified into four categories: economic, marketing, operational and management and transcendent approach of philosophy (Bevan, 1995; Beker, 2002; Fields et al., 2014). Economic discipline, in this case, dwells on profit maximization and market equilibrium of product between produces and the respective users. Marketing approach, on the other hand, refers to determinants of buying behavior and customer satisfaction through value, cost and comparison of disparate objects and experience variables. In addition to that, operation management category focuses on engineering practices and manufacturing controls (Bevan, 1995; Becker, 2002; Fields et al., 2014). A transcendent approach of philosophy, as other discipline in this regard, details the quality as an innate excellence, absolute and universally recognizable, and unanalyzable (experience based recognizable) property.
In the requirements-based studies, beef quality can be described as a multi-faceted issue due to the involvement of BQTRs like FAO based guidelines with respect to nutritional value, absence of alteration, genuineness, safety and traceability (Mullen, 2002; Moody and Shanks, 2003; Bevilacqua et al., 2013). This is extended to an argument that, quality is described based on the direct observation of the accessible indicators through human interpretation based on the given BQTRs (Bevan, 1995; Henson and Loider, 2001; Schröder and McEachern, 2002; Harvey, 2006). In connection to this, the quality of any product can be deconstructed into a set of qualities on a sense that the more complex the product the longer and more multidimensional is the list of qualities (Schröder and McEachern, 2002; Harvey, 2006). This is described by Cheng et al. (2015), during which beef quality is characteristically described by color, tenderness, intramuscular fat, moisture and ultimate pH. In the requirement-based approach, quality is distinguished from qualities, which are the explicit expression of attributes rather than an essential embodiment of character (Schröder and McEachern, 2002; Harvey, 2006). Qualities include characteristics, attributes or properties that describe quality of product in terms of values that are inferred from indicators (Harvey, 2006). This information indicates that quality cannot be defined by a list of qualities rather it is a concept that evokes the essence of the product (Becker, 2002; Mitra and Golder, 2006; Harvey, 2006). The mentioned essence of the product is described based on the type of information (facts, estimates, predictions and relationships) and specific constructs (concepts or ideas about an object, attribute or phenomena that are worthy of measurement) that are relevant for decision making under the BQTRs (Schröder and McEachern, 2002; Harvey, 2006).
Despite the connectivity of the term ‘quality’ with a given product, it is disregarded as a product’s attribute, as the attributes required for quality depend on how the product is used (Bevan, 1995). In this regard, the term‘quality’ is mentioned as being complicated in two scenarios. The first one is related to the description of quality against the given standards (Harvey, 2006). The other scenario is on the description of quality of product that is based on inherent characteristics of the product (Reeves and Bedner, 1994; Acebrøn and Dopico, 2000; Becker, 2002; Mullen, 2002; Costa et al., 2004; Troy and Kerry, 2010). Based on this fact, it is concluded that, it is not possible to have a single definition for the term quality (Reeves and Bedner, 1994; Miliauskaité, 2012; Fields et al., 2014). The concept has wide variety of phenomena and depends on the context and even the time period in which it is examined (Miliauskaité, 2012). Conflicts among the identified scholars are inevitable because each defines quality from different point of views. Besides the strengths and weaknesses of each definition, no one is better than others in every situation (Bevan, 1995; Miliauskaité, 2012). Philosophically, these definitions were formulated based on the consumer demands that are relevant to the perceived quality decisions. This is therefore, highlighted by other studies that, when a given technical product specifications are responsible for objective quality, the goal has been to improve the physical food product, based on the demands of the consumers (Acebrón and Dopico, 2000).

Quality of the given product can be determined by using standards on either being specific or measurable outcome for comparative purposes (Schröder and McEachern, 2002; Harvey, 2006). Standard is one of the complicated terms due to its existence as both fixed criterion (against which outcome can be matched) and a measure of attaining a given level. In quality determination, the emphasis is on the use of the term standard as a fixed criterion and not level of attainment (Schröder and McEachern, 2002). Standard or specification” is a document comprising a list of requirements in connection to the quality cues of the interested product (Schröder and McEachern, 2002). In this case, there are two types of standards, that is, statutory standards and commercial standards (Schröder and McEachern, 2002). Statutory standards are compulsory requirement in public quality schemes (Becker, 2002) but are not necessarily helpful to consumers (Schröder and McEachern, 2002). Commercial standards are generally communicated through labeling information, but the actual underlying specifications are rarely accessible (Schröder and McEachern, 2002). When a beef is taken as an example to address this situation, nutritional quality parameters, that is, fat, protein, mineral ash, and moisture have specifications; whereas there is no report of specifications in sensorial and social quality parameters.
Quality determination
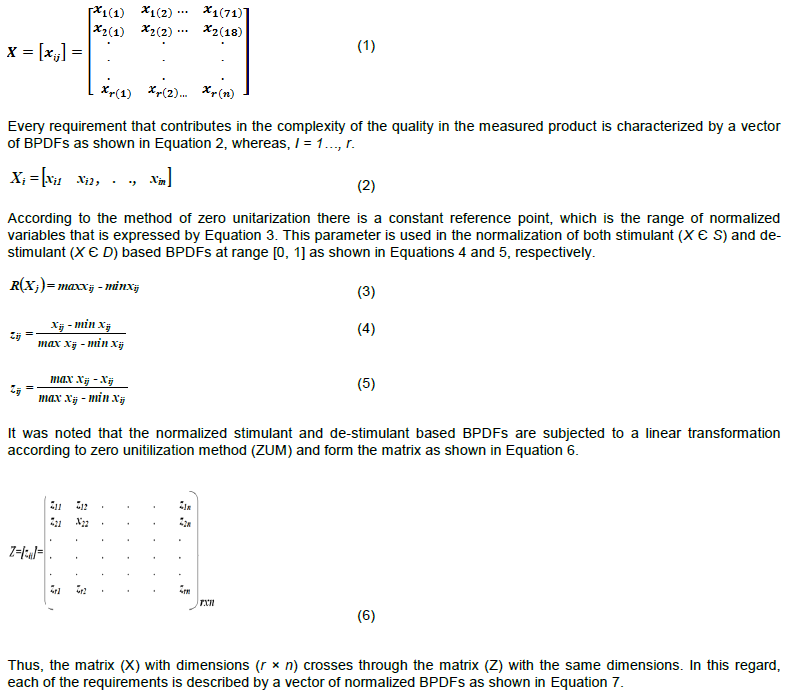
Determination of the quality of the product is also connected to the seeking of consumers’ optimum needs and motivations based on economic and deeper levels involving emotions, cultural norms and values, and group affiliations (Devine et al., 2004). It was also highlighted that the term optimum in product quality should not be considered as a single unchangeable state, but it depends on the end use of the product and even the way the product is prepared (Becker, 2002). This is subjective based quality determination and may be defined as fitness for use, fitness for certain goals, or as the composite of product attributes which yield consumer satisfaction (Becker, 2002; Grunert et al., 2004). Studies have linked the quality determination concept to qualitative grading-based analysis through synthetic based measurement (de Vicente Lama et al., 2010; Kukula and Bogocz, 2014; Egbunike et al., 2018). In this respect, studies have shown that quality as a complex phenomenon is explained by r requirements, that is, x1, x2,..,xr, whereas, each of the requirements is described by n designed features (Kukula and Bogocz, 2014; Grzegorz, 2015). In addition to that, information of the BPDFs forms a two dimensional matrix as shown in Equation 1, where xij, represents values of variable X in the object Wi.
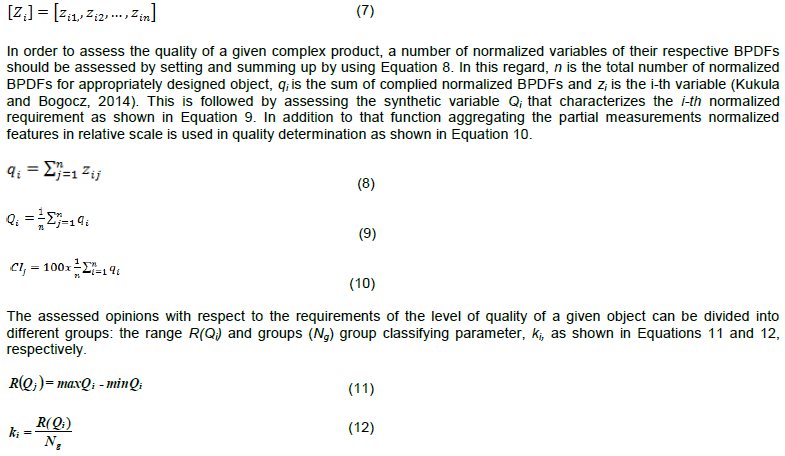
Frameworks for quality determination
The beef quality determination frameworks are currently depending on mass inspection of the processed beef by grading systems (Tatum et al., 2011).
This determination involves the use of standards that were published on reacting on the raised complaints as carcasses were traded unseen by buyer (Polkinghorn and Thompson, 1999). Some of these standards include MSA, USDA grading system, Canadian grading system, Japanese Meat Grading Association (JMGA) grading and Europe classification.
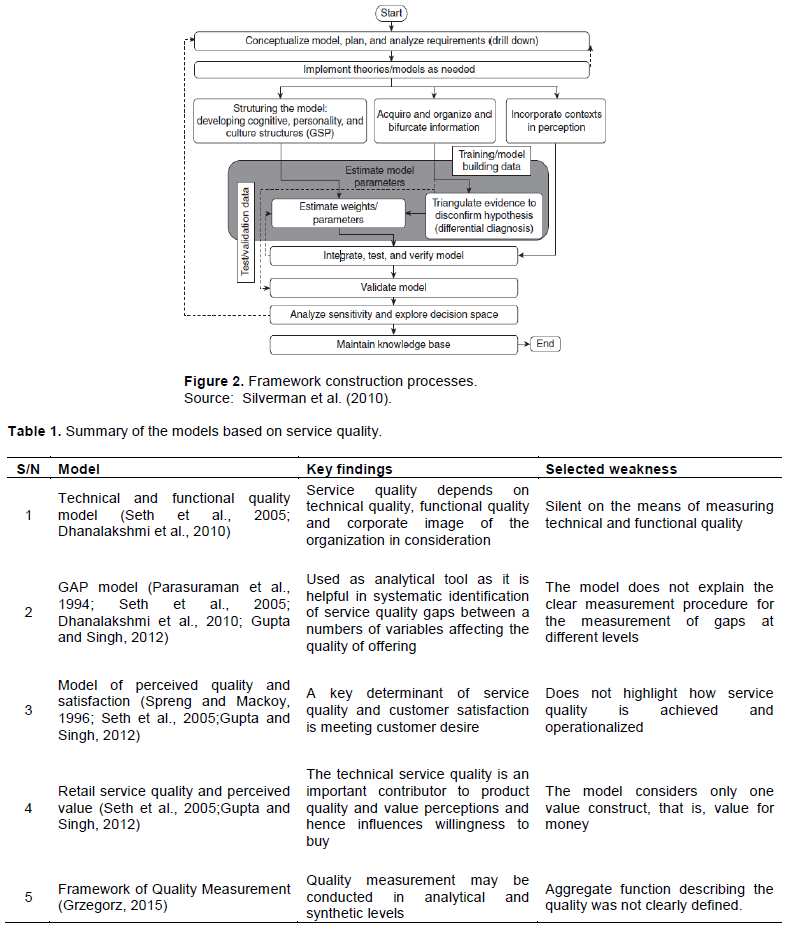
The knowledge engineering-based model building process (KEMBP) as shown in other studies is a model for frameworks designing (Moody and Shanks, 2003; Silverman et al, 2010). The KEMBP is required for framework designing as it addresses the following key functional requirements: systematically transforming empirical evidence, tacit knowledge, and expert knowledge into data for modeling; reduce human errors and cognitive biases (e.g., confirmation bias); verify and validate the model as a whole; and maintain the knowledge base over time (Silverman et al, 2010). Studies have detailed the following stages for framework building process as shown in Figure 2: model conceptualization, planning, and analysis requirements; theories/model review/implementation; model structuring; information acquiring, organization and bifurcation; model parameters estimation; context in perception incorporation; model integration, testing and verification; model validation; sensitivity analysis; and knowledge based maintaining (Moody and Shanks, 2003; Silverman et al, 2010).
Model conceptualization, planning, and analysis requirements as the first stage involve the characterization of modeling problem based on specific objective and nature of the domain. In general, the modeling problem, along with the context, provides what needs to be accomplished and serves to define the method to go about. At the end of this stage, the following were expected: clarified objectives; understanding the contexts surrounding the model; appropriate information from other studies; and the conception of the modeling problem. In the next stage, the basic theories necessary to describe the social systems are implemented in the designed framework. Quality measurement was reported as one of the critical parameters in the highly competitive market (Kennerley and Neely, 2002; Grzegorz, 2015). Techniques involved in quality determination were classified into quality measurement methods and quality determination conceptual models (Seth et al., 2005; Grzegorz, 2015).
The former technique was expressed by a six sigma, that is, a set of management techniques and tools for process improvement (Klefsjö et al., 2001; Goh, 2012). However, this technique was criticized as it was noted as too narrow designed to both fix the existing processes and allowing little room for new ideas (Klefsjö et al., 2001; Goh, 2012; Grzegorz, 2015). The latter technique, on the other hand, was highlighted in a list of some of the frameworks that were reviewed in developing this study as shown in Table 1. The main gap in the first five frameworks was that what is measured in connection to quality determination cannot be expressed in numbers. Although this gap was addressed in the sixth item, there was a gap on describing the quality as the framework depends on a literature-based quality weighting factor. In this respect, this work is developed for addressing this gap by using Likert based information for quality determination.
Framework conceptualization-features and governance
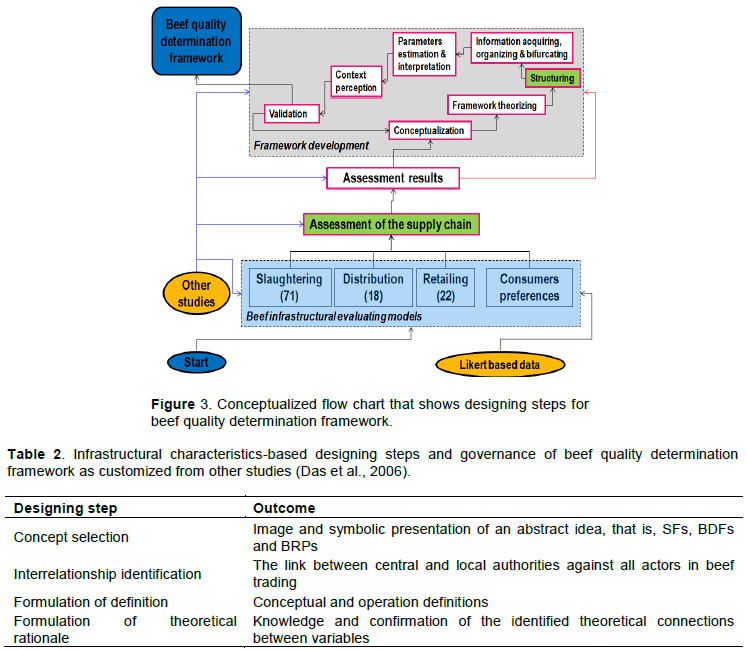
Figure 3 shows a flow chart that is used for characterizing the process of beef quality determination. Slaughtering, distribution, retailing and consumer preferences models were developed and tested based on information from other studies and Likert based information (Mwashiuya et al., 2018a, b). These models were used in the assessment of beef processing features across the supply chain in Dar es Salaam and Mbeya cities. According to the 2002 population and housing census, as the former city with a total area of 1,800 km2 has a population of 4.36 million, the latter one with 19,098 km2 has a population of 0.69 million (United Republic of Tanzania (URT), 2013). As indicated in other studies, Dar es Salaam city was purposively selected based on researcher experience and judgment (Guarte and Barrios, 2006; Etikan et al., 2016). This is one of the non-probabilities sampling technique that a researcher uses to choose a sample of subjects/units from a population (Guarte and Barrios, 2006; Triola et al., 2006; Etikan et al., 2016). Although this sampling approach is too subjective to have good representative sample from the population, it is useful especially when randomization is impossible like when the population has unique characteristics (Etikan et al., 2016). In this regard, Dar es Salaam was selected because of its unusually high population due to its wider metropolitan characteristics which attract many people looking for employment in the industries. Mbeya city, on the other hand, was conveniently selected among other three cities as shown in other Literature (FAO, 1997). The convenience in this case was described in terms of more availability and accessibility of SFs, BDFs and BRPs in Mbeya as compared to other cities.
Result associated with this assessment was discussed based on information from other studies in seven steps for designing a framework for quality determination. The designed framework was then used for measuring of the quality of beef in Dar es Salaam and Mbeya cities.
Requirement quality cue based theories on consumer behaviour towards beef quality determination was implemented in the designed framework. In this case, BQDF was designed through internal consultation and analysis of existing cattle slaughtering, beef distribution and retailing chain. In this respect, BQDF was designed under four main steps through assessment of the current beef supply chain as shown in Table 2. In this regard, the Likert scale based BQDFs in both analytical and synthetic levels was designed based on the results of the infrastructural assessment of the current slaughtering, distribution and retailing chain as shown in other studies (Grzergorz, 2015).
Framework structuring
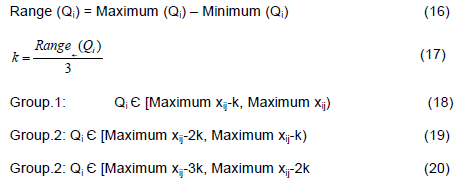
The framework for beef quality measurement on analytical level was structured through the four steps: first, the requirements for beef quality production at fixed time between slaughtering and retailing points were identified; then, type and number of quality cues describing the identified requirements were found; next, the unit and accuracy of measurement was established for each quality cue; and finally, for each of the listed quality cues, overall score in percentage was provided by using Equations 13, 14, and 15 for the assessed slaughtering, distribution and retailing practices, respectively.
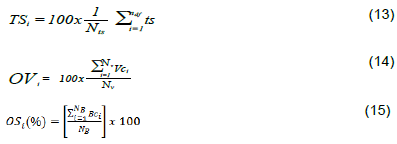
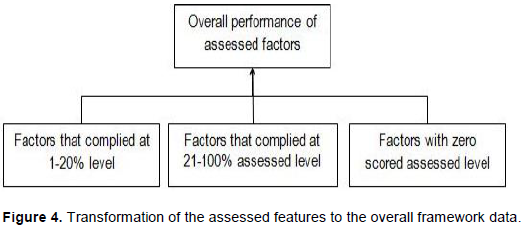
The framework on analytical level was presented as shown in other studies by a set of three vectors δ3, where δ3 constitutes three- dimensional vectors, that is, slaughtering (δ1,γ1), distribution (δ2,γ2) and retailing (δ3,γ3) (Grzergorz, 2014). When a vector (δi,γi) is taken for detailing this case: δi for i=1,2,3 was described as the i-th requirement formulated by one of the three identified blocks in relation to the processed beef; and γi means importance of the i-th requirement on the interval scale 0…m. In this framework, the level of compliance was described based on algebraic Equation that includes the assessed factors that were categorized with respect to levels of compliance as shown in Figure 4. In this regard, the overall performance of the assessed factors was used as a main quality determination subject for BQIF at 1-20% level, 21-100% level; and zero scored level.
The grouping of the requirements in the assessed beef processing components (SFs, BDFs and BRPs) was adopted from other studies into the following steps: First, the range of the complied features was sought by using Equation 16. This is followed by estimation of a three groups dividing parameter, k by using Equation 17. This parameter was used to divide the entire set of the requirements into the following groups as shown in Equations 18, 19 and 20: first, the highest complied features; the second group was composed of the average conformed features; and the last group with low level of compliance.
After having the conceptual framework, its respective data requirements were determined from other studies. In this respect, strategies for determining appropriate SFs, BDFs and BRPs as the requirements for beef consumers were developed. This was implemented by aligning the development actions with the quality assurance system in which not only concrete measures, that is, quality documentation (pre-registration reports), quality assessment (inspection and surveillance) and quality reviews were defined, but also the decision of achieving the respective measures were delineated.
After eliciting the expert input from the reviewed studies, critical pieces of information were verified by pitting against other sources of information like empirical evidence from database and event data. In this respect evidence based Equation and flowcharts were designed by organizing the empirical evidence or expert input by breaking statements into simpler units. Any specific reliable information was used to identify and tag for further investigation and sensitivity analysis.
Incorporation of context in perception
The argument of consumer’s characteristics of changing preference on beef as reported in other studies (Becker, 2000, 2002) was used as an important parameter for gathering information from stakeholders across the surveyed SFs, BDFs and BRPs. In this regard, an extensive survey was designed to elicit knowledge for beef quality from all stakeholders across these infrastructural based characteristics in the targeted format.
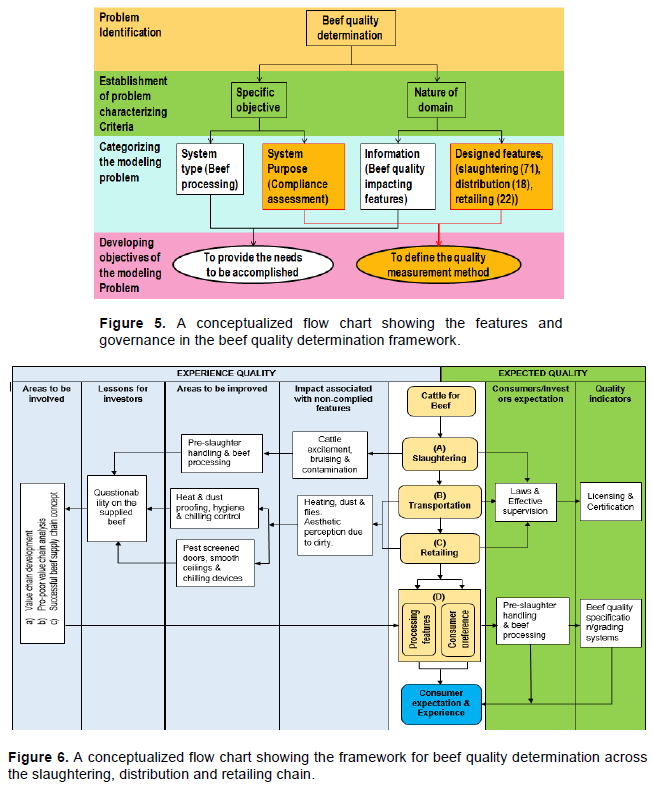
Features and governance in the framework conceptualization were presented with respect to the flow chart as shown in Figure 5. In this respect, the beef quality determination was identified as a problem in this development. This was followed by establishment of specific objective and nature of domain as the problem characterizing criteria. The former criterion categorizes the modelling problem into beef processing (system type) and compliance assessment (system purpose); whereas BQIF as information and designed BPDFs, that is, processing units (SFs, BDFs and BRPs) were identified as categories of the latter dividing factor. Finally, objectives in connection to the need to be accomplished and definition of the quality measurement method were developed from the established categories.
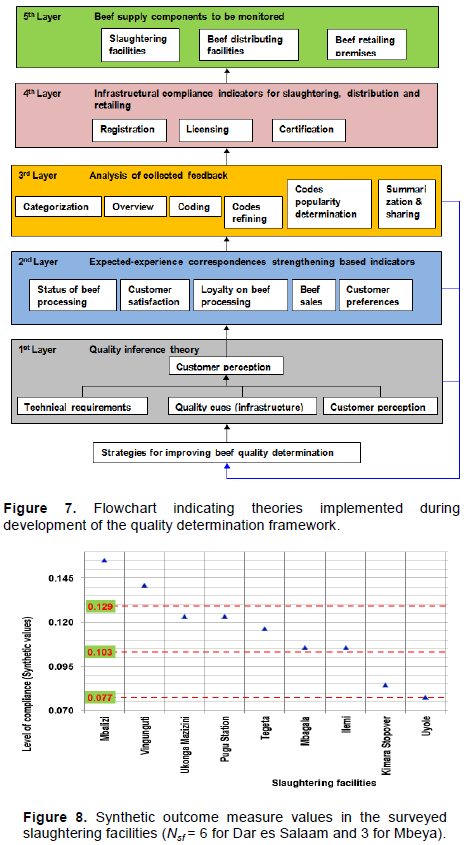
The conceptualized framework for measuring the quality of beef across the slaughtering, distribution and retailing chain is shown in Figure 6. The conceptual framework comprises six needs that should be accomplished for determination of the level of quality of beef across the supply chain. These are areas to be involved, lesson to be learnt, areas for improvement, impact associated with non-complied features, consumers/investors expectation and quality indicators. The first four needs formulate experience category of quality, whereas the last two are the components of expected quality. The level of correspondence between the former and the latter categories of quality is described as the parameter for measuring the needs to be accomplished.
The quality of beef in this concept can be described based on the mechanisms involved with cattle slaughtering unit as an example. In this respect, the cattle excitement, bruising and beef contamination were identified as the measures of the impacts associated with non-complied BPDFs. These requirements were connected with pre-slaughter handling and beef processing as the needs for areas to be improved. The questionability on the handling and beef processing was described as another important requirement for investors to learn the needs for processing suitable beef. After learning the whole system, the areas to be involved, that is, value chain, pro-poor value chain analysis and successful beef supply chain concept were established. Consumers/investors expectation was also taken as another requirement that is indicated by laws and effective supervision. The last need to be accomplished in this design was quality indicators that were indicated by licensing and certification of slaughtering activities. This scenario has also been shown in other studies in which private sectors process and distribute beef for niche market (Kamugisha et al., 2017; Muzzo and Provenza, 2018).
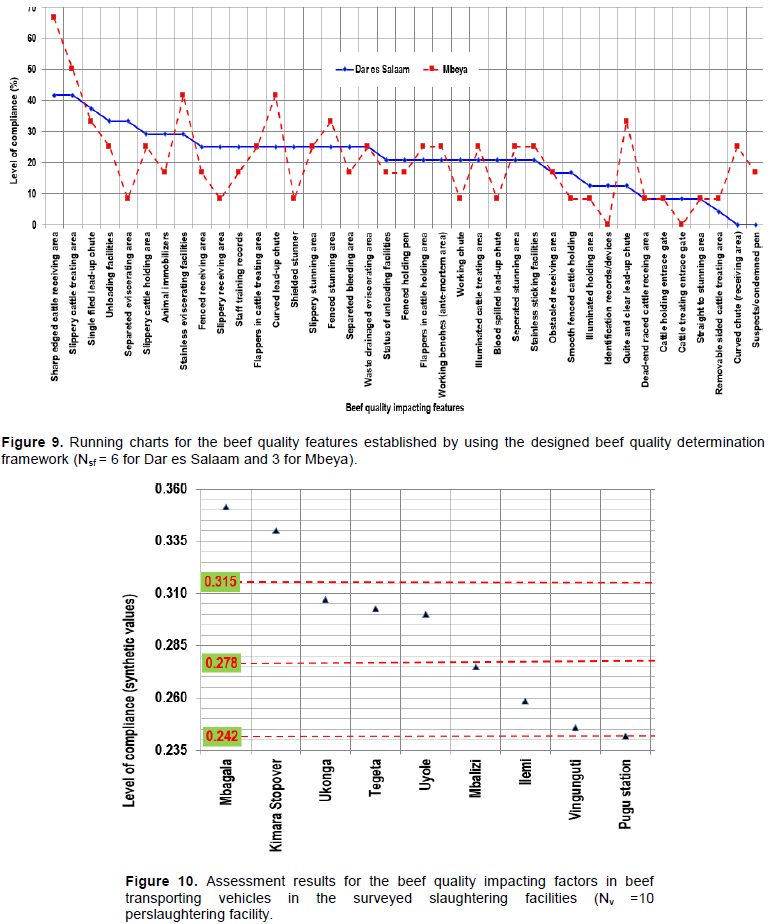
Figure 7 shows the implemented theories for framework development within five main blocks. Beef quality inferring process is shown as one of the layers that show requirements – quality cues based interaction theory. The block inter-relates four main elements (technical requirements, quality cues, customer perception, and customer requirements) that involved in beef quality extrapolation. First layer is another block in this designing that describes correspondence between expected quality and experienced quality was shown by five customer feedback based indicators. This layer is important in the framework development as it provides necessary data for customer experience and their overall satisfaction levels between experienced and expected qualities. The means at which the collected feedback is analyzed are shown in the second layer of the implemented theories. This activity includes seven steps: data collection, data categorization, quick overview, feedback coding, code refining, codes popularizing and summarizing. Infrastructural compliance indicators for beef supply are shown in the third layer of the theory implementing diagram. This layer involved conformity checking practices, that is, registration, certification and licensing of beef processing and distribution facilities. Fourth layer comprised SFs, BDFs and BRPs as the important facilities for measuring the level of quality beef.
Application of the designed framework
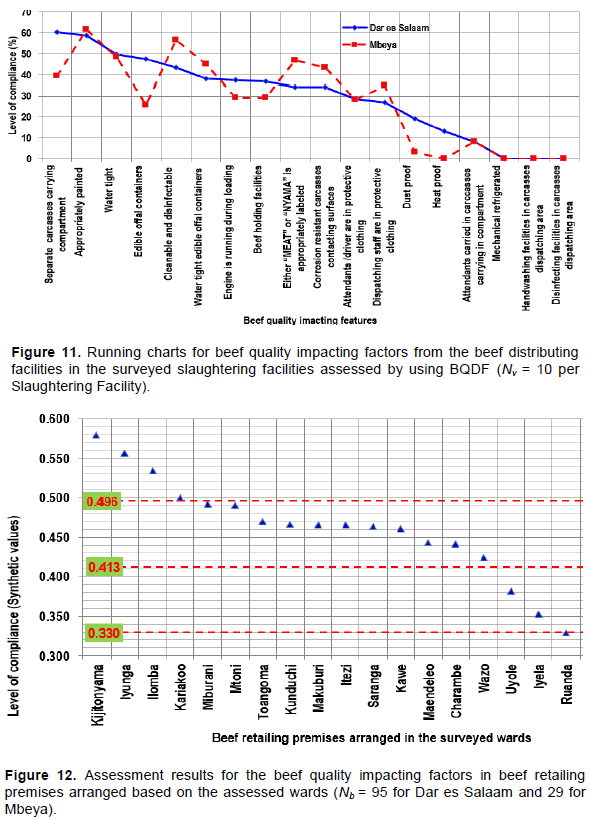
A list of 39 observed infrastructural based beef processing features among 71 in the surveyed SFs was established for Dar es Salaam and Mbeya. The list includes the level of subsequent quality cues of beef in the processing infrastructural based perspective. The list also includes components of synthetic outcome measure in three types of performance variables, namely, nominants (where the best value is implied); destimuli (where the low values indicate better performance); and stimuli (where the high value means better performance). This is a compliance-based result for the assessed SFs with 0 and 66.7% as the lowest and highest evaluated levels for the surveyed cities. The surveyed SFs with respect to the assessed beef processing facilities were ranked into three groups as shown in Figure 8. The highest ranked group includes Mbalizi (0.155) and Vingunguti (0.141) is bounded by 0.129 and 0.155 limits. This is followed by the group that comprised Ukonga Mazizini (0.123), Pugu Station (0.123), Tegeta (0.116), Mbagala (0.106) and Ilemi (0.106) SFs that were within 0.103 and 0.129 levels of synthetic outcome. The lowest group observed in this slaughtering assessment includes Kimara Stopover (0.085) and Uyole (0.077) as the lowest complied SFs in this study.
It is worth noting that the pattern discrepancy between the surveyed SFs in this analysis as shown in Figure 9 supports the failure of accepting null hypothesis that the assessed SFs have equal medians. In this respect, it was shown that the level of compliance of fourteen features in Mbeya was higher than in Dar es Salaam. In addition to that, the level of compliance of eighteen features in Dar es Salaam was higher than in Mbeya. Despite the mentioned discrepancies, similarity of the assessed cities is shown based on seven BPDFs, that is, flappers in cattle receiving area, slippery treatment area, waste drainage in eviscerating point, obstacle receiving area, dead-end raced receiving area, cattle holding entrance gate and straightness to stunning area.
A list of components of synthetic outcome measure in three types of performance variables, namely, nominants, de-stimuli and stimuli was also included in this study as shown in Figure 9. In this case, the level of compliance was 0% and 81.7% as the lowest and highest evaluated levels, respectively. The compliance of the surveyed SFs with respect to the assessed beef transportation was ranked into three groups as shown in Figure 10. The first group in this respect includes Mbagala and Kimara as the assessed SFs with the highest-level compliance. The second one comprises SFs that have moderate level of outcomes and consist of Ukonga Mazizini, Tegeta and Uyole. The last ranked group in this case includes Mbalizi, Ilemi, Vingunguti and Pugu Station that were found to have the lowest complied BDFs.
Results were further interpreted by using synthetic outcome measure values of compliance chart that classifies beef transporting vehicles into three groups as shown in Figure 10. The first group is the one that is identified by 0.129 and 0.155 boundary limits with 0.148 as the average scored level whereas Mbalizi and Vingunguti are SFs in this group. Another group is described by 0.103 and 0.129 limits with 0.115 as an optimum scored level and has UkongaMazizini, Pugu Station, Tegeta, Mbagala and Ilemi. The final group that has Kimara Stopover and Uyole is composed of 0.077 and 0.103 as minimum and maximum points with 0.081 as the average scored level.
The pattern discrepancies between beef distributing vehicles in the surveyed SFs in this study support the rejection of null hypothesis. In this case it was noted that at least one of the medians of the assessed vehicles in SFs appears to be different from the others. This situation is shown in Figure 11 where the level of compliance of seven features in Dar es Salaam was higher than Mbeya. In addition to that, level of compliance of six features in Mbeya was higher than in Dar es Salaam. Despite the mentioned discrepancies, similarity of the assessed cities is shown based on five BPDFs: attendant in protective gears, attendants in beef carrier, mechanical refrigeration, hand-washing facilities and disinfectants.
Measurement in beef retailing premises
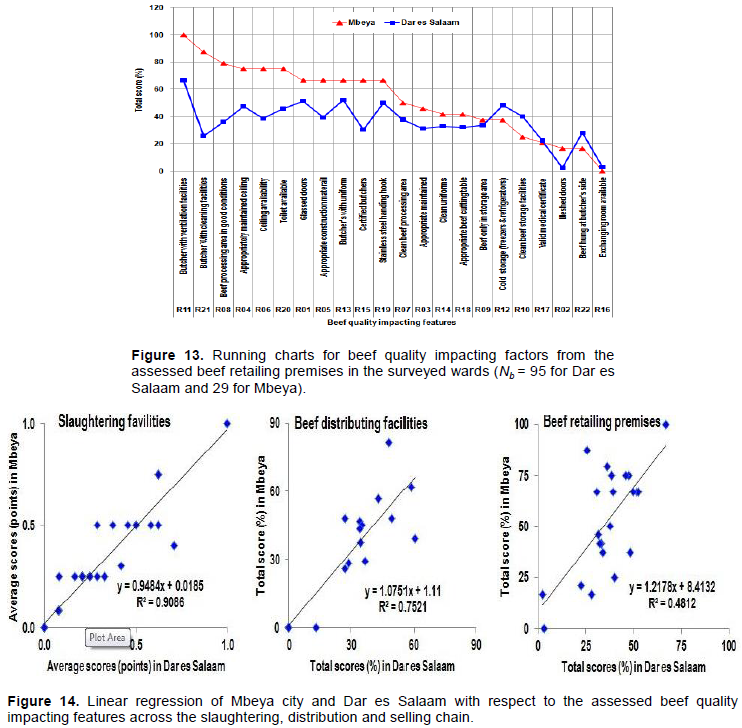
The analytical level of quality measurement with respect to beef retailing for Dar es Salaam and Mbeya is shown in Figure 12. In this respect, a total of 22 values include components of synthetic outcome measure in nominant and stimuli only. In this respect, the compliance of the surveyed BRPs in 18 surveyed wards with respect to the assessed beef selling was ranked. The first group retailing premises in this regard includes four wards with the highest-level compliance: Kijitonyama, Iyunga, Ilomba and Kariakoo. The second is a group with wards that have retailing premises with an average level of compliance that includes Miburani, Mtoni, Toangoma, Kunduchi, Makuburi, Itezi, Saranga, Kawe, Maendeleo, Charambe and Wazo. The last group in this regard includes Uyole, Iyela and Ruanda as premises with the lowest complied beef transporting facilities. Results were further interpreted by using synthetic outcome measure values of compliance chart that classifies the assessed butchers in the surveyed wards into three groups. The first group is the one that is identified by 0.496 and 0.580 boundary limits with 0.543 as the average scored level whereas Kijitonyama, Iyunga, Ilomba and Kariakoo were the wards with the complied retailing premises in this group. Another group is described by 0.413 and 0.496 limits with 0.462 as the average value and contained the highest number of the surveyed wards in this study. The last group that has Uyole, Iyela and Ruanda is composed of 0.330 and 0.413 as lowest and highest points with 0.355 as the average scored level.
The pattern discrepancies between the wards in the surveyed cities in this study support the rejection of null hypothesis that at least one of the medians of the assessed retailing premises in the surveyed wards appears to be different from the others. In this respect, Figure 13 shows level of compliance of seventeen features in Dar es Salaam was higher than Mbeya. In addition to that, level of compliance of five features in Mbeya was higher than in Dar es Salaam. The dotted lines show the overall average scores for each city, which shows the beef retail shown in Mbeya has a better infrastructural feature compared to Dar es Salaam.
Results were further statistically analyzed and summarized by using linear regression plots between the cities as shown in Figure 14. The scores in each city were further compared using linear regression plots, which compare the values of scores for Dar es Salaam (on horizontal axis), vs those of Mbeya facilities, (vertical axis), for slaughtering facilities, carcass transportation facilities and beef management in retail shops. The closeness of scores between the cities was assessed using the parameters for the linear Equation of the form y = mx + b. That is the slope m and the value of regression coefficient, R2. The higher the slope (m > 1.0) the better the beef supply infrastructure in the city of Mbeya than in Dar es Salaam. Based on the line y = x inserted on the plots, a linear best fit above y = x implies better facilities in Mbeya and vice versa. Also, value of R2 ≈ 1.0 indicates stronger correlation or resemblance of the facilities design features between the two cities, while the lower value R2 <<1.0 indicates wide difference between the two cities. The results have shown that there is positive correlation of BQIF across the beef supply chain between the assessed cities. This correlation proves the existence of similarities in beef processing in the Tanzanian cities. Similar observation was made by other studies, during which it was reported on the none-adherence to the required sanitation and hygiene requirements in Nairobi and Isiolo counties in Kenya (Chepkemoi et al., 2015).
In general, the study has brought an idea as an additional component in a set that also includes organized rules and beliefs items. Idea in this regard is connected to the thoughts and suggestions of using infrastructural BPDFs to determine the quality of beef. Rules, on the other hand, include the organized principles, that is, test statistics, mathematical expression that were applied in measuring the extent of compliance of various BPDFs.
This work has positive academic contribution to not only engineering management but also in food science and technology in general. This is discussed based on the fact that beef processing infrastructural features were conceptualized and designed to the idea for modeling the quality determination of beef. In this regard, BPDFs across the supply chain were used to measure the quality of the processed beef. This was implemented as the study: identifies basic connections of quality production, quality experience and quality evaluation during beef processing; elaborates aspects of quality processes that influence the means by which the quality is conceptualized and managed; shows the quality states residing within the quality processes; and indicates the theoretical and managerial implication for quality determination.
In this study, ideas, rules and beliefs were organized in a set known as a framework that conceptualized, designed and applied for determining the quality of beef. Beliefs in this case are connected to the situation of accepting the idea of using the Likert based data collection technique for quality determination. In this respect, beef quality determination was described by using BPDFs across the slaughtering, distribution and retailing chain. This determination was implemented by organizing the primary and secondary information in an understandable format for beef quality perception for all stakeholders across the supply chain.
As observed in other studies, the use of Likert based information in quality determination was noted as the gap in this study. This observation is taken as an appropriate justification for proposing further study on quality determination by using Likert based techniques. Another limitation of the study was connected to the assumption that the developed framework is working under assumption that the pre-slaughtering processes like breeding, grazing and cattle transportation should be complied with the technical requirements. The study was also not concerned with the situation across the post retailing activities to the beef preparation at household levels. This was also taken as another area for further study of development of a framework for measuring the quality of beef.
BSC, Beef supply chain; BPDFs, Beef processing designed features; BDFs, Beef distributing facilities; SFs, Slaughtering facilities; BRPs, Beef retailing premises; BTQRs, Beef quality technical requirements; FAO, Food and Agriculture Organization; r, Requirements; x, Requirement variable; n, Number of designed features of a given requirement; X1, Sum of a given variables in two dimension; R, Range; XЄS, A set of all stimulant factors; XЄD, A set of all de-stimulant variables; Max, Maximum; Min, Minimum; z, Normalized beef processing designed feature; ZUM, Zero unitilization method; r × n, a two dimension arrangement of requirements and number of designed features of a given requirement; Q, Synthetic variable; qi, Sum of complied normalized processing designed features; CI, Compliance Index; k, Group classifying parameter; TS, Total score; OV, Overall.
The authors have not declared any conflict of interests.
REFERENCES
|
Acebrón LB, Dopico DC (2000). The importance of intrinsic and extrinsic cues to expected and experienced quality: An empirical application for beef. Food Quality and Preference 11:229-238.
Crossref
|
|
|
|
Becker T (2000). Consumer perception of fresh meat quality in Germany. British Food Journal 102(3):246-266.
Crossref
|
|
|
|
|
Becker T (2002). Defining Meat Quality. In. Kerry J, Kerry J, Ledward D (eds.), Meat Processing Improving Quality. Washington, DC: Woodhead Publishing Limited, pp. 3-24.
Crossref
|
|
|
|
|
Bevan N (1995). Measuring usability as quality of use. Software Quality Journal 4:115-150.
Crossref
|
|
|
|
|
Bevilacqua M, Marini F, Biasioli F, Gasperi F (2013). Advances in analysis of instrumental food sensory. Instrumental Food Sensory Quality pp. 313-352.
Crossref
|
|
|
|
|
Cheng W, Cheng JH, Sun DW, Pu H (2015). Marbling analysis for evaluating meat quality: Methods and techniques. Comprehensive Reviews in Food Science and Food Safety 14:523-535.
Crossref
|
|
|
|
|
Chepkemoi S, Lamuka PO, Abong GO, Matofari J (2015). Sanitation and hygiene meat handling practices in small and medium enterprises butcheries in Kenya: Case study of Nairobi and Isiolo counties. Internet Journal of Food Safety 15:64-74.
|
|
|
|
|
Costa AIA, Dekker M, Jongen WMF (2004). Overview of means-end theory: Potential application in consumer oriented food product design. Trends in Food Science and Technology 15:403-415.
Crossref
|
|
|
|
|
Das AK, Anjaneyulu ASR, Verma AK, Biswas S (2006). Scenario of Indian livestock and meat marketing. Indian Food Industry 25(4):58.
|
|
|
|
|
de Vicente-Lama M, Sánchez HM, Sobrino JNR (2010). Compliance with disclosure requirements for investment properties: A Comparative study between Spain and UK.
|
|
|
|
|
Devine CE, Hopkins DL, Hwang IH, Ferguson DM, Richards I (2004). Electrical stimulation. In Jensen C, Devine CE, Dikeman M (eds), Encyclopedia of meat sciences. Oxford, UK: Elsevier Academic Press. pp. 413-423.
Crossref
|
|
|
|
|
Dhanalaksmi U, Rajini R, Kanimozhi S (2010). Developing service quality using gap model-A critical study, IOSR. Journal of Business and Management pp. 46-51.
|
|
|
|
|
Egbunike PA, Jesuwunmi CA, Adewoyin AO, Qgunmeru AO (2018). Empirical appraisal of IAS-16 disclosures compliance level of listed cement manufacturing firms in Nigeria. International Journal of Economics and Business Administration 4(2):56-76.
|
|
|
|
|
Fields P, Hague D, Koby GS, Lommel A, Melby A (2014). What is Quality? A management discipline and the translation industry get acquainted. Technologies de la traducció . Traduccióiqualitat 12:404-412.
Crossref
|
|
|
|
|
Gagaoua M, Monteils V, Couvreur SRD, Picard B (2017). Identification of Biomarkers Associated with Rearing Practices, Carcass Characteristics and Beef Quality: An Integrative Approach. Journal of Agricultural and Food Chemistry 65(37):8264-8278.
Crossref
|
|
|
|
|
Goh TN (2012). Some practical issues in the application pf lean six sigma to service systems. Nang Yan Business Journal 1(1):21-26.
Crossref
|
|
|
|
|
Grunert KG, Bredahl L, Brunsø K (2004). Consumer Perception of Meat and Implication for the product development in the meat sector-A review. Meat science 66:259-272.
Crossref
|
|
|
|
|
Grzegorz G (2015). The Framework of Quality Measurement. Management 10(2):177-191.
|
|
|
|
|
Gupta TK, Singh V (2012). Service quality in supply chain: A Review. International Journal of Engineering and Technology 2(8):1395-1404.
|
|
|
|
|
Harvey L (2006). Understanding quality. In. Froment E, Kohler E, Purser L, Wilson L (eds), EUA Bologna Handbook: Making Bologgna Work. Brussels:University Association and Berlin, Raabe P 15.
|
|
|
|
|
Henson S, Loader R (2001). Barriers to agricultural export from developing countries: The role of sanitary and phytosanitary requirements. World Development 29(1):85-102.
Crossref
|
|
|
|
|
Kamugisha PP, Mdoe NSY, Mtenga LA (2017). Characterising the Tanzanian quality beef supply chain; a case of Arusha and Dar es Salaam cities. Livestock Research for Rural Development 29(7):1-10.
|
|
|
|
|
Kennerley M, Neely A (2002). Performance Measurement Frameworks: A Review, business performance measurement. Theory and Practice pp. 145-155.
Crossref
|
|
|
|
|
Klefsjö B, Wiklund H, Edgeman RL (2001). Six sigma seen as a methodology for total quality management. Measuring Business Excellence 5(1):31-35.
Crossref
|
|
|
|
|
Kukula K, Bogocz D (2014). Zero unitarization method and its application in ranking research in agriculture. Economic and Regional Studies 7(3):5-13.
|
|
|
|
|
Miliauskaité J (2012). Quality of service: concept analysis. In. ÄŒaplinskas AA, LupeikienÄ— A, Vasilecas O (eds.), Tenth Databases and Information Systems, International Baltic Conference on Databases and Information Systems. Local Proceedings Materials of Doctoral Consortium.
|
|
|
|
|
Mitra D, Golder PN (2006). How does objective quality affects perceived quality? short term effect, long-term effects, and asymmetries. Marketing Science 25(3):230-247.
Crossref
|
|
|
|
|
Moody DL, Shanks GG (2003). Improving the quality of data models: empirical validation of a quality management framework Information System 28:619-650.
Crossref
|
|
|
|
|
Mullen AM (2002). New techniques for analyzing raw meat quality, Meat processing In. Kerry J, Kerry J, Ledward D (eds.), Meat Processing Improving Quality. Washington, DC: Woodhead Publishing Limited. pp. 394-416.
Crossref
|
|
|
|
|
Muzzo BI, Provenza FD (2018). A review of strategies for overcoming challenges of beef production in Tanzania. Livestock Research for Rural Development 30:12.
|
|
|
|
|
Mwashiuya JT, Manyele SV, Mwaluko GS (2018a). Assessment of Beef Transportation Infrastructure from Slaughtering Facilities in Tanzanian Cities. Engineering 10:814-836.
Crossref
|
|
|
|
|
Mwashiuya JT, Manyele SV, Mwaluko GS (2018b). Assessment of Beef Quality Determinants Based on Consumer Preferences". Journal of Service Science and Management 11:657-690.
Crossref
|
|
|
|
|
Polkinghorne RJ, Thompson JM (2010). Meat standard and grading a World view. Meat Science 86:227-235.
Crossref
|
|
|
|
|
Reeves CA, Bedner DA (1994). Defining quality alternatives and implications. Academic of Management Review 19(3):419-445.
Crossref
|
|
|
|
|
Robles R, Vannini L, Alvarez R (2011). Quality beef schemes and consumer perception. Journal of Food Products Marketing 17(2):163-182.
Crossref
|
|
|
|
|
Schröder MJA, McEachrn MG (2002). ISO 9001 as an audit frame for integrated quality management in meat supply chains: The example of Scottish beef. Managerial Audit Journal 17(1):79-85.
Crossref
|
|
|
|
|
Seth N, Deshmukh SG, Vrat P (2005). Service quality models: A review. International Journal of Quality and Reliability Management 22(9):913-949.
Crossref
|
|
|
|
|
Silverman BG, Bharathy GK, Nye B, Kim GJ, Roddy M, Poe M (2010). M&S Methodologies: A systems Approach to the Social Sciences. In. Sokolowski JA, Banks CM (eds). Modeling and simulation fundamentals: Theoretical underpinnings and practical domains. New Jersey: John Wiley & Sons, Inc. Publication p. 227-270.
Crossref
|
|
|
|
|
Spreng RA, Mackoy RD (1996). An empirical examination of a model of perceived service quality and satisfaction. Journal of Retailing 72(2):201-214.
Crossref
|
|
|
|
|
Tatum JD, Belk KE, George MH, Smith GC (2011). Identification of quality management practices to reduce the incidence of retail beef tenderness problems: Development and evaluation of a prototype quality system to produce tender beef. Journal of Animal Science 77:2112-2118.
Crossref
|
|
|
|
|
Troy JD, Kerry JP (2010). Consumer Perception and the role of science in meat industry. Meat Science 86:214-226.
Crossref
|
|