Full Length Research Paper
ABSTRACT
Obesity is a global problem due to widespread consumption of high fat diet (HFD) with implications to well-being. This study was to investigate the modulatory effect of sibutramine and normal diet on obesity-induced alteration in kidney functions and adipokines in Wistar rats. Hundred rats were divided into four groups of 25 each and fed with either normal rat chow (NRC) (group I, control group, n=25) or HFD (n=75). Obese rats were subjected to treatment with HFD (group II, Obese + HFD, n=25), Sibutramine and NRC (group III, Obese + Sibutramine + NRC, n=25); and NRC (group IV, Obese + NRC, n=25) for another 12 weeks. Five rats from each group were sacrificed, urine and blood samples collected for baseline values after the acclimatization period. Similarly, at post induction, 4, 8 and 12 weeks urine and blood samples were collected from 5 rats per group for investigations. Induction of obesity significantly (p<0.05) increased mean Lee index, urine albumin, urine albumin:creatinine ratio, serum interleukin (IL)-1β, IL-6, tumor necrotic factor (TNF)-α, interferon (IFN)-γ, leptin and decreased urine creatinine and serum adiponectin compared to control. Sibutramine treatment and withdrawal of HFD ameliorated these effects. Obesity induced renal impairment by deranging renal and inflammatory biomarkers investigated in this study. These adverse effects on the kidney were mitigated by sibutramine10 mg/kg/day and NRC by resisting the disturbance, thereby showing nephron-protective effect. The combined treatment of sibutramine with NRC reduced progression of kidney disease to a lesser extent than NRC alone suggesting nonsynergistic effect.
Key words: Adipokines, cytokines, diet modification, obesity, renal function, sibutramine, urine albumin creatinine ratio.
INTRODUCTION
Obesity is a global public health problem that has reached epidemic proportion (Farouk et al., 2015) due to rapid industrialization, adoption of western lifestyle and widespread consumption of high fat diet (Finucane et al., 2011). Covid-19-related lockdown, restricting social interaction and mass gathering, promoted sedentary lifestyle and contributed to the rise in the prevalence of obesity (Di Renzo et al., 2020). The World Health Organization (WHO, 2020) reported that obese and overweight persons almost tripled between 1975 and 2016 with about 650 million and 2 billion adults obese and overweight, respectively. In 2020, it was estimated that 21 and 12 million Nigerians were overweight and obese, respectively for persons aged 15 years and above accounting for prevalence of 20.3 and 11.6%, respectively (Adeloye et al., 2021). The adverse health repercussions of obesity are associated with shorter life expectancy with a 20% increase above the ideal weight linked to a 20% increase in the mortality rate (Field et al., 2001). There is no gainsaying that many debilitating health conditions including cardiovascular diseases, diabetes mellitus, hypertension and chronic kidney diseases (CKD) are due to obesity epidemic (Wang et al., 2011; Dimitrov et al., 2019).
Obesity has worsened the global burden of kidney disease which is consuming large portion of health care finances in developed nations as well as contributing to high morbidity and mortality in developing counties. A high body mass index is one of the strongest risk factors for new on set CKD (Kovesdy et al., 2016). Although obesity results in complex metabolic abnormalities that have wide-ranging effects on diseases affecting the kidneys, the exact mechanisms whereby obesity may worsen or cause CKD remain unclear (Farouk et al., 2015). Possible explanations to obesity-related alterations in kidney function may be due a compensatory hyper-filtration in the kidneys to match the additional metabolic work occasioned by excess body weight which may lead to raised intraglomerular pressure, kidney injury and development of albuminuria or renal impairment in the long term (Tsujimoto et al., 2014). Other studies posit that excess adipose tissue promote low grade inflammation linked to development of obesity and its co-morbidities which impact on kidney function (Zatterale et al., 2019) possibly through inflammatory cytokines and adipokines alterations (Cao, 2014).
In CKD, appropriate measures should be introduced to slow the progression of kidney function deterioration as well as to prevent the development or progression of CKD-related diseases. The Current kidney disease outcomes quality initiative (KDOQI) guidelines for CKD management recommend dietary and lifestyle modifications (Naber et al., (2021). A kidney-friendly diet may help to protect kidneys from further damage. In early kidney disease stages, the adoption of healthy diet, very low in saturated fat, might reduce weight, improve kidney function and slow progression to CKD or end stage kidney disease (Stevens and Levin, 2013). Conventional weight reduction medications such as sibutramine along with other drugs have been used in the treatment of obesity, but none have been adequately tested in advanced kidney diseases to explore and evaluate the effectiveness of sibutramine in combination with diet compared to diet alone. The mechanisms of obesity-related kidney diseases and impact of anti-obesity drugs and diet modification in kidney diseases have not been adequately investigated. This study was designed to investigate some of these mechanisms and the effects of obesity on renal function, serum adipokines as well as the impact of sibutramine and diet modification on renal function.
MATERIALS AND METHODS
This study adopted experimental design and was carried out at the Department of Physiology, University of Nigeria, Enugu Campus. Ethical clearance and approval were obtained from College of Medicine Ethical Committee, University of Nigeria, Enugu Campus. Hundred male Wistar rats, 10-12 weeks old, weighing 160-200 g were used for the study. They were purchased from the Animal House of the Faculty of Basic Medical Sciences, University of Nigeria, Nsukka. The animals were housed 5 rats per cage at room temperature, prevailing environmental conditions and 12-h light/dark cycle. The study duration was 8 months.
Experimental design
Following a two-week acclimatization, the 100 male Wistar rats were grouped into four, 25 rats per group and fed with either normal rat chow (NRC) (group I, normal group, n=25) or high fat diet (HFD) (n=75) for 6 weeks to induce obesity. Obese rats were subjected to treatment with HFD (group II, Obese + HFD, n = 25), sibutramine and NRC (group III, Obese + Sibutramine + NRC, n = 25) and NRC (group IV, Obese + NRC, n = 25) for another 12 weeks.
Five rats from each group were sacrificed, urine and blood samples collected for baseline values after the acclimatization period. Similarly, after establishment of obesity (post induction) and at 4 weeks, 8 weeks and 12 weeks, urine and blood samples were collected from 5 rats per group for investigations.
Dose and administration of the drug
The dose of sibutramine 10 mg/kg/day was used based on a previous study (Borges et al., 2013).
The dose was measured daily according to the individual’s rat weight and dissolved in 1 mL distilled water before being administered to the rats via oral gavage.
Anthropometric measurement
The rats were housed in clean cages at room temperature and day- night cycle for acclimatization. They received food and water ad libitum throughout the study duration. Body weight (wt) and length (L) were measured weekly using an electronic scale and a tape measure. Body length was measured as nose-anus length. They were used to determine the Lee index which was used to confirm obesity (Lee, 1929).
Induction of obesity
Obesity was induced by feeding the Wistar rats with HFD for 6 weeks and major fat source was lard with composition as described by Ajiboye et al. (2014). The Lee index formula was used to confirm obesity according to previous studies (Hioki et al., 2010; Bracco et al., 1983) as follows:
Lee index = ?wt (g)/length (cm) × 1000, that is, the cube root of body weight (g) divided by the nose-to-anus length (cm) and multiplied by 1000. Values more than 310 indicated obesity (Hioki et al., 2010).
Composition of normal rat chow and high fat diet
The composition of the normal diet (g/kg) is as follows: corn starch 506 g/kg, *Casilan 90 250 g/kg, lard 40 g/kg, sucrose 100 g/kg, rice husk 40 g/kg, DL-methionine 4 g/kg, Lysine 10 g/kg, **Vitamin mix 10 g/kg, and ***Mineral mix 40 g/kg. HFD was prepared according to a previous study, which included the combination of 396 g/kg, *Casilan 90 250 g/kg, lard 140 g/kg, cholesterol 10 g/kg, sucrose 100 g/kg, rice husk 40 g/kg, DL-methionine 4 g/kg, Lysine 10 g/kg, **Vitamin mix 10 g/kg, ***Mineral mix 40 g/kg (Ajiboye et al., 2014). *Casilan 90 (g 100 g−1), energy (1572 kg 100 g−1), protein (90 g), carbohydrate (0.3 g), fat (1.0 g), fibre (trace), sodium (0.03 mg), and calcium (1400 mg). **Vitamin mix (per kg of diet): thiamine hydrochloride (6 mg), pyridoxine hydrochloride (7 mg), nicotine acid (30 mg), calcium pantothenate (16 mg), folic acid (2 mg), biotin (0.2 mg), Cyanocobalamin (0.01 mg), retinol palmitate (4000 IU), cholecalciferol (100 IU), α-tocopherol acetate (50 IU), menadione (0.05 mg), and choline chloride (2 g). Mineral mix (g kg−1): CoCl2·6H2O (0.001), CuSO4·5H2O (0.079), MnSO4·7H2O (0.178), KI (0.033), NaCl (3.573), ZnCO3 (1.60), CaSO4 (11.61), MgSO4·7H2O (2.292), K2HPO4 (10.559), and FeSO4·7H2O (1.075) (Ajiboye et al., 2014).
Blood collection
The rats slept within 1-2 min of inhalation of chloroform anaesthetic agent and blood samples collected by application of direct cardiac puncture with a sterile 10 ml syringe and immediately put into a plain sterile test tube and allowed to coagulate. The blood was centrifuged at 3000 g (gravity) for 10 min to obtain serum which was transferred with a Pasteur’s pipette to the corresponding containers for dry chemistry analysis. The serum was kept in the refrigerator for 1 h 30 min at temperature of 4°C until the last sample was collected and immediately biochemical and cytometric analyses were performed.
Urine collection
Urine was collected from all rats in each group by placing the animals individually in metabolic cages at the end of each treatment period as described by Hoffman et al. (2018).
Measurement of urine albumin, urine creatinine and urinary albumin creatinine ratio (UACR)
Urine albumin was measured using a commercially available ELISA (Nephrat, Exocell) specific for rat albumin while urine creatinine concentration was measured by the Jaffe method (Toora and Rajagopal, 2002). The UACR was then calculated by dividing the albumin concentration in mg/dl by the creatinine concentration in mg/dl (National Kidney Foundation, 2002).
Cytokines and adipokines assay
The serum levels of IL-1β, IL-6, TNF-α and IFN-γ were measured by specific enzyme-linked immunosorbent assay (ELISA) as described by Diane (2008). The serum sample was incubated without dilution. The concentrations of cytokines in serum were then measured spectrophotometrically and then compared with a standard cytokine curve.
Statistical analysis
The results are presented as mean ± standard deviation, n=5 per treatment group. One-way analysis of variance (ANOVA) and Duncan’s post-hoc test were used for multi-comparison between groups. P values of 0.05 were considered statistically significant for all analyses and comparison between groups which were performed using SPSS version 23. Source of figure: Microsoft Excel 2010.
RESULTS
In all the assessed biomarkers of renal function and obesity, the changes observed for baseline or pre-induction parameters were of no statistical difference (p>0.05).
Figure 1 compares four groups of rats fed and treated differently showing the Lee index. The post-induction mean values were 294.83±0.01a, 313.04±0.02b, 315.50±0.88b, 316.58±0.79b for normal, obese, obese + sibutramine and obese + NRC, respectively indicating a significantly (<0.05) higher Lee index of the obese compared to the normal fed group. Mean values at 4 weeks were: normal (296.66±1.17a), obese (319.15±1.16b), obese + sibutramine (314.58±0.82b), obese + NRC (315.30±0.51b); 8 weeks normal (299.77±4.42a), obese (325.06±0.86b), obese + sibutramine (312.50±0.18b), obese + NRC (313.10±1.4b); while at 12 weeks normal were (304.04±1.80a), obese (329.59±0.74d), obese + sibutramine (310.04±1.82b), obese + NRC (312.13±0.76c). All through the experimental period, the Lee index was noticed to increase in the four groups (Figure 1). After six weeks of obesity induction, HFD increased the Lee index significantly (p<0.05) in the obese, obese + sibutramine and obese + NRC groups compared to normal control group. Subsequently, the Lee index in the obese group rose steadily and significantly till the end of treatment period.
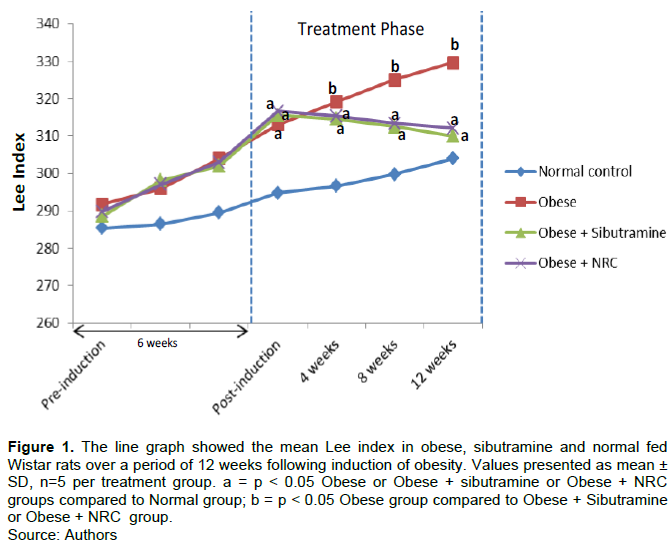
Sibutramine and NRC administration constantly lowered the Lee index but did not restore it to normal control values, which was significantly (p<0.05) observed at the 8th week until the end of the experimental period.
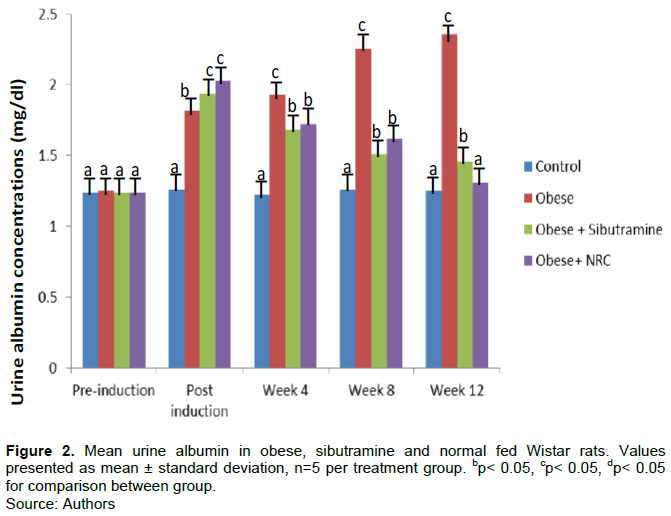
Mean urine albumin in obese, sibutramine and normal fed Wistar rats
In Figure 2, kidney function test was measured by concentration of albumin in urine sample of male Wistar rats. The mean urine albumin level at establishment of obesity were 1.26±0.03a, 1.82±0.11b, 1.94±0.16c, and 2.03±0.16c for normal, obese, obese + sibutramine and obese + NRC fed rats, respectively. At 4 weeks: normal (1.22±0.03a), obese (1.93±0.08c), obese + sibutramine (1.68±0.11b), obese +NRC (1.72±0.10b); 8 weeks: normal (1.26±0.02a), obese (2.26±0.16c), obese + sibutramine (1.51±0.04b), obese + NRC (1.62±0.12b); 12 weeks: normal (1.25±0.04a), obese (2.36±0.10c), obese + sibutramine (1.46±0.07b), obese + NRC (1.31±0.06a). A significantly higher (p<0.05) levels of albumin occurred in the urine of obese rats in comparison to the control group. Sibutramine administration and withdrawal of HFD significantly lowered (p<0.05) urine albumin level in a time dependent manner.
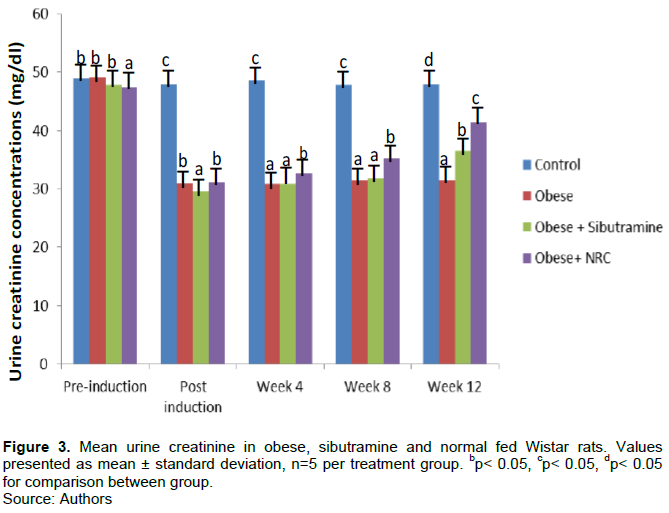
Mean urine creatinine in obese, sibutramine and normal fed Wistar rats
The result of Figure 3 illustrated mean urine creatinine in obese, sibutramine and normal fed Wistar rats within treatment period. The values at the point of confirmation of obesity were 47.99±0.82c, 30.96±0.70b, 29.64±0.65a, and 31.14±0.83b for normal, obese, obese + sibutramine and obese + normal fed rats, respectively indicating a significantly (<0.05) lower urine creatinine level in the obese compared to the normal fed group. At 4 weeks: normal (48.63±0.88c), obese (30.87±1.03a), obese + sibutramine (30.91±0.61a), obese +normal (32.79±0.80b); 8 weeks: normal (47.89±0.83c), obese (31.40±0.77a), obese + sibutramine (31.83±0.93a), obese + normal (35.29±0.44b); while at 12 weeks: normal (48.01±0.83d), obese (31.51±1.39a), obese + sibutramine (36.53±0.69b), obese + normal (41.51±1.49c).
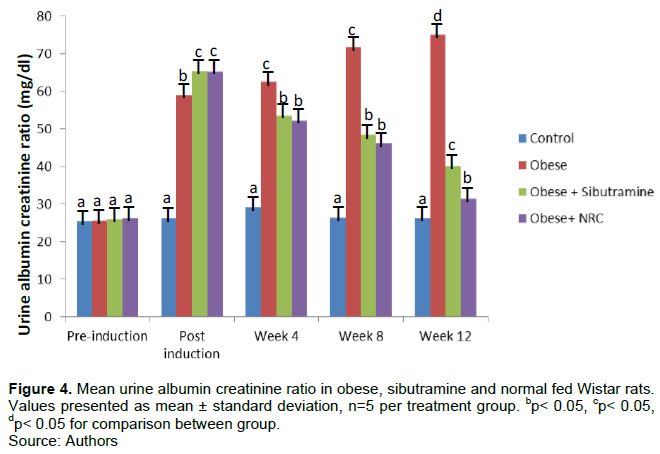
Mean urine albumin creatinine ratio in obese, sibutramine and normal fed Wistar rats
Figures 4 show kidney function assessed by urine albumin creatinine ratio (UACR). Mean UACR when rats became obese were 26.20±0.91a, 58.98±4.52b, 65.46±4.32c, and 65.18±6.42c for normal, obese, obese + sibutramine and obese + normal fed rats, respectively. At 4 weeks: normal (29.20±6.27a), obese (62.52±3.17c), obese + sibutramine (53.52±4.00b), obese + NRC (52.12±3.71b); 8 weeks: normal (26.46±0.68a), obese (71.91±6.02c), obese + sibutramine (46.26±3.56b), obese + NRC (48.46±1.44b); 12 weeks: normal (26.14±1.12a), obese (75.00±5.79d), obese + sibutramine (40.06±2.07c), obese + NRC (31.50±0.98b). Obese rats had significantly (<0.05) higher mean UACR compared to control. Treatment with sibutramine and withdrawal of HFD significantly (p<0.05) lowered UACR in a time dependent manner.
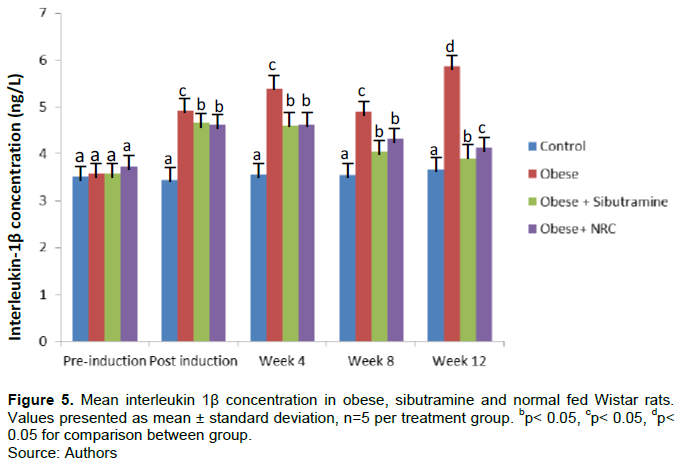
Mean interleukin 1β concentration in obese, sibutramine and normal fed Wistar rats
As shown in Figure 5, the mean serum IL-1β values were: post-induction 3.44±0.22a, 4.91±0.17c, 4.66±0.15b, and 4.62±0.19b, for normal, obese, obese + sibutramine, and obese + NRC, respectively; 4 weeks: normal (3.56±0.09a) , obese (5.39±0.28c,), obese + sibutramine (4.61±0.13b), obese + normal (4.62±0.18b); 8 weeks normal (3.55±0.15a), obese (4.90±1.04c), obese + sibutramine (4.05±0.12b), obese + normal (4.32±0.19b); while at 12 weeks normal (3.65±0.27a), obese (5.86±0.07d), obese + sibutramine (3.90±0.09b), obese + normal (4.13±0.05c). The findings demonstrated that, when compared with the control group, HFD caused a significant increase (p<0.05) in interleukin 1β in the serum of obese rats. The serum interleukin 1β level of obese rats treated with sibutramine 10 mg/body weight plus NRC as well as those treated with only NRC however, decreased significantly (<0.05) in a time dependent manner.
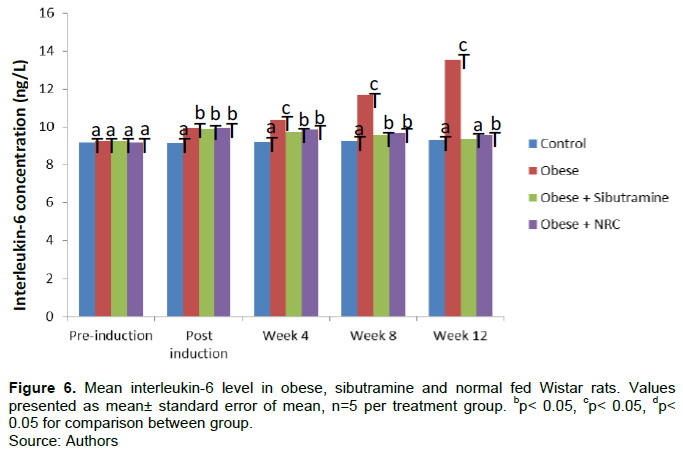
Mean interleukin-6 level in obese, sibutramine and normal fed Wistar rats
In Figure 6, exposure of the animals to HFD resulted to significant increase (p<0.05) in serum IL-6 in the obese group throughout treatment period when compared with control group. Administration of sibutramine and NRC lowered the IL-6 levels significantly (p<0.05) compared to the obese group. Mean values of IL-6 at post-induction: 9.15±0.08a, 9.95±0.09b, 9.90±0.26b, 9.95±0.16b for control, obese, obese + sibutramine and obese + normal fed rats, respectively. Serum IL-6 concentration at 4 weeks for the various groups: control (9.21±0.05a), obese (10.33±0.12c), obese + sibutramine (9.76±0.10b), obese + NRC (9.87±0.15b); at 8 weeks: control (9.25±0.06a), obese (11.65±0.21c), obese + sibutramine (9.57±0.08b), obese + normal (9.66±0.23b); while at 12 weeks: control (9.29±0.09a), obese (13.55±0.26c), obese + sibutramine (9.37±0.07a), obese +NRC (9.54±0.06b).
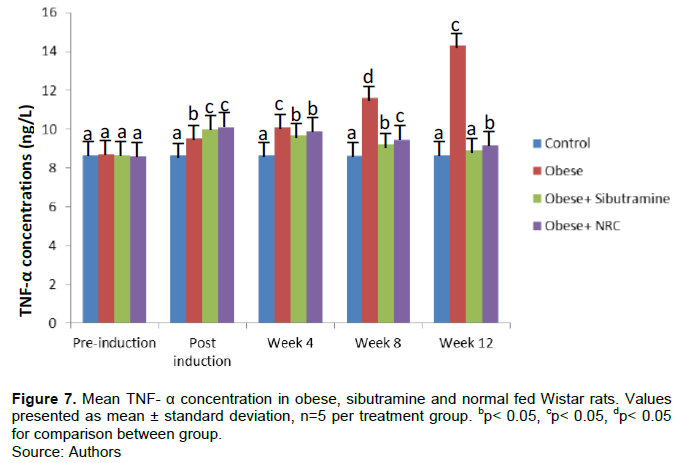
Mean serum TNF-α concentration in obese, sibutramine and normal fed Wistar rats
As demonstrated in Figure 7, post-induction mean serum TNF-α levels stood at: control (8.66±0.11a), obese (9.51±0.20b), obese + sibutramine (9.97±0.48c), obese + NRC (10.09±0.39c). At 4 weeks: control (8.64±0.09a), obese (10.10±0.13c), obese + sibutramine (9.69±0.14b), obese + NRC (9.88±0.24b); 8 weeks: control (8.62±0.09a), obese (11.61±0.19d), obese + sibutramine (9.22±0.09b), obese + NRC (9.46±0.27c); 12 weeks control (8.65±0.05a), obese (14.30±0.29c), obese + sibutramine (8.88±0.20a), obese + NRC (9.14±0.17b). The result revealed that mean TNF-α level values rose significantly (<0.05) in the obese group compared to the normal fed group. Treatment of the animals with sibutramine and withdrawal HFD led to significantly (<0.05) reduction of TNF-α levels in a time dependent manner.
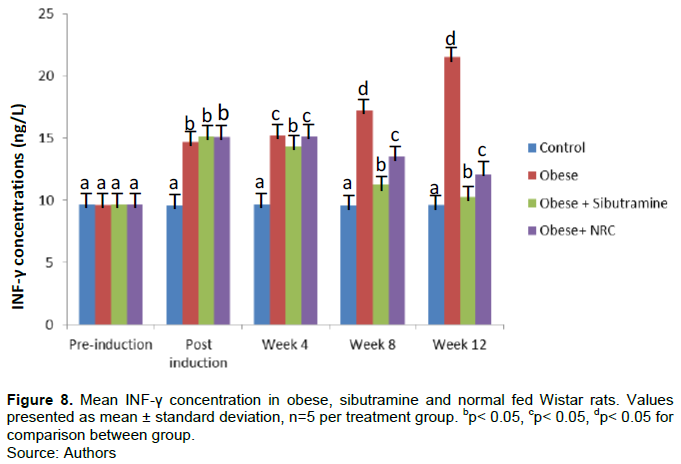
Mean INF-γ concentration in obese, sibutramine and normal fed Wistar rats
The mean INF-γ concentration in obese, sibutramine and normal fed Wistar rats over a 12-week treatment period showed that at post-induction: control (9.57±0.06a), obese (14.70±0.77b), obese + sibutramine (15.16±0.27b), obese + NRC (15.12±0.81b). At 4 weeks: control (9.66±0.08a), obese (15.24±0.26c), obese + sibutramine (14.33±0.50b), obese +NRC (15.18±0.82c); 8 weeks: control (9.54±0.06a), obese (17.22±0.64d), obese + sibutramine (11.26±0.39b), obese + NRC (13.53±0.32c); 12 weeks control (9.62±0.07a), obese (21.55±0.42d), obese + sibutramine (10.30±0.32b), obese + NRC (12.12±0.36c). The result indicated a significantly (<0.05) higher serum INF-γ level in the obese compared to the control group. Weight reduction therapy with sibutramine and diet modification significantly (p<0.05) lowered serum INF-γ levels (Figure 8).
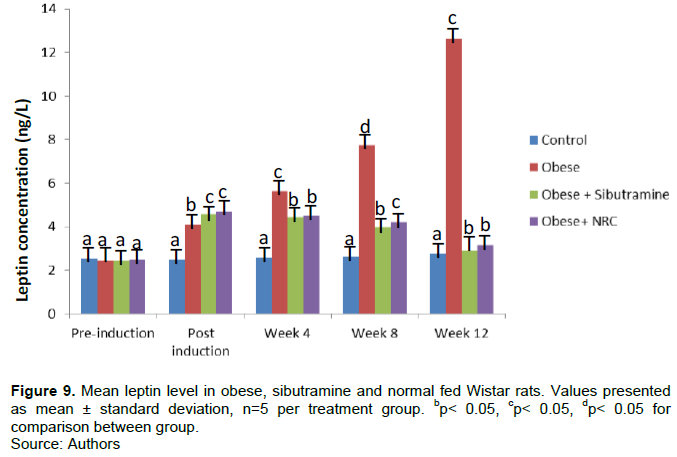
Mean serum leptin concentration in obese, sibutramine and normal fed Wistar rats
Figure 9 compares serum leptin concentration in four groups of Wistar rats fed and treated differently over a 12-week treatment period with 2.49±0.03a, 4.12±0.17b, 4.56±0.15c, and 4.70±0.11c representing control, obese, obese + sibutramine and obese + NRC VALUES when obesity was first established. The serum leptin at 4 weeks were: control (2.60±0.06a), obese (5.62±0.38c), obese + sibutramine (4.45±0.19b), obese + NRC (4.49±0.09b); 8 weeks: control (2.62±0.10a), obese (7.74±0.32d), obese + sibutramine (3.96±0.12b), obese + NRC (4.21±0.12c); while at 12 weeks: control (2.74±0.07a), obese (12.63±0.32c), obese + sibutramine (2.89±0.20a,b,2), obese + normal (3.15±0.08b). Induction of obesity significantly increased serum levels of leptin in the obese rats when compared with the control values. However, treatment of the obese rats with sibutramine, NRC and withdrawal of HFD significantly lowered leptin levels when compared with the obese untreated group (p<0.05).
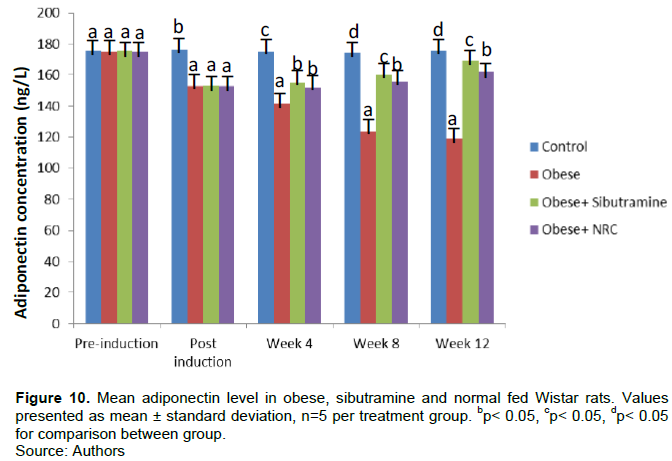
Mean adiponectin level in obese, sibutramine and normal fed Wistar rats
Figure 10 illustrates mean serum adiponectin concentration and at establishment of obesity, mean serum levels were 176.50±1.74b, 152.97±3.53a, 153.35±2.12a, and 153.12±3.33a for control, obese, obese + sibutramine and obese + NRC fed rats, respectively. The serum adiponectin at 4 weeks were: normal (175.22±0.56c), obese (141.63±2.83a), obese + sibutramine (155.25±3.81b), obese + normal (152.19±2.05b); at 8 weeks normal (174.23±0.49d), obese (123.85±2.24a), obese + sibutramine (160.04±3.31c), obese + normal (155.61±2.92b); while at 12 weeks normal (175.64±0.65d), obese (119.12±1.54a), obese + sibutramine (169.54±1.93c), obese + normal (162.13±2.13b). The serum levels of adiponectin decreased significantly in a time dependent manner in the obese rats treated with HFD compared to the control. On the other hand, adiponectin levels increased in the group of obese rats treated with sibutramine as well as NRC but sibutramine had significantly higher raising effect than NRC alone (P<0.05).
DISCUSSION
One of the main global health consequences of extensive indulgence in high fat diet is obesity (Finucane et al., 2011). The adverse health repercussions of obesity range from metabolic syndrome, type 2 diabetes mellitus, insulin resistance, dyslipidemia, cardiovascular diseases, to kidney diseases (Field et al., 2001). Obesity has worsened the global burden of chronic kidney disease (CKD) which consumes large portion of health care finances in developed countries and contributes to high morbidity and mortality in developing counties. It may be possible to identify renal injury brought about by obesity by measuring glomerular filtration rate (GFR), urine albumin creatinine ratio (UACR) as well as serum levels of adipokines moderated by obesity and its co-morbid conditions (Nwachukwu et al., 2016; National Kidney Foundation, 2002).
In this study, the effects of exposure of male Wistar rats to HFD and associated alterations in UACR and serum adipokines concentrations to unravel possible mechanisms of obesity associated renal diseases were investigated. The study also investigated the impact of treatment with a weight reduction drug, sibutramine and withdrawal effect of HFD (diet modification) on the parameters measured. The parameters evaluated include Lee index, urine albumin, urine creatinine, UACR, an early marker of kidney function; serum adipokines like interleukin IL-1β, IL-6, TNF-α, IFN-γ, leptin and adiponectin. It is evident from the result that consumption of HFD affected Lee index. Beyond the mean baseline values, the Lee index was significantly higher in the obese group compared to control group per treatment period. Obesity significantly increased mean Lee index in a time dependent manner, while sibutramine and diet modification significantly decreased Lee index at 12 weeks (Figure 1). Hariri et al. (2010) found that a HFD increased body weight and induced obesity. This may be explained by chronic low grade inflammation found in adipose tissue of obese subjects (Wang and Liao 2012) which is considered a crucial risk factor for growing prevalence of obesity and its related comorbidities, including chronic kidney disease (Zatterale et al., 2019).
Although baseline or pre-induction results for the obese group did not differ with control, there was significant increase in post induction values of urine albumin and UACR but decreased urine creatinine in the obese rats when compared with the control suggests renal impairment and reduced GFR. However, treatment of the obese rats with sibutramine and withdrawal of high fat diet significantly lowered urine albumin (Figure 2) and UACR (Figure 4), but increased urine creatinine (Figure 3) level in comparison with the obese untreated group. Interestingly, weight reduction strategy via NRC alone had higher lowering effect on UACR levels (improved renal function) than combined treatment with sibutramine and NRC which was significant at 12 weeks. Sibutramine may have accounted for this non-synergistic effect observed indicating that the drug may be associated with declining renal function. This finding supports previous study which linked sibutramine to increased blood pressure which was previously regarded as a cause and consequence of renal failure (Nwachukwu et al., 2016; Kramer et al., 2009). The study is in tandem with the findings of Lin et al. (2010) that higher dietary intake of animal fat may increase risk for microalbuminuria, a predictor of kidney impairment. Recent studies, from Asia and Europe posit that obesity is correlated with UACR (Minoo et al., 2015; Tamba et al., 2010; Seo et al, 2016), while others found no a correlation (Dittmann et al., 2013). The observed time effect showed that renal impairment or other associated co-morbidities arising from obesity may be dependent on the duration of obesity. Physiologic abnormalities or damage of glomerular endothelial cells and glomerular basement membrane may explain the albuminuria or elevated UACR observed in this study (Forman et al., 2008). A study reported that incomplete glomerular filtration barrier results in excess albumin leakage to the proximal tubular fluid which may not be completely reabsorbed by proximal tubular cells (Lazzara and Deen, 2007) with progressive renal damage over time. Obesity associated increased metabolic demand may also explain the glomerular hyper-filtration leading higher levels of albumin excretion and elevated UACR observed in this study. This study illustrated that the concentration of serum IL-1β, IL-6, TNF-α, IFN-γ and leptin increased significantly while adiponectin decreased significantly per treatment period in the different groups of obesity induced renal impaired rats compared to control group implying that the renal impairment observed may be sequel to cytokines inflammatory effects on the kidneys. Furthermore, sibutramine therapy and withdrawal of HFD significantly lowered serum IL-1β (Figure 5), IL-6 (Figure 6), TNF-α (Figure 7), IFN-γ (Figure 8), leptin (Figure 9) levels and significantly raised adiponectin (Figure 10), compared to the obese untreated group with time effect. The result also showed that sibutramine lowered serum IL-1β, IL-6, TNF-α, IFN-γ and leptin levels better than NRC alone. It is clear from this study that reduced kidney function evidenced by significantly higher UACR is among the manifestations of inflammatory cytokines in prolonged obesity. Imig and Rayn (2013) reported that inflammatory cytokines have a central role as both mediators of immune function and initiators of renal injury which may be a common underlying mechanism for both chronic and acute renal diseases regardless of the cause although, some cytokines like IFN-γ have immune modulatory roles that can ameliorate as well as promote kidney disease diseases.
As Kern et al. (2018) found obesity induced chronic low-grade inflammation, recruits and activates immune cell subsets in adipose tissues which increase IL-1β, IL-6 and TNF-α resulting in impaired insulin action in metabolic tissues as well as but also favour complications of obesity like kidney diseases. This study demonstrated that leptin and adiponectin were differentially expressed adipokines in obesity and kidney impairment. Leptin secretion is primarily from white adipose tissues and increase blood level is typically linked to fat stores which signal the adequacy of adipose energy stores. Leptin binds to its receptor, LepRb in the hypothalamus to directly promote satiety, suppress food intake as well as permit energy expenditure and glucose regulation (Flak and Myers, 2016). Leptin may also act on the limbic system by stimulating dopamine uptake which leads to a feeling of fullness (Fernández-Sánchez et al., 2011). Leptin’s role in developing obesity and renal dysfunction observed in our study could be due to inflammatory and oxidative actions (Ghantous et al., 2015) as well as sympathetic activation and vaso-constrictive properties (Hall et al., 1999). The finding supports earlier report which noted that leptin levels are directly associated with adipose tissue mass, while the concentrations of adiponectin, an anti-inflammatory hormone are reduced or down regulated in obesity (Ghantous et al., 2015) which may be responsible for the development of obesity-related kidney disease observed.
CONCLUSION
Obesity induced renal impairment by deranging renal and inflammatory biomarkers investigated in this study. These adverse effects on the kidney were mitigated by sibutramine10 mg/kg/day and normal diet (NRC) by resisting the disturbance, thereby showing nephron-protective effect. The combined treatment of sibutramine with NRC reduced progression of kidney disease to a lesser extent than NRC alone suggesting non-synergistic effect.
CONFLICT OF INTERESTS
The authors have not declared any conflict of interests.
REFERENCES
|
Adeloye D, Ige-Elegbede JO, Ezejimofor M, Owolabi EO, Ezeigwe N, Omoyele C, Mpazanje RG, Dewan MT, Agogo E, Gadanya MA, Alemu W, Harhay MO, Auta A and Adebiyi AO (2021). Estimating the prevalence of overweight and obesity in Nigeria in 2020: a systematic review and meta-analysis. Annal of Medicine 53(1):495-507. |
|
|
Ajiboye TO, Akinpelu SA, Muritala HF (2014). Trichosanthes cucumerina fruit extenuates dyslipidemia, protein oxidation, lipid peroxidation and DNA fragmentation in the liver of high-fat diet-fed rats. Journal of Food Biochemistry 38(5):480-490. |
|
|
Borges CS, Missassi G, Pacini ESA, Kiguti LRA, Sanabria M, Silva RF (2013). Slimer or fertile? Pharmacological mechanisms involved in Reduced Sperm Quality and Fertility in Rats Exposed to Anorexigen Sibutramine. PLoS ONE 8(6):66091. |
|
|
Cao H (2014). Adipocytokines in obesity and metabolic disease. Journal of Endocrinology 220:2. |
|
|
Diane A (2008). Interleukin-6, TNF-alpha and interleukin-1 beta levels in blood and tissue in severely burned rats. European Cytokine Network 19:1-7. |
|
|
Di Renzo L, Gualtieri P, Pivari F (2020). Eating habits and lifestyle changes during COVID-19 lockdown: an Italian survey. Journal of Translational Medicine 18:229. |
|
|
Dimitrov IV, Kamenov VI, Boyadjiev NP, Georgieva KN, Bivolarska AV, Draganova-Filipova MN, Angelova-Hristova PA, Delchev S, Daskalova E, Gerginska F, Stankova TR, Gramatikov V (2019). Impact of a high-fat diet on the development of chronic inflammation in heart of Wistar rats. Folia Medica (Plovdiv) 61(3):404-410 |
|
|
Dittmann K, Hannemann A, Wallaschofski H (2013). U-shaped association between central body fat and the urinary albumin-to- creatinine ratio and microalbuminuria. BMC Nephrology 14:87. |
|
|
Farouk H, Mahmould SS, El-Sayeh BA, Sharaf OA (2015). Effect of grapefruit juice and sibutramine on body weight in obese rats. African Journal of Pharmacy and Pharmacology 9(8):265-273. |
|
|
Fernández-Sánchez A, Madrigal-Santillán E, Bautista M, Esquivel-Soto J, Morales-González A, Esquivel-Chirino C, Durante-Montiel I, Sánchez-Rivera G, Valadez-Vega C, Morales-González JA (2011). Inflammation, oxidative stress, and obesity. International Journal Molecular Science 12(5):3117-3132. |
|
|
Field AE, Coakley EH, Must A, Spadano JL, Laird N, Dietz WH (2001). Impact of over weight on the risk of developing common chronic diseases during a 10-year period. Archive of Internal Medicine 161:1581-1586 |
|
|
Finucane MM, Stevens, GA, Cowan MJ, Danaei G, Lin JK, Paciorek CJ, Singh GM, Gutierrez HR, Lu Y, Bahalim AN (2011). National, regional, and global trends inbody-mass since 1980, systematic analysis of health examination surveys and epidemiological studies with 960 country-years and 9.1 million participants. Lancet 377:557-567. |
|
|
Flak JN, Myers MG Jr (2016). Minireview: CNS Mechanisms of Leptin Action. Molecular Endocrinology 30(1):3-12. |
|
|
Forman JP, Fisher NDL, Schopick EL, Curhan GC (2008). Higher Levels of Albuminuria within the Normal Range Predict Incident Hypertension. Journal of American Society of Nephrology 19:10. |
|
|
Ghantous CM, Azrak Z, Hanache S, Abou-Kheir W, Zeidan A (2015). Differential Role of Leptin and Adiponectin in Cardiovascular System. International Journal of Endocrinology 2015:534320. |
|
|
Hall JE, Brands MW, Henegar JR (1999). Mechanisms of hypertension and kidney disease in obesity. Annals of New York Academy of Sciences 18(892):91-107. |
|
|
Hariri N, Thibault L (2010). High-fat diet-induced obesity in animal models. Nutrition Respiratory Review 23:270-299. |
|
|
Hioki C, Yoshida T, Kogure A, Yoshimoto K, Shimatsu A (2010). Growth Hormone Administration Controls Body Composition Associated with Changes of Thermogenesis in Obese KK-Ay Mice. The Open Endocrinology Journal 4:3-8. |
|
|
Hoffman JF, Fan AX, Neuendorf EH, Vergara VB, Kalinich JF (2018). Hydrophobic Sand Versus Metabolic Cages: A Comparison of Urine Collection Methods for Rats (Rattus norvegicus). Journal of American Association Laboratory Animal Science 57(1):51-57. |
|
|
Imig JD, Ryan MJ (2013). Immune and inflammatory role in renal disease. Comprehensive Physiology 3:957-976. |
|
|
Kern L, Mittenbühler MJ, Vesting AJ, Ostermann AL, Wunderlich CM, Wunderlich FT (2018). Obesity-Induced TNFα and IL-6 Signaling: The Missing Link between Obesity and Inflammation-Driven Liver and Colorectal Cancers. Cancers (Basel) 11(1):24. |
|
|
Kovesdy CP, Susan LF, Zoccali C (2016). Obesity and Kidney Diseases:Hidden Consequences of the Epidmic. Canadian Journal of Kidney Health and Disease 4:1-10. |
|
|
Kramer H, Tuttle KR, Leehey D, Luke A, Durazo-Arvizu R, Shoham D, Cooper R, Beddhu S (2009). Obesity management in adults with CKD. American Journal of Kidney Disease. 53(1):151-165. |
|
|
Lazzara MJ, Deen WM (2007). Model of albumin re-absorption in the proximal tubule. American Journal Physiology - Renal Physiology 292:430-439. |
|
|
Lee MO (1929). Determination of the surface area of the white rat with its application to the expression of metabolic results. American Journal of Physiology 89:24-33. |
|
|
Lin J, Hu FB, Curhan GC (2010). Associations of Diet with Albuminuria and Kidney Function Decline. Clinical Journal of American Society of Neprology 5(5):836-843. |
|
|
Minoo F, Mahdavi-Mazde M, Abbasi MR (2015). Impact of the severity of obesity on microalbuminuria in obese normotensive non-diabetic individuals. Journal of Renal Injury Prevention 4:34-38. |
|
|
Naber T, Purohit S (2021). Chronic Kidney Disease: Role of Diet for a Reduction In the severity of the Disease. Nutrients. |
|
|
National Kidney Foundation (2002). K/DOQI clinical practice guidelines for chronic kidney disease: evaluation, classification, and stratification. American Journal of Kidney Disease 39:S1-S266. |
|
|
Nwachukwu DC, Agu FU, Nwachukwu ZN (2016). Pattern of renal impairment among hypertensive subjects in Umuahia, South East Nigeria. International journal of Medicine and Medical Sciences 8(5):45-50. |
|
|
Seo WJ, Lee GM, Hwang JH (2016). Association between body mass index, waist circumference and prevalence of microalbuminuria in Korean adults of age 30 years and older without diabetes, hypertension, renal failure, or overt proteinuria: the 2013 Korean National health and nutrition examination survey. Korean Journal of Family Medicine 37:57-63. |
|
|
Stevens PE, Levin A (2013). Kidney Disease: Improving Global Outcomes Chronic Kidney Disease Guideline Development Work Group Members. Evaluation and management of chronic kidney disease: improving global outcomes 2012 clinical practice guideline. Annals of Internal Medicine 158(11):825-830. |
|
|
Tamba S, Nakatsuji H, Kishida K (2010). Relationship between visceral fat accumulation and urinary albumin-creatinine ratio in middle-aged Japanese men. Atherosclerosis 211:601-605. |
|
|
Toora BD, Rajagopal G (2002). Measurement of creatinine by Jaffe.s reaction-determination of concentration of sodium hydroxide required for maximum colour development in standard, urine and protein free filtrate of serum. India Journal Experimental Biology 40(3):352-354. |
|
|
Tsujimoto T, Sairenchi T, Iso H (2014). The dose-response relationship between body mass index and the risk of incident stage ≥3 chronic kidney disease in a general Japanese population: the Ibaraki prefectural health study (IPHS). Journal of Epidemiology 24:444-451. |
|
|
Wang CY, Liao JK (2012). A mouse model of diet-induced obesity and insulin resistance. Methods Molecular Biology 821:421-433. |
|
|
Wang S, Reed DB, Goli S (2011). Blood leptin and C-reactive protein provide more sensitive assessment than blood lipids and other inflammatory biomarkers in overweight university students. Nutrition Research 31:586-593. |
|
|
World Health Organization (2020). Obesity and overweight. |
|
|
Zatterale F, Longo M, Naderi J, Raciti GA, Desiderio A, Miele C, Beguinot F (2019). Chronic Adipose Tissue Inflammation Linking Obesity to Insulin Resistance and Type 2 Diabetes. Frontiers in Physiology 10:103389. |
|
Copyright © 2024 Author(s) retain the copyright of this article.
This article is published under the terms of the Creative Commons Attribution License 4.0


