Full Length Research Paper

ABSTRACT
This manuscript shows a characterisation of critical agricultural household features that are fundamental for performance of agricultural activities in Uganda. Data from the 2018 Annual Agricultural Survey show that these households are exposed to a series of circumstances that make agriculture a challenging enterprise to undertake, but at the same time essential for subsistence. These challenges are mainly associated with large segments of agricultural population dedicated to farming in reduced land-cropping areas, generalized practice of subsistence farming, limited land tenure rights, critical low levels of education affecting agricultural productivity, limited use of improved agricultural inputs (fertilizers, pesticides, and seeds), and marginal use of irrigation practices. These challenges are of intra and extra-farm nature, and as such a holistic vision to address them is needed.
Key words: Agricultural households, land, education, agricultural inputs. Uganda.
INTRODUCTION
The purpose of this paper is to provide a characterisation of specific aspects of agricultural households in Uganda, which practitioners and policy makers may find useful to inform policy interventions and incentives to improve small-scale agriculture. This characterisation is circumscribed to critical features that are fundamental for agricultural activities, namely households’ engagement in agricultural activities, land-holding sizes for agricultural activities, land tenure systems, households’ education, and input use in agricultural production systems. This characterisation is based on data coming from the Annual Agricultural Survey 2018 (AAS, 2018), which is the latest dataset available for public use.
THE 2018 ANNUAL AGRICULTURAL SURVEY
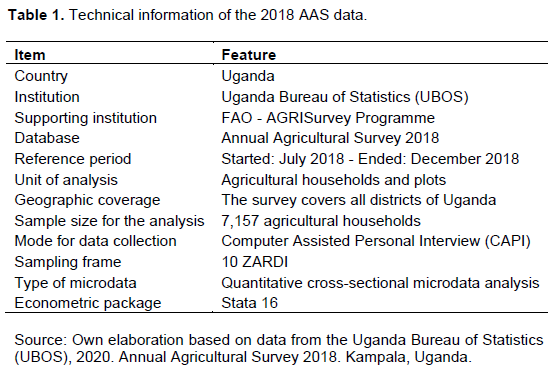
Data for the analysis came from the 2018 Annual Agricultural Survey (2018 AAS), which is the annual national agricultural survey collected, processed, analysed and disseminated by the Uganda Bureau of Statistics (UBOS) with the technical support of FAO’s AGRISurvey Programme. The main objective of the survey was to collect data on the crops harvested by period, thus covering the entire agricultural year.
Table 1 present’s technical information related to reference period, unit of analysis, geographic coverage, sample size and other technical inputs associated to the2018 AAS. The sampling frame was divided into ten Zonal Agricultural Research and Development Institutes (ZARDI). Created by the National Agricultural Research Organization (NARO), each ZARDI is a geographical area that share common features: similar climate conditions, land use, and cropping patterns. NARO divided the country into ten ZARDIs or agro-ecological areas. Most of the findings of this study present results at ZARDI level.
THE AGRICULTURAL SECTOR IN NATIONAL PERSPECTIVE
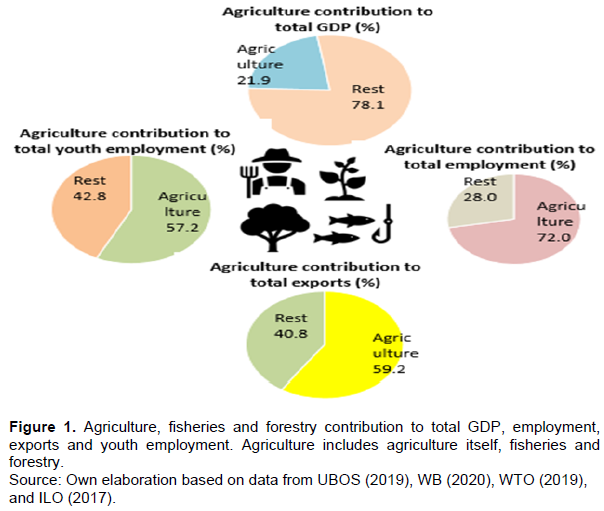
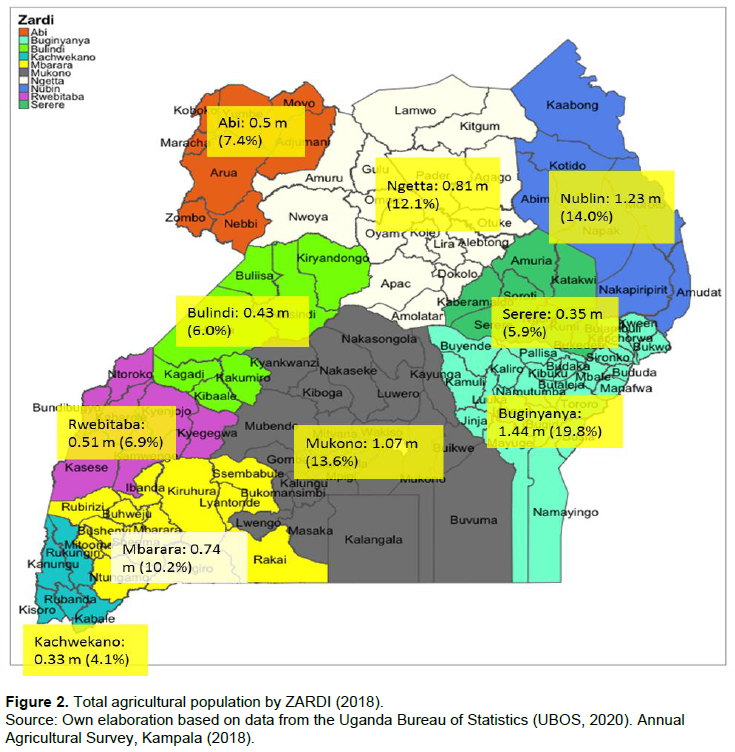
The agricultural sector is the cornerstone of Uganda’s economy (Figure 1). It contributed with 21.9% of total Ugandan GDP in 2019 (UBOS, 2021), employed 72% of the total Ugandan working population in 2020 (WB, 2020), accounted for 59.2% of total national exports in 2019 (WTO, 2019), and provided 57% of the total youth employment in 2015 (ILO, 2017). The importance of the agricultural sector is reiterated in various national development strategies, such as the 2021-2025 National Development Plan (NDPIII), the Uganda Vision 2040, and the 2021-2025 NDPIII Agro-industrialization Programme Implementation Action Plan (AgroPIAP), which all regard agriculture as the key economic sector able to allow the country to transit to a middle-income status by 2040 (Uganda Vision 2040). A broad overview of the agricultural population in Uganda shows that about 79% live in rural areas and the remaining 21% is urban based (FAO, 2021). Uganda had in 2018 an estimated 7.4 million agricultural households, who were heterogeneously distributed across the different ZARDI of the country (Figure 2). Buginyanya was the most populous ZARDI (1.44 million agricultural households or 19.8%), while Kachwekano was the least populous with 0.33 million agricultural households (4.1%). Agricultural households are concentrated in four ZARDIs (Buginyanya, Nublin, Mukono and Ngetta) where about 60% of the agricultural households currently live.
CRITICAL HOUSEHOLD FEATURES FUNDAMENTAL FOR AGRICULTURAL ACTIVITIES
Households’ engagement in agricultural activities
The main income-generating occupation of these households is agriculture-related activities. To confirm the extent to which this claim is true, the AAS 2018 enquired household heads on the main economic activity where they spend most of their time. Their responses were categorized into dichotomic options: “mainly engaged in agricultural activities” and “mainly engaged in non-agricultural activities”. Results show that in average 84% of all agricultural household heads are mainly engaged in agricultural activities. Disaggregated by gender, 89% of all female household heads were mainly engaged on agricultural activities for their livelihoods, while 79% of all male household heads were mainly engaged on agriculture for their livelihoods (Figure 3). At ZARDI level, generally higher shares of female household heads, as compared to male household heads, are mainly engaged into agricultural activities. This comparison is highest in Mbarara (30%), Kachwekano (27%), and Mukono (13%). Hence, these figures confirm that the main income-generating occupation that these households undertake is agriculture-related activities. This finding is confirmed in a WB publication (2019) that estimates that 70% of Uganda’s population depend on agriculture as the main source of livelihood, consumption and income. Such a large share of population depending on agriculture clearly indicates that the development of the agricultural sector is not only important to improve national food and nutrition security, but also to achieve wider socio-economic development.
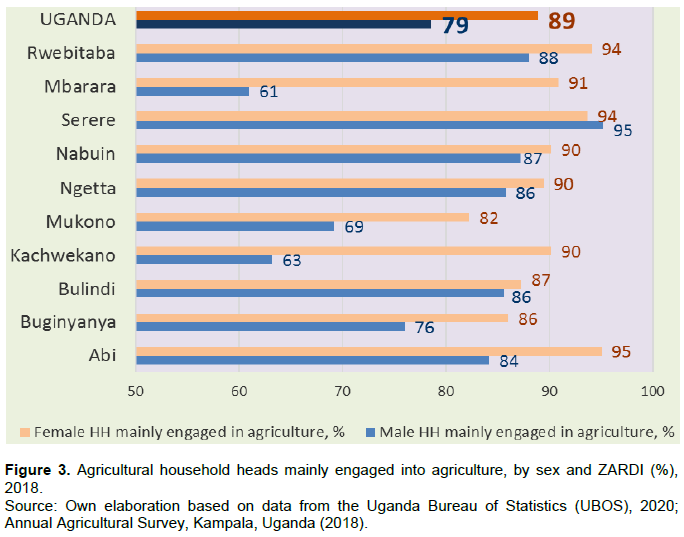
Figure 3 also shows that less male household heads were engaged into agricultural activities as compared to female household heads. This suggests that women’s workload becomes increased not only doing agricultural work, but also undertaking traditional household chores such as raising children, cooking, cleaning and other customary domestic chores. In addition, it suggests that 21% of male household heads could have been engaged in off-farm income earning opportunities which could imply out-migration.
Land-holding size
The average agricultural land holding in Uganda is relatively small (Figure 4). That is, in average each agricultural household has 1.35 ha to use it in both agricultural and non-agricultural activities. Out of this, on average 0.73 ha are for cropping, while the remaining 0.62 ha correspond to other land uses, such as fallow, pasture, and forest land uses. At ZARDI level, the largest average plot for cropping was found in Bulindi (1.44 ha/household), followed by Mukono (1.01 ha/household), Ngetta (0.98 ha/household) and Serere (0.91 ha/household). The rest varied between 0.65 and 0.78 ha/household. An exceptionally small agricultural plot was found in Nabuin (0.08 ha/household in average), which is explained by the fact that farmers in this ZARDI are mainly engaged in livestock activities that take place in communal lands. Small agricultural plots are largely the result of an inheritance system where land has been divided among many household members, mainly male youths (OXFAM, 2014). This has occurred by generations resulting in fragmented and smaller agricultural plots (EPRC, 2000).
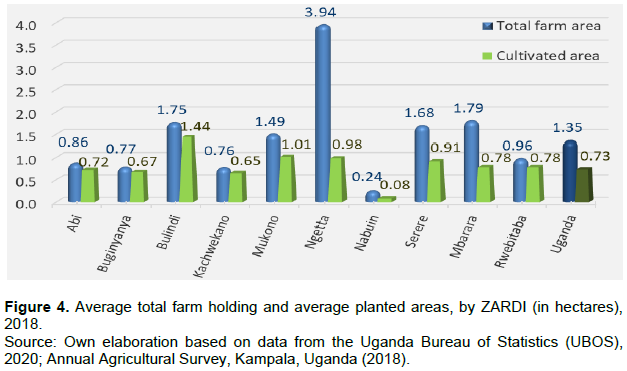
Having in average 0.73 ha for cropping indicate that most agricultural households in Uganda practice small-scale farming in the form of subsistence agriculture (AGRA, 2019; Jjagwe et al., 2020), meaning that production is small and mainly for home consumption. Subsistence agriculture is related to limited farm conditions (such as small plots, limited or no use of improved agricultural inputs such as fertilisers, certified seeds and/or pesticides) that prevent from generating adequate income from farming. Land area used for agriculture remains within the realm of subsistence agriculture, and as such peasantry and livelihoods are extremely vulnerable.
Land tenure
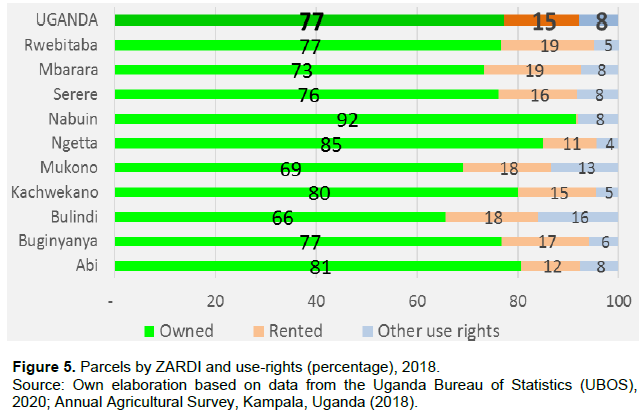
Such small agricultural lands are owned by households under customary regulations of their communities. That is, agricultural households own under customary traditions 77% of the parcels they use for agricultural and non-agricultural activities, they rent 15% of the parcels they use, and the remaining 8% is occupied under the category “Other use rights”, which means that these lands were occupied under public or communal use, or the rights to use them is unclear or under legal dispute (Figure 5).
Anchored on historical grounds, the customary tenure the most dominant system in Uganda (Nabuguzi and Edmunds, 1993). Under this system, members of the community or tribe respect the customary rights of those who have settled in the area long time ago, have inherited land from their parents, or have purchased land from people that settled before them. Under this system, land can be owned by an individual, a household or a community, but they generally do not have formal titles or proper records demonstrating that ownership. This makes complex, expensive and bureaucratic the process of selling or purchasing land (WB, 2018). It also makes challenging getting credits, and solving land-related conflicts (OXFAM, 2019).
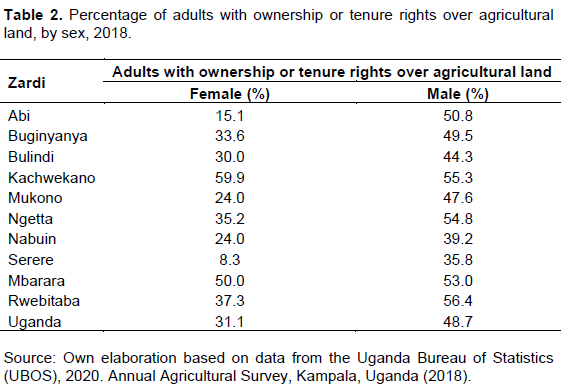
When land ownership (77%) is differentiated by gender, it is found that 48.7% of adult male living in agricultural households was owners or right holders over the lands they cultivate, while this figure is 31.1% in the case of adult females (Table 2). This difference denotes a gender gap where women are disadvantaged in relation to men in regards to land ownership. This gender gap varies significantly from one ZARDI to another. The largest gap was found in Abi where just 15.1% of females were owners or right holders over agricultural land, while the corresponding share for males was 50.8%. Just in two ZARDIs, Kachwekano and Mbarara, the share of females and males having similar land owner rights was about the same.
This gender gap is explained by social and historical factors (OXFAM, 2014). Women’s insecurity related to land ownership is grounded on customary traditions that dictate that women are dependent on men, and therefore women is not encouraged to own land, but might have a “secondary right” to own and access land through their maiden or matrimonial family (OXFAM, 2014). Due to deep-rooted cultural attitudes, which imply women having more difficulty than men in enforcing land rights, women typically have temporary rights over land, which is linked with their relationship with their father or husband (OXFAM, 2019). The current legal framework states that:
“Any decision taken in respect of land held under customary tenure, whether in respect of land held individually or communally, shall be in accordance with the customs, traditions and practices of the community concerned, except that a decision which denies women or children or persons with a disability access to ownership, occupation or use of any land or imposes conditions which violate articles 33, 34 and 35 of the Constitution on any ownership, occupation or use of any land shall be null and void” (The Land Act of 1998, Section 28).
Hence, Uganda’s Land Act clearly acknowledges that women have land rights. However, the implementation of the Land Act has remained weak resulting in a situation where in practice women continue to find many obstacles to effectively own or legally inherit land as customary practices still override the current laws (OXFAM, 2019). Hence, while more adult females as compared to adult males were found to be mainly engaged in agriculture, adult females have less shares of land ownership as compared to adult males, denoting a gender gap in relation to land use and ownership.
Households education
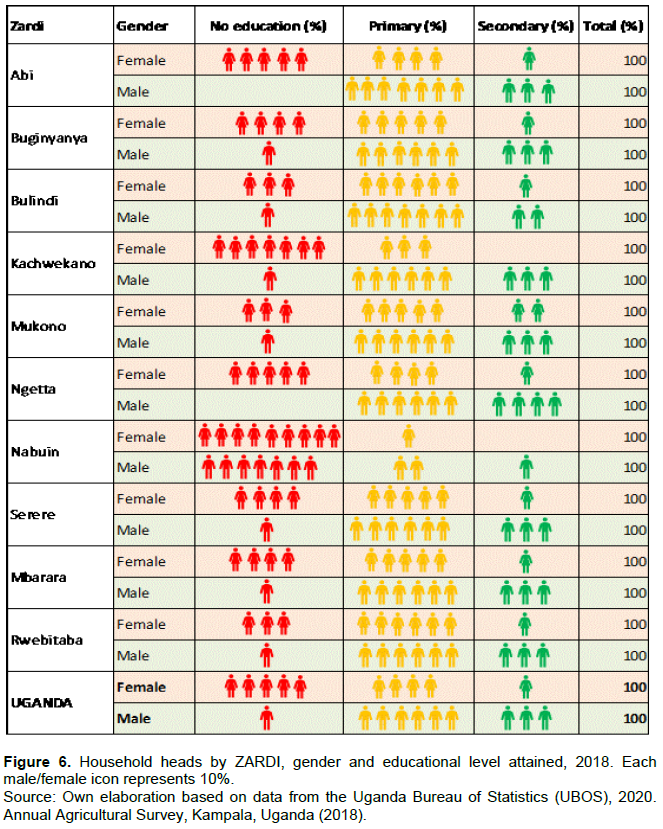
Households’ performance on agricultural activities depends, to a certain extent, on their education levels (Asadullah and Rahman, 2009; Alene and Manyong, 2006). In average, 70% of all agricultural household heads (male and female) did enrol into primary education, while the remaining 30% did not enrol in primary school. While this general finding seems to be not too critical, when differentiating the analysis by gender a different picture is unveiled (Figure 6). That is, the education of female agricultural household heads was found to be critically low: in average, 50% of female agricultural household heads did not have any schooling education, 40% completed primary school, and only 10% completed secondary school. The situation of male agricultural household heads was better as just 10% did not have any schooling education, 60% completed primary school, and 30% completed secondary school. At ZARDI level the situation is very heterogeneous. In Kachwekano, 70% of female household heads did not have any schooling education, while the share of male household heads was radically different with just 10% that did not attend to primary school. In this ZARDI, just 30% of female household heads completed primary school, and none of them did secondary education. Significantly more male household heads completed primary education (60%), and 30% even finished secondary education. Nabuin exhibits a very particular and critical situation, where high shares of both female and male household heads did not attend to school (90 and 70%, respectively). In this ZARDI, only 10% of female household heads completed primary education, while 20% did it in the case of male household heads. These findings clearly indicate that the education level of female household heads is very critical, as their shares of no education, and those of completing primary and secondary school were very low. The education level of male household heads was also low, but not as critical as the education of female household heads. Low level of education is directly associated with negative effects on the quantity and quality of agricultural outputs obtained, on the level of income generated, and on the ability to incorporate innovative agricultural technologies. Asadullah and Rahman (2009), Fulginiti and Perrin (1993), and Alene and Manyong (2006) found that agricultural productivity is typically found to be positively correlated with education, implying that higher levels of schooling leads to higher productivity. Telleria and Aw-Hassan (2011) found that educated agricultural labour force yields higher labour productivity. Their study, applied to 12 West Asian and North African countries, found that as farmers are acquired with more education they are able to better understand and adapt new technologies to their farms. FAO (2001) found that improved literacy rates have a positive impact on farmers’ productivity. More specifically, a farmer with four years of primary school is, on average, 8.7% more productive than a farmer with no education.
Hence, improving education among agricultural households is a critical challenge that needs to be addressed by the government in order to improve agricultural performance. The AgroPIAP acknowledges that short and long-term agricultural development largely depends on human capital development of small holders to improve production and marketing outcomes. This opens room for active participation of government institutions (such as the Ministry of Agriculture, Animal Industry and Fisheries, the National Agricultural Extension System, and the Ministry of Gender Labour and Social Development) to promote educational programmes, particularly among female household members.
Fertiliser use
Low crop productivity is one of the most important concerns among governments. To a large extent this is because low productivity leads to low quantities of agricultural output produced per unit of land (AGRA, 2019), low famers’ income (Fulginiti and Perrin, 1993), low farm resilience and high agricultural household vulnerability (Mubiru et al., 2012), poor food security (Roudier et al., 2011), and poor development of the agricultural sector and wider economic development (USAID, 2021).
To analyze indicators of crop productivity in Uganda, the use of agricultural inputs in the country was analysed. Fertiliser use in Uganda is generally low (Table 3). That is, 23.9% of the Ugandan agricultural households used fertilisers in 2018, while the remaining 76.1% did not use neither organic nor inorganic fertilisers. At ZARDI level, Mbarara (64.8%) had the highest percentage of agricultural households using fertilisers, followed by Kachwekano (39.6%) and Mukono (32.8%). At the other end, Ngetta (2.4%) has the lowest percentage of agricultural households using fertilisers, followed by Nabuin (3.0%) and Abi (3.9%). When fertilisers were used, agricultural households used more organic fertilisers as compared to inorganic ones. That is, among those agricultural households that used fertilisers (23.9%), an estimated 77% used organic ones and 31.9% used inorganic fertilisers.
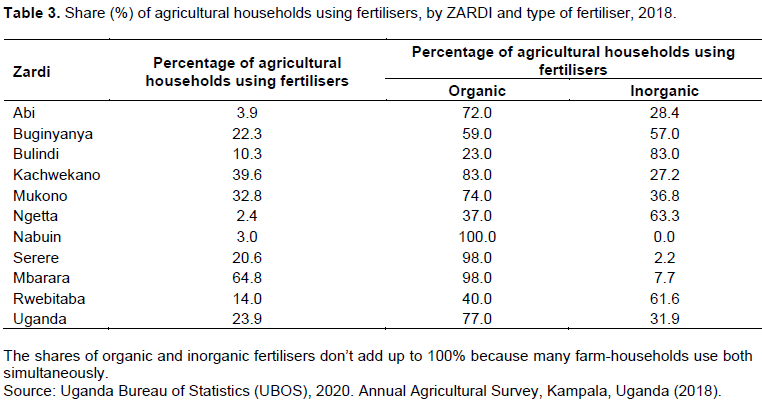
Hence, the large majority (76.1%) of agricultural households in the country did not use neither organic and nor inorganic fertilisers in 2018. Particularly, the use of inorganic fertilisers was very low. A number of interlinked factors inhibit Ugandan farmers from using fertilisers, being the most important:
(a) Financial constraints: High poverty rates in rural Uganda compel farmers to prioritize little available resources on food and shelter (Freeman and Qin, 2020; Birungi and Rashid, 2010). Poverty reduces the probability of adopting fertilisers mainly because the poor have limited access to cash (Birungi and Rashid, 2010). The AAS 2018 found that 40% of the agricultural households that were not using fertilisers considered that they were unaffordable to them. Muhereza et al. (2014) also found that inorganic fertilisers (mainly Urea) were too expensive for farmers to purchase them.
(b) High risk and low returns to investment: IFPRI (2007) found that low use of inorganic fertilisers is explained by farmers’ perception of low returns to their investment. In addition, Jjagwe et al. (2020) argue that high cost of fertilisers in comparison with output prices might not be economically justifiable, particularly for the poor smallholder farmers practicing subsistence farming.
(c) Lack of knowledge and information on fertiliser use: Referred to insufficient information on soils’ specific nutrient needs and proper application of organic and inorganic fertilisers. The AAS 2018 found that 10.9% of agricultural households not using fertilisers declared to have limited or no knowledge on the benefits for soils emerging from the use of inorganic fertilisers (UBOS, 2020). Furthermore, according to the AAS 2018, 3.4% of agricultural households not using fertilisers considered that inorganic fertilisers were harmful to soils (UBOS, 2020).
(d) Limited or no access to fertiliser-specific extension services: Okoboi and Barungi (2012) and Nyachwo (2010) reported that extensionists frequently have insufficient knowledge of the specific soil conditions vis-à-vis the type of fertiliser needed for different types of crops, resulting in deficient advisory services to farmers. This is exacerbated by households’ limitations on their capabilities to read and apply instructions for using fertilisers (Nyachwo, 2010).
(e) Perception on fertility of soils: Nyachwo (2010) reports that among farmers a common misconception is believing that soils in Uganda are sufficiently fertile and, therefore, in no need of fertilisers. The AAS 2018 found that 24.5% of households not using fertilisers considered that soil fertility was good enough to the point that inorganic fertilisers were unneeded (UBOS, 2020). Different studies, Mubiru et al. (2017) and Semalulu et al. (2014) showed evidence of declining soil fertility in Uganda due to nutrient mining and little or no replenishment of nutrients.
(f) Low access to credit: A bimodal combination of factors prevents farmers from getting credit for fertilisers. On one hand, no secure land documentation rights and/or lack of capital to use as collateral to secure credit. On the other hand, banks perceiving farming (especially by smallholders and subsistence farmers) as highly risky credit clients (AGRA, 2019). For the credit market, both represent a serious challenge, which is exacerbated by production uncertainties typically associated with rainfed agriculture.
(g) Difficult transportation and long distances from input markets to farms: Transportation of fertilisers, such as DAP, Urea, or 17-17-17, is about moving heavy volumes. A single hectare can easily need five bags (of 50 kg each one) of fertilisers. Long distances between input markets and farming areas using roads in poor condition can increase the cost farmers have to pay for the fertilisers (AGRA, 2019). Muhereza et al. (2014) found that the cost of transportation of inorganic fertilisers can be too expensive for farmers to afford it.
Among those farmers that used organic fertilisers (Figure 7), most agricultural households used animal droppings (69%), followed by plant residues or compost (38.4%), and chicken droppings (14.1%). Animal droppings or manure, that mainly come from cattle, is a key source of nutrients (nitrogen, phosphate and potassium) to plants. They are seen by farmers as an accessible and convenient asset that does not involve any direct cash outlay. Farmers generally use family labour for most agronomic activities related to manure management, which includes mixing manure with plant residues, poultry manure and/or ash, as well as dropping collection, storage, compost preparation and application on soils.
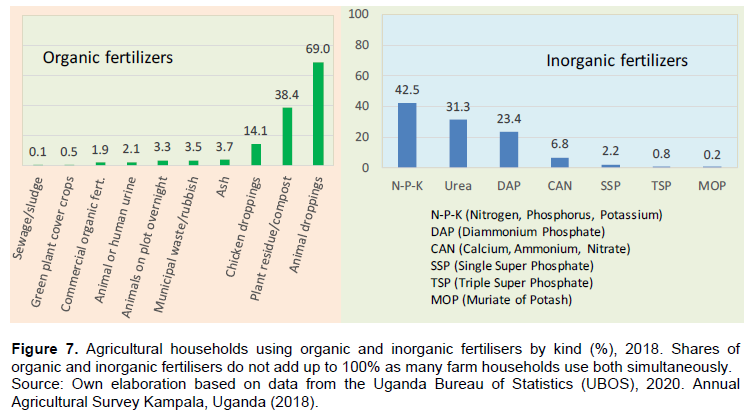
As mentioned earlier, inorganic fertilisers are of limited use in Uganda. When used, three are the main ones (Figure 7): NPK (Nitrogen, Phosphorus and Potassium), Urea and DAP (Di-Ammonium Phosphate). NPK (15-15-15) was the most common inorganic fertiliser among farmers (42.5% used it in 2018). Urea (46-0-0) was the second most used fertiliser among farmers (31.3%), and it is typically incorporated in soils to promote bloom growth. And DAP (18-46-00) was the third most common fertiliser (23.4%), which is well-known for providing high nutrient content of phosphorus and nitrogen to soils.
A typical output emerging from low use of fertilizers is low crop productivity due to declining soil fertility (Okoboi and Barungi, 2012). The main fertiliser policy of the country, the “National Fertiliser Sub-Sector Development Strategy and Investment Plan (NFS 2015/16 - 2019/20)”, has set up a framework for guiding and promoting enhanced availability and use of fertilisers for higher agricultural productivity in Uganda. The AgroPIAP has made agribusiness a top priority, and one of the key pillars to achieve this priority is to promote increased productivity to ensure continued and sufficient supply of agricultural inputs to bust agro-processing development. Yet, low levels of fertiliser use, particularly the inorganic ones, suggest that reviewing existing policies and mechanisms is needed to ensure that implementing institutions provide the necessary incentives to encourage farmers embarking on more intensive use of fertilisers.
Pesticides use
Farmers use pesticides to control, destroy and/or prevent the presence of pests during the different stages of farm production cycle, including processing, transportation and marketing of food. Pests, comprising insects, rodents, birds, mites and other vertebrates, cause injuries to crop plants and forests eating plants, seedlings and grains as well as by competing with field crops for nutrients and water (FAO, 2002).
In average, 21.1% agricultural households in Uganda used pesticides in 2018, while the remaining 78.9% did not use any kind of pesticides (Figure 8). The highest percentage of households using pesticides was recorded in the northwest ZARDI of Bulundi (34%), while the lowest percentage of households using pesticides (5.7%) was observed in northeast ZARDIs of Ngetta and Nabuin. According to NARO (2014), the main reason for using pesticides in Uganda is the presence of insects and birds that cause significant damages to crops, e.g. NARO reports that in rice the damage caused ranged from 0.37 to 3.7 tons/ha.
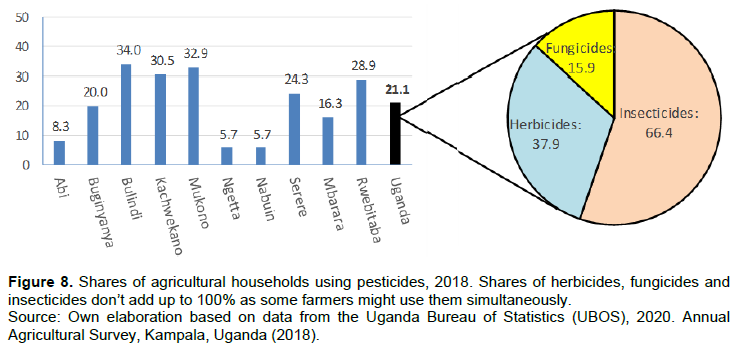
When pesticides are used, insecticides are the most common ones used by agricultural households (66.4%). This finding is consistent with the study of Kagezi et al. (2019) who found that insecticides represent 59% of all pesticides used in the southern and West Nile region of the country. Kagezi et al. (2019) argue that insecticides are predominantly used because farmers often fail to differentiate between damage caused by insects and fungal diseases and, therefore, they just apply insecticides to combat the problem. The use of herbicides and fungicides is smaller (37.9% and 15.9%, respectively). Generally, low use of pesticides is associated with insufficient knowledge on the short- and long-term benefits associated with pesticide use (Terry, 2002). Additionally, resource poor farmers find risky and many times unaffordable using pesticides (Terry, 2002).
Seeds use
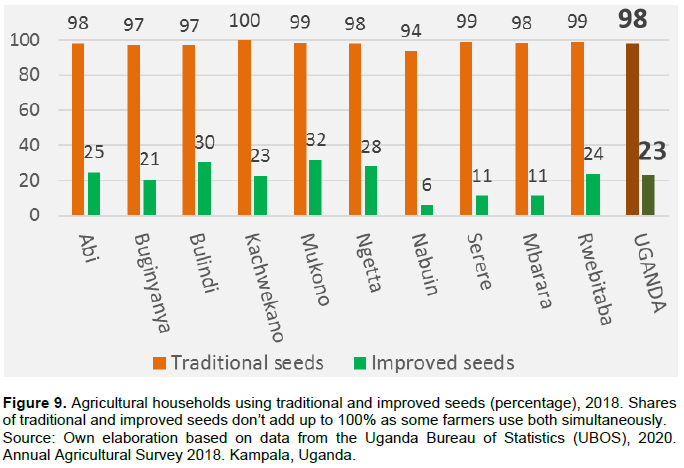
The seed sector in Uganda is largely dominated by traditional seeds (Figure 9). That is, 98% of agricultural households use traditional seeds and, in addition, 23% of them use improved seeds (shares do not add up to 100% as some farmers use both simultaneously). Traditional seeds come from various sources: from harvests that farmers keep as seed for the next planting season, from purchases within their communities, from exchanges with neighbours and relatives, or from purchases in other markets.
While traditional seeds can be well-adapted to local conditions, their productivity levels (commonly measured in kg/ha) are generally lower as compared to improved quality seeds (FAO, 2014). For example, every time saved seeds from previous seasons are planted, they lose strength, reducing the productivity of farmer’s labour, the productivity of other production inputs, and ultimately resulting in lower yields (FAO, 2014). Improved seeds, including certified seeds, have a number of benefits that have been widely documented. Good quality seeds can improve yields (MAAIF, 2018), can reduce risks to weeds, pests and diseases (FAO, 2017), can be resistant to climate-related adversities such as droughts (ISSD Uganda, 2015), floods (IRRI, 2014), and ultimately can improve stability of crop production and income (USTA, 2010).
Irrigation use
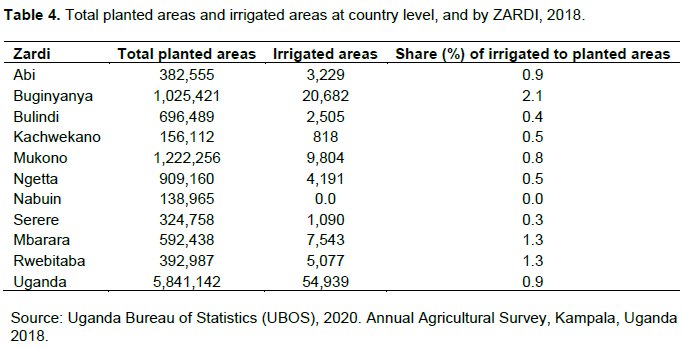
It is estimated that just 0.9% of all cultivated areas in Uganda were irrigated in 2018 (Table 4). That is, out of the 5,841,142 ha that were cultivated in Uganda in 2018, 54,939 hectares (0.9%) were irrigated. This implies that about 99% of all agricultural production areas are rain-dependent. At ZARDI level, Buginyanya’s agricultural crops were irrigated the most, in both absolute (20,682 ha) and relative (2.1%) terms.
Several studies for Uganda (Sridharan et al., 2019; Mubiru et al., 2012; Adhikari et al., 2015; Roudier et al., 2011) produced significant evidence showing that conventional rain-fed agriculture is vulnerable to climate change, resulting in volatile crop and livestock production, and in random livelihood revenues. This vulnerability comes from the sensitivity that the majority of crops grown in Uganda, particularly staple food crops like matooke, have to water availability (Sridharan et al., 2019). Furthermore, the 2017 Uganda National Irrigation Policy (MAAIF, 2017) alerted that climate change was generating erratic rainfall patterns, such as droughts and floods throughout the country, further compromising the already low crop yields that were obtained in many parts of the country.
In response, the country’s irrigation policy framework (given by the Uganda Vision 2040, the National Development Plan III (NDPIII) and the 2017 Uganda National Irrigation Policy) has acknowledged that irrigation is an important input for the agricultural sector. As such, the government has ranked hydraulic infrastructure as the fourth most important investment, which is expected to improve agricultural productivity.
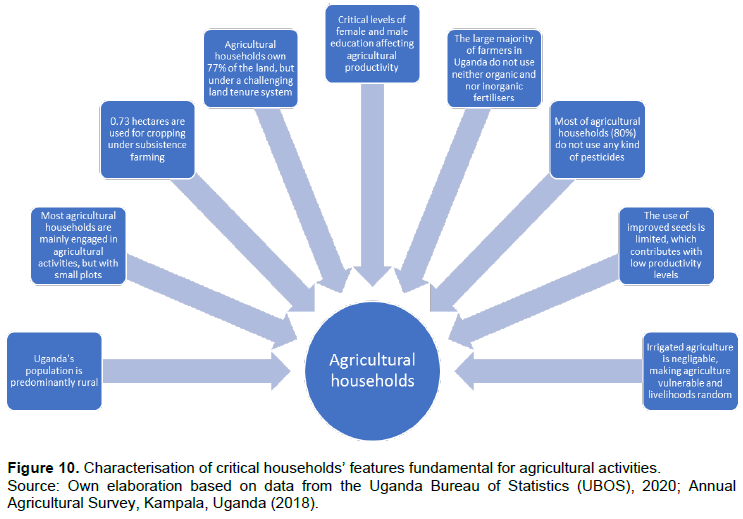
WRAP-UP
The purpose of this paper was characterising specific aspects of agricultural households that are critical for performing agricultural activities (Figure 10). This characterisation shows that Uganda is predominantly a rural country where female and male agricultural household heads significantly depend on agricultural activities to earn their livelihoods. They cultivate small agricultural plots that typically accommodate cropping to subsistence farming. Generally, the land belongs to them, but in most cases with no legal documentation proving ownership. They are farmers experiencing low levels of education that affect their productivity in agricultural enterprises. Generally, they incorporate very low levels of improved inputs (fertilisers, pesticides, seeds, and irrigation) into their production systems.
This characterisation suggests a need to address the challenges faced by small agricultural households in an integral manner, covering in-farm and off-farm challenges.
The developmental policy framework of the country needs to take into account the relatively small parcels used for agriculture, and workout towards promoting technologies suitable to make small-scale farm production systems efficient and sustainable. The fact that agricultural farms are generally small does not necessarily mean that they have to be unsustainable and inefficient. IFPRI (2007) found evidence showing smallholder farming households using fertilisers, pesticides and hybrid seeds more intensively than farmers having large landholdings. This suggests that average agricultural land holdings can be small, but they can be efficient too. Overcoming the challenges would demand specialized studies, which should determine which of the identified issues are the most and least constraining factors affecting the ability of farmers to improve their livelihoods. Without solid and detailed information, it is unlikely that agricultural and rural development policies succeed in developing the agricultural sector. Yet, it is clear that in a country like Uganda, where agriculture is the largest employment generator, ensuring efficiency of small-holder agricultural production systems will be important to reduce poverty, to create employment, to improve food security and ultimately to generate wealth.
CONFLICT OF INTERESTS
The authors have not declared any conflict of interests.
REFERENCES
|
Adhikari U, Nejadhashemi A, Woznicki S (2015).Climate change and eastern Africa: A review of impact on major crops. Food and Energy Security 4(2):110-132. |
|
|
AGRA (2019). Feeding Africa's soils: Fertilisers to support Africa's agricultural transformation. Nairobi, Kenya. Alliance for a Green Revolution in Africa (AGRA). |
|
|
AgroPIAP (2021). NDPIII Agro-industrialization Programme Implementation Action Plan (AgroPIAP). |
|
|
Annual Agricultural Survey (AAS) (2018). Second Season. Uganda Bureau of Statistics (UBOS). |
|
|
Alene AD, Manyong VM (2006). Endogenous Technology Adoption and Household Food Security: The Case of Improved Cowpea Varieties in Northern Nigeria. Quarterly Journal of International Agriculture 45(3):211?230. |
|
|
Asadullah MN, Rahman S (2009). Farm Productivity and Efficiency in Rural Bangladesh: The Role of Education Revisited. Applied Economics 41(1):17?33. |
|
|
Birungi P, Rashid H (2010). Poverty, property rights and land management in Uganda. African Journal of Agricultural and Resource Economics, African Association of Agricultural Economists 4(1):1-22. |
|
|
EPRC (2000). Natural Resource Management and Policy in Uganda: Overview Paper. Sustainability Indicators for Natural Resource Management and Policy. Working Paper 3. Economic Policy Research Centre (EPRC). |
|
|
Food and Agriculture Organization (FAO) (2001). The Role of Agriculture in the Development of LDCs and their Integration into the World Economy. |
|
|
Food and Agriculture Organization (FAO) (2002). International Code of Conduct on the Distribution and Use of Pesticides. Rome: Food and Agriculture Organization of the United Nations. |
|
|
Food and Agriculture Organization (FAO) (2014). Appropriate Seed Varieties for Small-scale Farmers. |
|
|
Food and Agriculture Organization (FAO) (2017). Drought-tolerant maize varieties in Uganda. FAO, Le Groupe-Conseil Baastel, Global Climate Change Alliance. |
|
|
Food and Agriculture Organization (FAO) (2021). FAOSTAT, Annual population. |
|
|
Freeman K, Qin H (2020).The Role of Information and Interaction Processes in the Adoption of Agriculture Inputs in Uganda. |
|
|
Fulginiti LE, Perrin RK (1993). Prices and Productivity in Agriculture. The Review of Economics and Statistics pp. 471?482. |
|
|
IFPRI (2007). Assessing the impact of the National Agricultural Advisory Services (NAADS) in the Uganda rural livelihoods. |
|
|
ILO (2017). SWTS country brief-Uganda. |
|
|
IRRI (2014).IRRI's new breeding factory. Rice Today. International Rice Research Institute (IRRI), and Global Rice Science Partnership (GRiSP). |
|
|
ISSD (2015). Research report on climate resilient local seed businesses. Integrated seed sector development programme in Uganda, Wageningen UR Uganda. Kampala. |
|
|
Jjagwe J, Chelimo K, Karungi J, Komakech J, Lederer J (2020). Comparative Performance of Organic Fertilisers in Maize (Zea mays L.) Growth, Yield, and Economic Results. Agronomy 10(1):69; |
|
|
Kagezi G, Kucel P, Olango N, Kobusinge J, Nakibuule L, Nambozo B, Olal S, Wagoire W (2019).Pesticides Used by Farmers in the Arabica Coffee Growing Regions of Uganda. African Journal of Food, Agriculture, Nutrition and Development 19(4):14863-14872. |
|
|
MAAIF (2017). Uganda National Irrigation Policy. Ministry of Agriculture, Animal Industry and Fisheries (MAAIF) and Ministry of Water and Environment (MWE). |
|
|
MAAIF (2018). Uganda National Seed Policy 2018. Ministry of Agriculture, Animal Industry and Fisheries (MAAIF). |
|
|
Mubiru D, Komutunga E, Agona A, Apok A, Ngara T (2012). Characterising agrometeorological climate risks and uncertainties: Crop production in Uganda. South African Journal of Science 108(3):1-11. |
|
|
Mubiru D, Namakula J, Lwasa J, Otim G, Kashagama J,Nakafeero M,Nanyeenya W, Coyne M (2017). Conservation Farming and Changing Climate: More Beneficial than Conventional Methods for Degraded Ugandan Soils. Sustainability 9(7):1084. |
|
|
Muhereza I, Pritchard D, Murray-Prior R (2014). Utilisation of cattle manure and inorganic fertiliser for food production in central Uganda. Journal of Agriculture and Environment for International Development 108(2):135-151. |
|
|
Nabuguzi E, Edmunds D (1993). Access to Land and Other Natural Resources in Uganda: Research and Policy Development Project. Research Paper 4. Prepared for Makerere Institute of Social Research and the Land Tenure Cente |
|
|
National Agricultural Research Organization (NARO) (2014). Bulindi Zonal Agricultural Research and Development Institute (Buzardi). |
|
|
NFS (2015). National Fertiliser Sub-Sector Development Strategy and Investment Plan (NFS 2015/16 - 2019/20). Uganda National Fertiliser Sub-Sector Development Strategy and Investment Plan (NFS): |
|
|
NDPIII (2021). National Development Plan (NDPIII). |
|
|
Nyachwo J (2010). Fertiliser Distribution Development and Promotion. Final Technical Report. AT Uganda Ltd. Collaborator T. M. Wilfred, UNADA. Project Supported by Kilimo Trust. |
|
|
Okoboi G, Barungi M (2012).Constraints to Fertiliser Use in Uganda: Insights from Uganda Census of Agriculture. Journal of Sustainable Development.Pp.5:10; ISSN 1913-9063 E-ISSN 1913-9071. |
|
|
OXFAM (2014).Women's Land Rights in Northern Uganda (West Nile, Acholi, Lango, Teso and Karamoja). |
|
|
OXFAM (2019).How unjust land systems are driving inequality in Uganda - Locked out. Muhumuza F. and Akumu P. OXFAM Uganda,Kampala. |
|
|
Roudier P, Sultan B, Quirion P, Berg A (2011).The impact of future climate change on West African crop yields: What does the recent literature say? Global Environmental Change 21(3)1073-1083. |
|
|
Semalulu O, Mugonola B, Bonabana-Wabbi J, Kayangaand T, Mogaka H (2014).Optimizing use of integrated soil fertility management options for profitable groundnut production in Uganda. Agriculture and Soil Sciences 1(5):061-069. |
|
|
Sridharan V, Ramos E, Zepeda E, Boehlert B, Shivakumar A, Taliotis C,Howells M (2019). The Impact of Climate Change on Crop Production in Uganda-An Integrated Systems Assessment with Water and Energy Implications. |
|
|
The Land Act (1998). Arrangement of Sections. Chapter 227:28. |
|
|
Telleria R, Aw-Hassan A (2011). Agricultural Productivity in the WANA Region. Journal of Comparative Asian Development 10(1):157-185. |
|
|
Terry P (2002). Development of weed management in maize-based cropping systems. IACR-Long Ashton Research Station. D Overfield Natural Resources Institute. |
|
|
UBOS (2020).The 2018 Annual Agriculture Survey (AAS 2018) Report. Uganda Bureau of Statistics. |
|
|
Uganda Bureau of Statistics (UBOS) (2021). Gross domestic product by economic activity. Table 2.3, Gross domestic product by economic activity, Current prices (% contribution to GDP). Kampala, Uganda. |
|
|
USAID (2021).Agricultural Productivity Growth, Resilience, and Economic Transformation in Sub-Saharan Africa. Implications for USAID. |
|
|
USTA (2010).Baseline Survey of the Seed Sector in Uganda, In Relation to Regional Harmonization of Seed Legislation. Ssebuliba R. Uganda Seed Trade Association (USTA), P. O. Box 29726, Kampala, Uganda. |
|
|
World Bank (WB) (2019).Uganda Technical Report Toward Scaled-Up and Sustainable Agriculture Finance and Insurance in Uganda. |
|
|
World Bank (WB) (2020).Employment in agriculture (% of total employment). World Development Indicators, World Bank. |
|
|
WTO (2019). Uganda World Trade Organization. |
|
Copyright © 2024 Author(s) retain the copyright of this article.
This article is published under the terms of the Creative Commons Attribution License 4.0


