Full Length Research Paper

ABSTRACT
This study analyzed the economic efficiency of smallholder farmers in barley production in the case of Meket district, Amhara National Regional State, Ethiopia. A cross sectional data collected from a sample of 123 barley producers during the 2015/2016 production season was used for the analysis. Two stages random sampling method was used to select sample respondents. The translog functional form was chosen to estimate both production and cost functions and OLS estimation method was applied to identify allocative and economic inefficiencies factors, while technical inefficiency factors were analyzed by using single stage estimation approach. The estimated stochastic production frontier model indicated input variables such as fertilizer, human labor and oxen power as significant variables that increase the quantity of barley output, while barley seed had a negative effect. The estimated mean levels of technical, allocative and economic efficiencies of the sample farmers were about 70.9, 68.6 and 48.8%, respectively which revealed the presence of a room to increase their technical, allocative and economic efficiencies level on average by 29.1, 31.4 and 51.2%, respectively with the existing resources. Among the hypothesized factors expected to affect technical, allocative and economic inefficiencies, extension contact and number of barley plots significantly and negatively affected all inefficiencies level. Besides, distance of residence from the nearest main market was found to have a positive and significant effect on all inefficiencies of sampled farm households. Hence, emphasis should be given to decrease the inefficiency level of those more inefficient farm households via experience sharing among the better of farmers and usage of improved or certified barley seed. Besides this, policies and strategies of the government should be directed towards increasing farmers’ education, improve the system of input distributions and institutional facilities.
Key words: Economic efficiency, stochastic frontier, trans-log, ordinary least square, Meket, barley.
INTRODUCTION
Ethiopia is ranked 21th in the world in terms of barley production with a share of 1.2% of the world’s total production and the second largest barley producer in Africa, next to Morocco and followed by Algeria (Abu and Teddy, 2014; FAO, 2014). Ethiopia is not only the largest producer but also the biggest consumer of barley in Africa. Hence, in relation to its dynamic nature and wide range of uses, barley is known as the “king of grains”. Unlike in the industrialized countries where barley is mainly used for animal feed and malting, barley is important for developing countries in terms of the lives and livelihood of smallholder farmers. At the national level, barley accounts for about 5.6% of the per capita calorie consumption as a main ingredient in staple foods and local drinks. It is also a substitutable crop for other cereals in the country and serves as a roof thatch for many highlanders (Berhane et al., 2011; CSA, 2014).
At the national level from the total area of cereals allocated in hectares, barley covered only 14.65% producing 13.37% quintals with the yield of 10.42 quintals per hectare. The total yield of barley has been increased by 4.99% between 2013/2014 and 2014/2015 and also by 5.2% in the year 2015/2016 (CSA, 2016). Furthermore, among the major cereals, barley is found to have experienced the highest annual fluctuation in area and yield. Hence, this fluctuation in barley yield and area shows that barley has received far less attention as compared to the other major cereals especially teff, maize, and wheat (Shahidur et al., 2015).
Rapid population growth multiplies the problems related to food and other fundamental human needs. Increasing food production is itself a complex process involving more intensive and extensive use of land and water, increased availability of basic agricultural inputs, appropriate agricultural policies and rural institutions and strengthened agricultural researches. However, if effort is made, the potential for increasing food production in every country in the world would be substantial (Aung, 2012). But, there is still yield gap between the farm households which are due to moistures stress, shortage of improved seeds, and degradation of soil fertility, insect pests, diseases, weeds and birds. This higher gap between yields of crops under farmer’s management clearly indicated that farmers having an opportunity to narrow this gap by increasing their crop production and earn higher yield.
Generally, in the case of Ethiopia, there are limited number of studies on efficiency of barley production (Hassena et al., 1999; Wadi’ah, 2012; Endalkachew et al., 2012) which focused on technical efficiency and that of malt barley rather than food barley. Even if technical efficiency being one component of economic efficiency, it may not provide plenty of information for decision makers and policy intervention at zonal and district level. Therefore, this study had analyzed the allocative and overall efficiencies of production and identifies factors causing inefficiencies of smallholder food barley producers. Particularly, in Meket district, barley is a major staple food and it takes the lion share in terms of the extent of production, food consumption, number of producers and area coverage relative to other major cereals grown in the district. However, its production was owned by small holder, a farmer which produces only to survive their hand to mouth livelihood. Therefore, it is crucial to increase their volume of production and efficiency at least to secure their food needs. The general objective of this study was to analyze the economic efficiency of smallholder farmers in barley production, the case of Meket district, Amhara National Regional State, Ethiopia and to identify the determinants of inefficiencies of barley producers in Meket district.
RESEARCH METHODOLOGY
Description of the study area
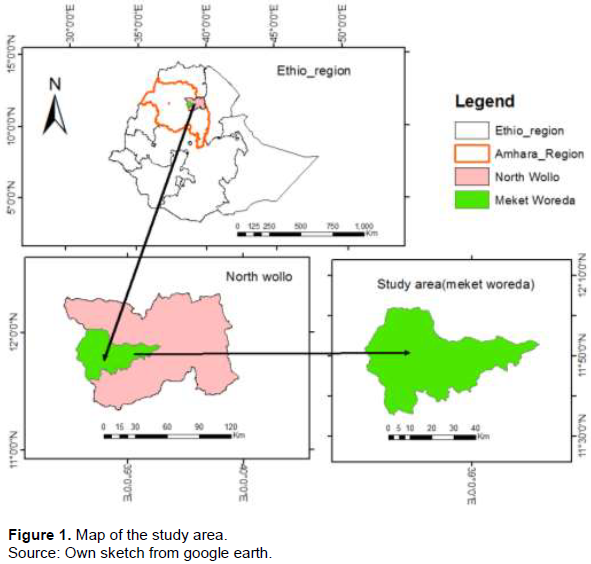
Meket district is one of the eleven districts in North Wollo Zone of Amhara National Regional State, Ethiopia which is located at 600 km north of Addis Ababa and bordered on the south by Wadla and Daunt districts, on the west by Debub Gondar Zone, on the northwest by Bugna districts, on the north by Lasta, on the northeast by the Gidan district and on the east by Guba-Lafto districts (https://en.wikipedia.org/wiki/Meket). There are four main agro-climatic zones in the district. These are the semi-arid lowlands less than 2,300 masl, the sub-humid midlands from 2,300 to 2,800 masl, the humid highlands 2,800 to 3,200 masl, and the very-humid high altitude plateau, which is over 3,200 masl, is often battered by frost and hail. The topography of the district is highland and it is suitable for barley production (Seid, 2012). Based on the 2007 National Census conducted by the Central Statistical Agency of Ethiopia (CSA), this district has a total population of 226,644 and currently according to the report of the Meket District Health Office (2016), the total population of Meket is estimated at about 263,567 of them 51.67% are male and 48.33% are female. This means that between 2007 and 2016, there is a population growth rate of 14% in the district (Figure 1).
Sampling technique and sample size
The sampling technique employed was two-stage sampling technique. Meket district has a major barley producers and large extent of production in the zone. From the total 47 kebeles of Meket district only 21 kebeles produce barley. Even, all 21 barley producer kebeles in the district have similar characteristics or attributes in their farming system, the technologies they adopt and their highland topographies a total of three sample representative kebeles were randomly selected in the first stage. In the second stage, 123 sample farmers were selected by using simple random sampling technique from each kebele based on probability proportional to size.
The sample size of farmers was determined by applying Yamane’s (1967) formula with confidence interval of 95% and variability of 0.05.
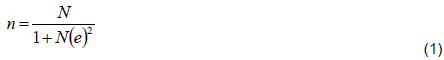
where n=the sample size, N=number of barley producer households in Meket district in 2015/2016 production season (which was 18,036), e=margin of error (which was 9%), then n=122.6. Hence, the sample size of this study was 123.
Yamane’s formula was used because of its homogenous type of population in the study area and 9% error of margin was applied for the purpose of managing all samples in terms of the available resource that the researchers have including cost, time, etc.
Both primary and secondary data were used for this study. Primary data were collected from 123 sample farm households from three rural kebeles through questionnaires. While secondary data also collected from different governmental and non-governmental institutions including both published and unpublished documents at zonal and district level regarding the baseline general information to support the primary data and websites.
Method of data analysis
Descriptive statistical tools and econometric models were employed to achieve the objective of the study. The descriptive statistics includes means, standard deviation, minimum, maximum, frequencies and percentage. Regarding the econometric model, after conducting all the required hypothesis and make decision, a trans-log functional form simultaneously with one stage estimation procedure of frontier model was used to analyze technical inefficiency variables and OLS was used to identify allocative and economic inefficiency variables. OLS is mainly used if the inefficiency scores are not truncated or censored for a specific value. If the observation tends to be grouped close to the frontier with only a relatively small number in the extreme range, the error distribution will be highly skewed and the maximum likelihood estimator should be expected to be highly efficient than OLS (Greene, 1980). In the available data set, there was no value of efficiency score of one for some observations that shows the farmers are fully efficient or the value of zero for some observation which shows that they are inefficient. Tobit model cannot be applied in any efficiency analysis without censored or truncated values of efficiency scores for some observation. Therefore, ordinary least square estimation technique is applicable in this study.
Since the efficiency variable varies between 0 and 1, the coefficients of the explanatory variables become very small which shows the weak relationship between the dependent and independent variables. Therefore, to avoid this, dependent variable (allocative and economic inefficiency score) would be transformed into natural logarithmic form as:
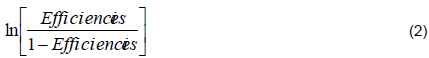
So that, the latter transformed variable will facilitate the estimation of the parameters by using the OLS technique (Bhende and Kalirajan, 2007; Aung, 2012).
The implicit trans-log form of the stochastic frontier production model was specified as follows:
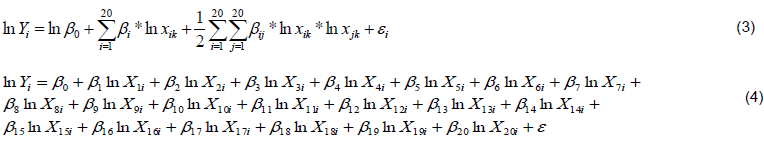
where Ln=Logarithm to base e, βi=the unknown parameters estimated, i=1, 2, 3. . . nth farmer, j=inputs of production used, Yi=output of barley, X1=land allocated for barley crop (ha), X2=labor power (man-days), X3=amount of barley seeds used (kg), X4=oxen power (oxen days), X5=quantity of fertilizer used in barley crop (kg), X6 up to X20 are the square and interaction terms of those inputs, ε=random composed error-term (V-U) and n=sample size
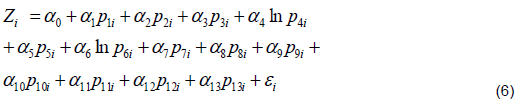
Technical inefficiency scores were estimated on hypothesized farm related, socioeconomic and institutional factors using a one stage estimation procedure in frontier model simultaneously with the production function. The technical inefficiency model was specified as using:

where Yi is the barley output and Zi is the different farmers specific, farm related and institutional variables that affect technical inefficiency.
Estimating cost function is necessary to estimate allocative efficiency scores of the household farmers. Then, the total cost was regressed on each cost of inputs using trans-log functional forms of cost function as:
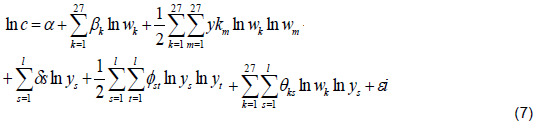
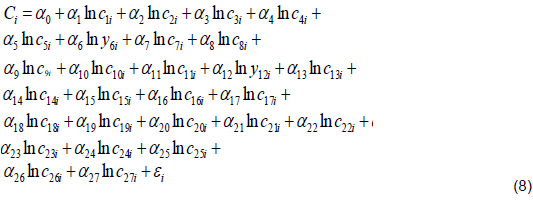
where Ci=Minimum costs of the ith farmers for the production of barley, C1=rental price of land in birr per year, C2=wage of human labor used in birr per man days, C3=price of fertilizer used in birr per kg, C4=price of oxen rent in birr per oxen days, C5=price of seeds applied in birr per kilogram, lnY6=output of barley in quintals, from C7 up to C27 are the square and cross product of cost of inputs, A=constant and ε=random composed error term (V+U).
Cost efficiency is the ratio of minimum cost and actual cost. If cost efficiency is less than one the farmer is said to be less cost inefficient while, if it is unity the farmer or producer is cost efficient. Since allocative efficiency is the reciprocal of cost efficiency and it is regressed on farm related farmer’s specific and institutional inefficiency factors as:
where Y*=Allocative inefficiency scores
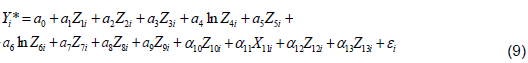
According to Bravo-Ureta and Pinheiro (1997), economic efficiency is the product of technical efficiency and allocative efficiency. In measuring the factors affecting economic inefficiency levels, OLS estimation technique could be applied. The estimating inefficiency scores are regressed on the same set of farm related, institutional and farmer’s specific factors that are assumed to be important determinants of inefficiency as allocative and technical inefficiency.
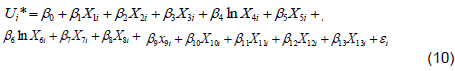
where Ui*=Economic inefficiency levels.
The inefficiency variables denoted as P1 to P13 in Equation 6 and Z1 to Z13 in Equation 9 and X1 to X13 in Equation 10 are: farming experiences of farmers in barley production (years), farmer education level (years of schooling), frequency of extension contact (numbers), amount of credit taken (Ethiopian birr), number of barley plots (number), total expenditure of households (Ethiopian birr), crop rotation (0= if they practice crop rotation, 1 otherwise), participation on non-farm income (0= if yes and= 1 if no), livestock holding (TLU), fertility status of the soil (0=fertile, 1=infertile), distance to market (kilometers), gender (0 if the household headed are male and 1 other wise) and distance of the plot from farmers home (walking minutes).
After all regression results, different post estimation tests or diagnostics were done including variance inflation factor, heteroscedasticity, omitted variable test and normality of the residuals for the models to ensure that the available data set meets the assumption of OLS regression and all these are presented under the Appendix.
RESULTS AND DISCUSSION
Descriptive statistics of sample farm households
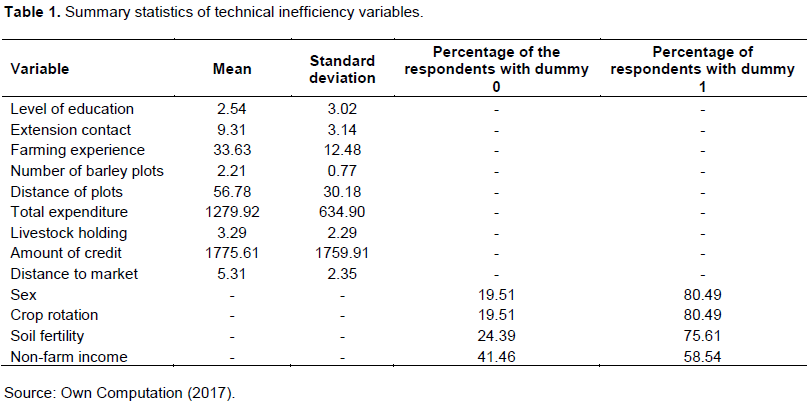
The mean education level of the sample households in the study area was 2.54 and it ranged from 0 to grade 10. This indicates that in the study area, there is low level of education and it requires different actions or assignments for the regional education bureau to expand adult education for the farmers. The mean frequency of extension contact was nine times with a minimum of twice to a maximum of 18 times per barley production season. This reveals that there is high frequency contact between the farmers and the extension workers. Farmers have a long history and experience to cultivate barley in the study area. For this reason the average farming experience of the sample farmers in barley production was 33.62 years with a minimum of 5 years and maximum of 62 years. It was also found that, the mean number of plots allocated for barley crop was 2.21 with maximum of 4 plots located in different site. This study is in line with the arguments made by previous agricultural researchers, that is, in the highland there is land fragmentation and the sample households have more than two barley crops that come due to share cropping. In addition, on average, farmers walk relatively 1 h to reach their farm plot. This shows that there is a wide distance between the farmer’s residence and farm plot. Indeed, it affects the efficiency of farmers by decreasing the supervision of the plot by farmers. On average sample farm households own 3.29 TLU with a minimum of 0.815 TLU to a maximum of 15 TLU. Livestock could support crop production in many ways; it can be source of cash, draft power and manure that will be used to maintain soil fertility, then the study reveals there is no that much adequate livestock in the study area.
The mean total expenditure of the sample households was 1279.92 birr within the range of 1000 and 5000 birr. The mean amount of credit obtained from different sources was 1775.61 birr and ranges from 0 to 7000 birr. The mean distances from the farmers residence to nearest market was 5.31 km and ranged between 2 and 12 km.
Sample of respondents composed of both male and female household heads. Out of the total sampled household head farmers, about 80.49% were male headed and the remaining 19.51% were female headed households. As shown in Table 1, about 19.51% of the sample households did not practice crop rotation, while the remaining 80.49% adopted the practice of crop rotation. Based on their perceptions, about 24.39% of the respondents classified the fertility status of their barley plot on average as infertile class, while about 75.61% respondents perceived it as fertile. The same table also shows that majority (which is 58.54%) of the farmers had participated on different non-farm income activities while about 41.46% had not any source of non-farm income.
Descriptive results of barley output and input usage
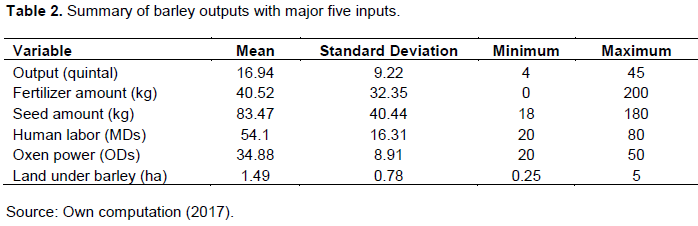
Table 2 shows that the mean barley output of the sample household per average land coverage by barley in the study area in the 2015/2016 production season was relatively 17 quintal with a minimum of 4 quintal to a maximum of 45 quintals. Generally, the average inorganic fertilizer application for the production of barley among the respondent was 40.52 kg and allocated on average 1.49 ha of their farm plot for barley production. The sample households apply only local barley seed with an average of nearly 83.5 kg for their land covered by barley in the production season. On average, a total of 54.1 man days and 35 oxen days were needed to perform all related activities of farming starting from the beginning land preparation up to collection of outputs in harvesting time.
Results of econometric models
Hypothesis testing
The first hypothesis in Table 3, was that selecting the appropriate functional form which fits to the data set by using likelihood ratio test. The most commonly functional forms reviewed in most previous researches were Cobb-Douglas and Trans-log. Then by applying the likelihood ratio test statistics which is  the null hypothesis was rejected which implies that the trans-log functional form adequately represented the data set.
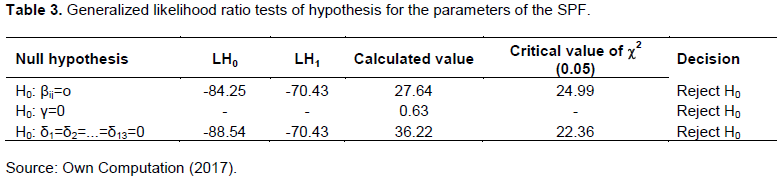
The second hypothesis was conducted to decide whether the production function without considering non-negative random error term best fits the data set or not. H0=γ=0 and H1=γ>0. The gamma (γ) parameter is defined as the ratio of the unexplained inefficiency error term (δu2) to the total sum of errors (δu2+δv2). Since, the value of gamma is 63% which indicated that there was technical inefficiency. This mean that in the study area barley production is more affected by those factors under the control of the farmers than other variables beyond the control of the farmers like climate related factors. Therefore, identifying this inefficiency variable is more needed and included under the OLS estimation procedure.
Thirdly, the null hypotheses is a model without explanatory variables of inefficiency effects, while the alternative hypothesis says the full frontier model with explanatory variables are supposed to determine inefficiency. Therefore, explanatory variables of technical inefficiency can determine variation in production of barley output in the study area.
Estimation of production function
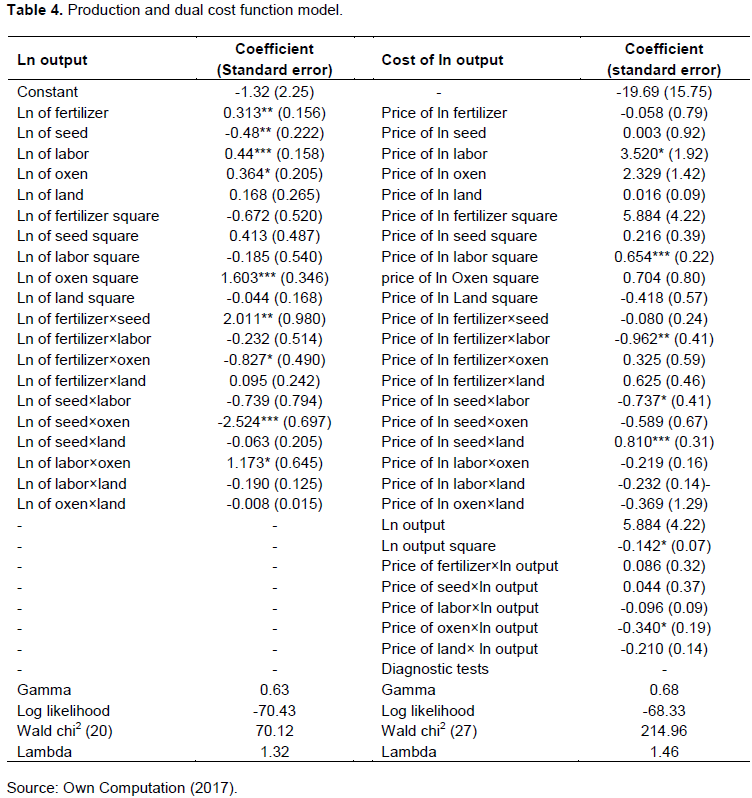
The dependent variable in estimation of stochastic production function was barley outputs produced in quintals analyzed on the five major inputs with their square and interaction terms. The major five inputs were land under barley, amount of local barley seed, quantity of fertilizer, human labor and oxen power. The stochastic frontier model estimates both the trans-log functional forms of production function and variables of technical inefficiency simultaneously by using the first stage estimation approach.
As shown in Table 4, looking from the output of the model, seed had negative and significant effect on the output of barley at 5% level of significance. The negative effect might be due to the reason that, the farmers may have applied only local seed and does not apply any improved and certified seed. Fertilizer is one of the necessary inputs to improve barley output by providing required nutrients and it was significant at 5% level of significance. Hence, a farmer who increased the application of fertilizer up to the recommended rate (that is, 100 kg of UREA and DAP) in turn can earn more output of barley. Labor also had a positive sign and significantly affected barley output at 1% level of significance. In order to increase their barley output, farmers must use more family or hired labor for performing different farming operation on the field. In most developing countries like Ethiopia, oxen are the main source of draft power to perform activities like plowing and sowing crops. In line with this, oxen power had a significant and positive effect on farmers barley output in the study area.
Technical, allocative and economic efficiencies scores of barley producers
The result of frontier model in Table 5 revealed that, the mean technical efficiency of the sample household farmers during the 2015/2016 production season was 70.9% and it ranged from 14 to 95%. This indicated that, there is a wide efficiency gap among the sample barley producers in the study area. This indicates that, farmers had opportunities to decrease all the current input usage by 29.1% without decreasing the output of barley produced.
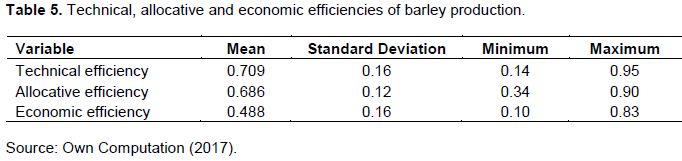
The mean level of allocative efficiency of the sample farmers in the study area was 68.6% which indicated that, farmers had a possibility to increase the optimal level of input combination by decreasing the price of inputs on average by 31.4%.
The mean value of economic efficiency indicated that, relative to their technical and allocative efficiencies the farmers were economically less efficient in the production of barley. The mean level of economic efficiency found in this study was 48.8% which disclosed that farmers in the study area also had a greater deviation. This means that, wise and efficient utilization of the existing resource would decrease the production cost of barley producers by 51.2%.
The economic, technical and allocative inefficiencies levels were regressed on the hypothesized institutional, farmers specific and farm related variables that bring inefficiency disparity among the barley growers. The technical inefficiency variables were estimated by using one stage estimation approach of frontier model, while allocative and economic inefficiency variables were regressed by using OLS estimation technique. The same estimation technique is also used by Sharma et al. (1999), Arega and Rashid (2003), Komicha and Öhlmer (2007) and Susan (2011).
Detailed interpretation and discussion of the statistically significant variables in Table 6 would be presented as the following.
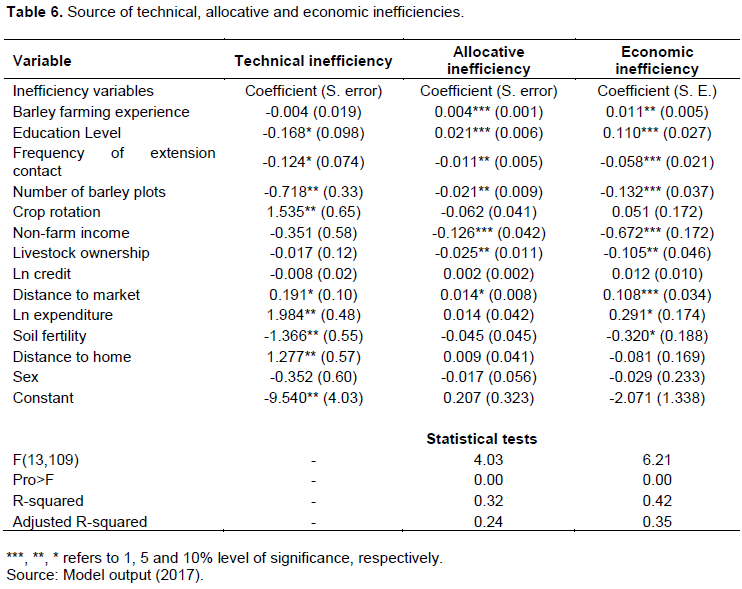
Farming experience: Unexpectedly, the coefficient of farming experience of farmer’s on barley production positively affected the economic inefficiencies of farmers significantly at 1 and 5% level of probability, respectively. Its positive sign might be due to the reason that those farmers having more experiences of farming may not be responsive for modern inputs combination that minimizes their costs. They may be experienced more on their traditional technology which consumes more money and time. So, as the farming experience increased by one year, the economic inefficiencies of farmers also increased by 1.1%, other factors kept constant. This result is in line with the result found by Adeyemo et al. (2010).
Level of education: The education level of farmer’s had unexpected positive relationship with economic inefficiencies significantly at 1% significance level. For every increment in education level by one years of schooling, economic inefficiency of farmers was increased by 11%, other variables remain constant. The positive sign might be due to higher education level providing more opportunity for off-farm works and farmers may give less attention to agricultural activities and also invest more of their time, knowledge and money to participate on off-farm works and other non-agricultural activities. In other word, they invest less amount of their income on purchasing agricultural inputs and choosing less combination of their resource at a given price of inputs. This result is in line with the results found by Vu (2008), Giang (2013), and Onumah et al. (2013).
Frequency of extension contact: As expected, the coefficient negative and significantly affected the level of economic inefficiency at 1% level of significance. This might be due to the reason that, the information obtained from extension workers had a power to increase the awareness and know-how of farmers towards technologies and efficient utilization of the existing resource to decrease their inefficiency and wastage of resource use. As the extension workers frequently visit and follow up farmers more, farmers may obtain important and influential information to decrease their economic inefficiency level by 5.8% ceteris paribus. This finding was in-line with Jude et al. (2011) and Mustefa (2014).
Number of barley plots: On the contrary to the expected sign, it had negative relationship and significant at 1% level of significance for economic inefficiency. It revealed that those farmers having more than one barley farm plots in different locations were more efficient. In the study area, the land is classified into three groups. The first one is plots located near their residence, the second one plots located far apart from the residence and the third one is having land suitable for cultivation of barley during belg season. In addition to this, farmers also cultivate barley by share-cropping system. So, all this enables them to have more farm plots at different location and reduce inefficiencies associated with risks that come due to frost or others natural catastrophes. In addition, it might be due to difference in the soil fertility of barley farm plots at different location, that is, on average fertile soils would help to earn higher output and improve efficiencies of farmers. The farmers are also more productive on small scale technology and they practice crop rotation by hand cultivation and animal traction. This finding was consistent with the findings of Tan et al. (2010), Yami et al. (2013) and Wudineh and Endrias (2016).
Non-farm income: It affected negatively economic inefficiency at 1% level of significance. This means that as compared to those farmers who had not participated on non-farm income activities, the economic inefficiency of farmers who had different non-farm income sources decreased by 67%. This indicated that, farmers used the income earned from different non-farm activities to cover their budget constraint to purchase the required farm inputs. This result was in line with Coelli et al. (2002), Shumet (2011) and Solomon (2014).
Livestock ownership: It affected economic inefficiencies negatively at 5% level of probability. This means that, farmers who increased their number of livestock holding by one TLU could decrease their economic inefficiency by 10.5%. The result also disclosed that farmers having largest number of livestock holding help to avoid cash constraint. This finding was consistent with the result obtained from Wassie (2012).
Distance to the nearest market: As expected, it affected economic inefficiency level positively and significantly. Since the distance of the nearest market to the farmer’s residence increased by 1 km, the economic inefficiency of farmers also increased by 10.8%. This implies that since the farmers are far from market, their inefficiency increases because it incurs more cost to transport inputs and outputs, transaction costs and to get market information. The result was in line with Hassen (2011) and Musa et al. (2015).
Total expenditure of the household: The coefficient of total expenditure of the household had a positive sign and significant effect on economic inefficiency at 10% levels of probability. Holding other variables constant, if expenditure of household increased by 1%, farmers’ economic inefficiency also increased by 0.291%. This might be due to the reason that, for those whose most of their income is spent for consumption purpose and construction of houses, this may cause cash deficiency to buy basic and required inputs to decrease their technical and economic inefficiencies. The result was in line with Mustefa (2014).
Soil fertility: It had significant and negative influence on economic inefficiency level at 10% levels of significance. It means that, as compared to those individuals having infertile lands, the economic inefficiency of farmers having fertile land had decreased by 32% holding other factors constant. Therefore, such policies to increase and maintain soil fertility of land must have a negative effect on inefficiency of barley production. The result was similar with the findings of Alemayehu (2010), Musa (2013) and Hailemariam (2015).
CONCLUSION AND RECOMMENDATIONS
The main aim of this study was show the degree of variation and identification of important variables that bring disparity of inefficiency among farmers. As expected, the result of the study clearly shows the presence of inefficiency variation among the farmers and identifies which variables strongly affected their inefficiency level and also showed that there is a huge opportunity to improve their efficiency level and increase barley output if appropriate measures are taken. Hopefully, this would help for concerned bodies and policy makers to intervene through different policies and strategies which minimize the inefficiency variation among them and bring all barley producers closer together at fully efficient level as much as possible with the available resource at their hand with the given technology and input at its disposal.
Based on the significant variables which affected all technical, allocative and economic inefficiencies level simultaneously, the following recommendations are forwarded. Since, appropriate actions and policies on these variables had a strong implication to narrow the gap of inefficiency variation among farmer, policy-makers who know why some farmers are relatively more inefficient than others will help to choose the most likely array of development programs for improving institutional and socio-economic factors contributing towards decreasing inefficiency.
Frequency of extension contact of farmers with extension agents significantly and negatively affected all inefficiencies level. Hence, strengthening the extension service and make it easily accessible to farmers is important. Since, development agents had a pivotal role to disseminate new production information, technologies and inputs from the research field to farmers on ground. Therefore, special emphasis and motivation should be given for those personnel so as to improve the efficiency level. This is possible by building the capacity of development agents or extension workers by providing practical attachment training with the current agricultural production.
The second important variable that requires serious emphasis was the number of barley plots. It had a negative effect on economic inefficiency. This means that, farmers having more barley plots were less inefficient than farmers having small number of barley plots. The policy which addressed this issue must be, farmers equally allocate their available inputs and resources used for cultivation of barley in each plots with rigorous use and as much as possible increase the productivity of inputs especially labor and land.
Thirdly, the result confirmed that education level of the household head had a positive effect on economic inefficiencies which indicated that formal education is probably not helped to decrease their inefficiencies. Therefore, it calls special emphasis to increase knowledge and education related to agricultural practices itself by upgrading the managerial ability of farmers or farmer’s education through youth training center and practical attachment training. It is also better to fill the knowledge gap among farm households by creating awareness and knowhow about the application of inputs and different farming system in the study area.
Finally, the other variable which had a positive effect on all inefficiency levels was the distance of the home from the nearest main market. The result suggested that policy makers would significantly decrease the inefficiency of sample farmers via the development of road and market infrastructure that reduce home to market distance.
CONFLICT OF INTERESTS
The authors have not declared any conflict of interests.
REFERENCES
|
Abu T, Teddy T (2014). GAIN (Global Agricultural Information Network) Report on assessments of commodity and trade issues made by USDA staff. Addis Ababa, Ethiopia. Report No. 1301. |
|
|
Adeyemo R, Oke JTO, Akinola AA (2010). Economic efficiency of small scale farmers in Ogun State, Nigeria. Tropicultura 28(2):84-88. |
|
|
Alemayehu E (2010). Analysis of factors affecting the technical efficiency of coffee producers in Jimma zone: a stochastic frontier analysis. MSc Thesis, Addis Ababa, Ethiopia. |
|
|
Arega AD, Rashid HM (2003). Measuring the impact of Ethiopia's new extension program on the productive efficiency of farmers. In Proceedings of the 25th International Conference of Agricultural Economists (IAAE) 16:22. |
|
|
Aung NM (2012). Production and economic efficiency of farmers and Millers in Myanmar Rice Industry. Institute of Developing Economies, Japan External Trade Organization. V.R.F. Series No. 471. |
|
|
Berhane G, Paulos Z, Tafere K, Tamru S (2011). Food grain consumption and calorie intake patterns in Ethiopia. IFPRI Ethiopia Strategy Support Program II (ESSP II) Working Paper 23. |
|
|
Bhende MJ, Kalirajan KP (2007). Technical efficiency of major food and cash crops in Karnataka (India). Indian Journal of Agricultural Economics 62(2):176. |
|
|
Bravo-Ureta BE, Pinheiro AE (1997). Technical, economic and allocative efficiency in peasant Farming: Evidence from the Dominican Republic. Developing Economies 35(1):48-67. |
|
|
Coelli T, Sandura TR, Colin T (2002). Technical, allocative, cost and scale in Bangladeshi rice production: A non-parametric approach. Agricultural Economics 53:607-626. |
|
|
Central Statistical Agency (CSA) (2016). Agricultural sample survey report on area, production and farm management practice of belg season crops for private peasant holdings P 5. |
|
|
Central Statistics Agency (CSA) (2014). Annual Statistics Bulletin: Addis Ababa, Ethiopia. |
|
|
Endalkachew Y, Admasu S, Fekadu G (2012). Technical efficiency analysis of malt barley production: The case of smallholder farmers in Debark Woreda. MSc Thesis, Haramaya University, Haramaya, Ethiopia. |
|
|
Food and Agricultural Organization (FAO) (2014). Annual report. Addis Ababa, Ethiopia. |
|
|
Giang TND (2013). Analysis of technical efficiency of crop farms in the northern region of Vietnam. PhD dissertation, University of Canberra, Canberra. |
|
|
Greene WH (1980). Maximum likelihood estimation of econometric frontier functions. Journal of Econometrics 13(1):27-56. |
|
|
Hailemariam L (2015). Technical efficiency in Teff production: The case of Bereh District, Oromia National Regional State. MSc Thesis, Haramaya University, Haramaya, Ethiopia. |
|
|
Hassen B (2011). Performance of mixed crop-livestock production system: The data envelopment approach. Livestock Research for Rural Development 23:200. |
|
|
Hassena M, Farah H, Mwangi W, Belay K (1999). Factors influencing technical efficiency of crop production in Assassa District of Southern Ethiopia. MSc Thesis. Alemaya University, Ethiopia. |
|
|
Jude C, Benjamen C, Patrick C (2011). Measurement and determinants of production efficiency among smallholder sweet potato farmers in Imo state, Nigeria. European Journal of Scientific Research 59(3):307-317. |
|
|
Komicha HH, Öhlmer B (2007). Influence of credit constraint on technical efficiency of farm households in Southeastern Ethiopia. |
|
|
Musa H, Lemma Z, Endrias G (2015). Measuring technical, economic and allocative efficiency of maize production in subsistence farming: Evidence from the Central Rift Valley of Ethiopia. Applied Studies in Agribusiness and Commerce 9(3):63-74. |
|
|
Musa H (2013). Economic efficiency of smallholder farmers maize production: The case of Arsi Negelle District of West Arsi Zone. MSc Thesis, Haramaya University, Haramaya, Ethiopia. |
|
|
Mustefa B (2014). Economic efficiency in barely production: The case of Chole district, East Arsi Zone, Oromia National Regional State, Ethiopia. MSc Thesis, Haramaya University. |
|
|
Onumah JA, Onumah EE, Al-hassan RM, Brümmer B (2013). Meta-frontier analysis of organic and conventional cocoa production in Ghana. Journal of Agricultural Economics 59(6):271-280. |
|
|
Seid Y (2002). Small-Scale Irrigation and Household Food Security: A Case Study of Three Irrigation Schemes in Gubalaf to Woreda of North Wollo Zone, Amhara Region. MSc Thesis, Addis Ababa, Ethiopia. |
|
|
Shahidur R, Gashaw TA, Solomon L, James W, Leulsegged K, Nicholas M (2015). The barley value chain in Ethiopia. REAP (Research for Ethiopias' Agriculture Policy). www.ifpri.org/publication/barley-value-chain-ethiopia |
|
|
Sharma KR, Leung P, Zaleski HM (1999). Technical, allocative and economic efficiencies in swine production in Hawaii: a comparison of parametric and nonparametric approaches. Agricultural Economics 20(1):23-35. |
|
|
Shumet A (2011). Analysis of technical efficiency of crop producing smallholder farmers in Tigray, Ethiopia. Munich Personal RePEc Archive (MPRA) Paper No. 40461. |
|
|
Solomon BW (2014). Technical efficiency of major crops in Ethiopia: stochastic frontier model. Academia Journal of Agricultural Research, 2(6):147-153. |
|
|
Susan C (2011). Technical and allocative efficiency of smallholder maize farmers in Zambia. M.Sc. Thesis, University of Zambia, Lusaka. |
|
|
Vu HL (2008). Essay on the economics of food production and consumption in Vietnam. ProQuest PhD Dissertation, University of Minnesota, USA. |
|
|
Wadi'ah M (2012). Malt barley technical production efficiency in south eastern Ethiopia. American Journal of Agricultural Sciences 3(1):2668-3725. |
|
|
Wassie SB (2012). Application of stochastic frontier model on agriculture: Empirical evidence in wheat producing areas of Amhara Region, Ethiopia. Books on Demand publishing, Germany. |
|
|
Wudineh G, Endrias G (2016). Technical efficiency of smallholder wheat farmers: The case of Welmera district, Central Oromia. Ethiopia. Journal of Development and Agricultural Economics 8(2):39-51. |
|
|
Yamane T (1967). Statistics: An Introductory Analysis, 2nd Edition, New York. |
|
|
Yami M, Solomon T, Begna B, Fufa F, Alemu T, Alemu D (2013). Sources of technical inefficiency of smallholder wheat farmers in selected water-logged areas of Ethiopia: A Trans log production function approach. Africa Journal of Agricultural Research 8(29):3930-3940. |
|
Copyright © 2024 Author(s) retain the copyright of this article.
This article is published under the terms of the Creative Commons Attribution License 4.0


