ABSTRACT
Food security at the household level in the rural areas of Ethiopia has remained a challenging goal until today. The design and implementation of effective measures to reduce household food insecurity needs an in depth understanding of its covariates. As a result, this study was conducted with the specific objectives of estimating the situation, extent and severity of food insecurity, identifying factors influencing food insecurity and the traditional coping mechanisms used by farm households in fighting food shortage in Shalla district of West Arsi zone, Oromia region. In order to achieve these objectives, data were collected from 150 randomly selected households in three randomly selected kebeles of the district. Data was analyzed using both descriptive statistics and econometric method. The results from descriptive statistics showed that of the total surveyed households, 62% were food insecure. In addition, results revealed that there was statistically significant difference between food insecure and food secure households with regard to different demographic, economic and institutional factors. Furthermore, the self-reported months of food shortage of the surveyed households was on average 3.5 months for which they have used different traditional coping strategies. The food insecurity gap and severity of the sampled households computed using Foster, Greer and Thorbecke (FGT) indices were 8.5 and 1.4%, respectively. The results of binary logit model showed that family size in Adult equivalent (AE), age and dependency ratio had significant and positive effect on food insecurity, while gender, cultivated land, livestock ownership in Tropical livestock units (TLU), oxen ownership, fertilizer use and income from safety net had a significant and negative effect on food insecurity.
Key words: Food insecurity, Logit, Foster, Greer and Thorbecke (FGT) indexes, Shalla.
Food security is an income issue, either in the form of one’s own food production or from non-agricultural activities such as employment to access food through the market (Dione, 2004). Its absence hinders the affected groups not to participate in other economic activities. In the year 2000, World leaders committed themselves to the number one Millennium Development Goal (MDG) of eradicating poverty and hunger, by half the proportion of people who suffer from food insecurity between 1990 and 2015. However, the 2003 World Food Summit review, in Rome predicted that many regions would not reach their MDG targets, particularly Sub-Saharan African (SSA) countries where a third of the population is food insecure and with an actual increase (through population growth) in the number of hungry people (Food and Agricultural Organization (FAO), 2004).
Ethiopias’ rural population is highly dependent on both crop and livestock production for their livelihood. However, the contribution of agriculture to food security declined as the growth in the food production could not keep pace with the population growth. The level of food insecurity also increases as to the distinction between transitory and chronic food insecurity has become increasingly blurred (PASDEP, 2005; FAO/WFP, 2012).
Ethiopian government and international donors are implementing different types of responses to food insecurity to attain food self–sufficiency and reduced food aid dependency (WFP, 2006). Regardless of substantial resources invested each year by the Government and its partners to reduce food insecurity, both chronic and transitory food insecurity problems continued at the household level (DPPA, 2010; European Union, 2012).
In fact, the general food security situation has highly deteriorated in different parts of the country particularly in Oromia (Disaster Risk Management and Food Security Sector, 2011). In Oromia region, over 90% of food supply comes from subsistence rain fed agriculture (Adgolign, 2006). But drought expanded even to previously rainfall sufficient areas and leading to fall in productivity and crop yield loss (BoFED, 2008). As a result, Oromia regional food security commission indicated that in the year 2007 alone 29% of the District found in the region are reported food insecure (ORRFSC, 2008). This magnitude increased to cover 46% of the District found in the region in the year 2011. Generally, in all zones, particularly in some part of Borena, Guji, Bale, Arsi and west Arsi and the two Hararghe zones, the general food security situation has been highly deteriorated due to the impact of the extended drought which affects the main livelihood of the society in all zones (DRMFSS, 2011).
The WAZDoPED (2012) classified Shalla District as one of the food insecure District found in the zone. Based on data obtained from WAZFS-DPPO (2011), due to recurrent drought occurring, the number of food aid beneficiaries’ in the District increased from 22 thousand in 2008 to more than 40 thousands in 2011/2012. According to the same source, the District is becoming the most food insecure demanding food aid for more than 25% of the population. Furthermore, the cycle of drought, famine and distress is widely increasing in study District. Off/non-farm opportunities to improve the lives of farmers and their families are limited. With ever increasing population and recurrent drought, the household food security situation is worsening in the study area.
The problem of food insecurity takes particular forms in its extent, causes and consequences at different level of analyses. Survival strategies also differ according to the degree of the problem, season and also by region, community, household, gender and age. As a result, preparation and implementation of different policies to improve the livelihoods of rural people in Oromia and food security situation needs area specific information on the problems of food insecurity. Intervention that may be based on past research finding conducted elsewhere may lead to erroneous results. Consequently, this study was undertaken in Shalla district of west Arsi zone of Oromia region with the general objective assessing factors influencing rural households’ food insecurity situation. The specific objectives of this study were:
1. To determine rural farm households’ food insecurity situation, food insecurity gap and its severity in Shalla district;
2. To identify factors influencing food insecurity of farm households in the study area;
3. To analyze the coping strategies that rural farm households of Shalla district use against food insecurity.
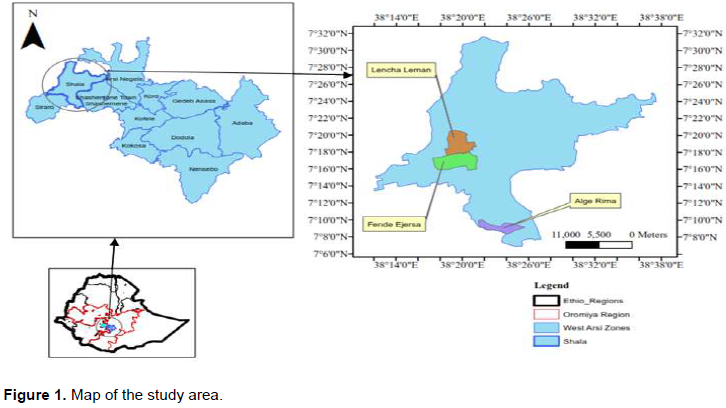
The study was carried out in Shalla district of West Arsi Zone of Oromia Region. It is 30 km from Shashamene and 279 km from capital Addis Ababa. The district is composed of 38 rural Kebeles and the capital, Aje. The elevation of the district is estimated to be in the range between 1000 and 2300 m above sea level. There are two agro-climatic zones found in the district namely kola (68%) and Woinadega (32%). The mean annual temperature of the district lies between 22 and 25°C. The district gets annual mean rainfall ranging from 1000 to 1200 mm (SWFEDO, 2012) (Figure 1).
Agriculture is the primary economic activity in the district where above 95% of the population engaged. Rain-fed crop production is the dominant production system in the district. Added with recurrent drought, the less fertility of land have diminished the contribution of the sector and pronounced food insecurity in the district. The major cereal crops produced in the district are maize, wheat and teff. There are also other cereal crops produced in the district like horse bean, barley and chick peas (SWFEDO, 2012).
Three stages stratified random sampling technique with probability proportional to size was used to draw three kebeles and 150 households. In the first stage, following the agro-climates, the kebeles of district were stratified into two strata namely kola (having 26 kebeles) and Woinadega (having 12 kebeles). In the second stage, using probability proportional to size, two kebeles from kola strata namely Algee Rimaa and Leenca Lamaan, and one kebele from Woinadega namely Fandee Ejersaa were randomly selected. Finally, using a simplified formula provided by Yamane (1967), a total of 150 households were randomly selected from respective lists of farmers in the three kebeles using probability proportional to size.
The study primarily relied on primary data which were collected by using a semi-structured questionnaire. The primary data collected by the semi-structured questionnaire focus mainly on those factors hypothesized to have an effect on the food insecurity status of households. The important sub-groups included in the questionnaire were: demographic characteristics, household assets, land resources, crop output and coping mechanisms used, use of modern agricultural input, livestock ownership, agricultural extension services, marketing services, credit services, off/non- farm employment and household consumption in last seven days. Relevant secondary data sources were also assessed to supplement the primary data.
The household food insecurity status was measured by direct survey of household consumption. Interview was made in the average period where there was neither surplus (harvesting season) nor shortage. In addition, there was no drought during the survey period. The principal person responsible for preparing meals was asked how much food was prepared for consumption from purchase, stock and/or gift/loan/wage over a period of time. In this study, a seven-day recall method was used since such a measure gives more reliable information than the household expenditure method (Bouis, 1993). According to Gulled (2006), these seven days recall period is selected due to the fact that it is appropriate for exact recall of the food items served for the household within that week. If the time exceeds a week, for instance 14 days, the respondent may not recall properly what he has been served before two weeks.
Therefore, the consumption data collected on the basis of seven days recall method were converted into kilocalorie using the food composition table manual adopted from Ethiopian Health and Nutrition Research Institute (EHNRI, 1997). Then, in order to calculate the households’ daily caloric intake, the total households’ caloric intake for the last seven days were divided by seven. The household’s daily caloric intake per adult equivalent was calculated by dividing the household’s daily caloric intake by the family size after adjusting for adult equivalent using the consumption factor for age-sex categories.
The results were compared with the minimum subsistence requirement per adult equivalent (AE) per day of 2,200 Kcal which is set by the Ethiopian Government (MoFED, 2008). Accordingly, this value of minimum subsistence requirement was used as a cut-off point between food secure and insecure households in which case the household is said to be food insecure if it fails to meets this minimum and secure otherwise.
Descriptive statistical tools were employed to explain the food insecurity situation of households with respect to demographic, socio-economic and institutional variables. The specific descriptive statistics used in this study include: tabulation, frequency, percentages, mean, and standard deviation. Statistical tests like T-test and Chi-square test were also used to compare food insecure and food secure households in the study area based on different demographic, socio-economic and institutional factors. To estimate head count ratio, food insecurity gap and to assess the severity of household food insecurity the Foster, Greer and Thorbecke (FGT) index was employed which was widely used for poverty measurement studies Hoddinot (2001). Following Hoddinot (2001), the class of FGT index was specified as follows:
Where:
n = number of sampled households,
q = number of food insecure households,
Z = cut-off between food security and food insecurity (2200kcal/AE/day)
yi = a measure of per adult equivalent food calorie intake of the ith household
α = the weight attached to the severity of food insecurity (take values 0, 1 and 2)
Due to recurrent drought occurring in the district, food shortage became a common phenomenon. But households used a variety of mechanisms to cope up with the food deficit. Consequently these coping mechanisms were identified and analyzed by using descriptive statistics (that is percentage).
Econometric model specification
In this study, the dependent variable Y (household food insecurity) is dichotomous variable taking value 1 if the household is food insecure and 0 otherwise. In the case where the dependent variable is dichotomous, probability regression models are the most fitting to study the relationship between dependent and independent variables (Gujarati, 2004). Therefore, in this study logit model is chosen for its simplicity and less complexity of its interpretation.
Then, following Gujarati (2004) logit model is specified as follows:
Before the execution of the above specified logit model, the explanatory variables were tested for the existence of multicollinearity where the explanatory variables are highly intercorrelated (Maddala, 1992). In this study, variance inflation factor (VIF) was used to detect the degree of linear relationship among the explanatory variables. The result showed that there was no serious problem of multicollinearity among the explanatory variables.
Definition of variables and hypotheses
In this study, household food insecurity status was taken as the dependent variable which is explained by different demographic, socio-economic and institutional factors. Variables definition and hypothesis are given as follows.
Family size (X1)
It refers to total family size in the household adjusted to adult equivalent consuming unit to capture the difference in food consumption by age and sex within the household. Zerihun (2009) and Indris (2012) concluded in their study that the higher the family size in adult equivalent, the higher would be the level of consumption which requires large quantity of food entailing positive relationship with food insecurity status. Thus, it is hypothesized in this study that family size in adult equivalent affects food insecurity status positively.
Sex of the household head (X2)
It is dummy variable taking a value of 1 if the household head is male and 0 otherwise. Sex of the household head is an important determinant of food insecurity. This is because, according to Abebaw (2003) and Abonesh (2006) male headed household are in a better position to pull labor force than female headed ones. In addition, Kassie et al. (2012) concluded in their study that due to differences in access to resources, female headed households are more likely to be more food insecure than male headed households. Therefore, it is hypothesized that male headed households are less likely to be food insecure.
Age of the household head (X3)
It refers to the period from his/her birth to the time of interview and was measured in years. According to Abebaw (2003), age of household head is negatively related with food insecurity in that households acquire experience and knowledge in farming and accumulate wealth through time which would enable them to be food secure than younger households. But according to Indris (2012), age of the household head is positively related with food insecurity in that food insecurity increases with the increase of age due to the fall in labor force of an individual so as to participate in different income generating activities which in turn helps households to access food. As a result the sign of age is pre-indeterminate.
Land cultivated (X4)
This refers to cultivated land size measured in hectares. Since it reflects ownership of an important resource, it is expected that, it would decrease the likelihood of household to become food insecure. That is, households with large cultivated land size would be expected to produce more and to be more food secure than those with less cultivated land. Thus, size of cultivated land and food insecurity were expected to be negatively related in accordance with the results of different researchers (Lewin and Fisher, 2010; Arene and Anyaeji, 2010).
Dependency ratio (X5)
It measures the number of members in non-working age group supported by those in the working age group; therefore it is a measure of the pressure on productive households. It is calculated by dividing household members below age of 15 and above 64 to that number of member in the age range of 15 up to 64. Arene and Anyaeji (2010) and Indris (2012) concluded in their study that dependency ratio positively affects food insecurity status of households. Thus, in this study it is hypothesized that dependency ratio contributes positively to the households food insecurity status.
Livestock owned (X6)
It refers to the number of livestock owned by the household in terms of tropical livestock unit (TLU). Livestock contribute to household’s economy in different ways: as a source of pulling power, source of cash income, source of supplementary food and means of transport. In addition, livestock are considered as a means of security and means of coping strategy during crop failure and other calamities. Thus, households with more number of livestock have a better chance to be food secure and thus, have less risk of food insecurity. Adugna and Wogayehu (2011) in their study in Wolayita, found that households with less number of livestock have more probability to be food insecure than households with more number of livestock.
Education level of the household head (X7)
This refers to the formal years of schooling attained by the household heads. Educational attainment by the household head could lead to awareness of the possible advantages of modernizing agriculture by means of technological inputs and diversification of household incomes which, in turn, would enhance household’s food supply. Thus, negative relationship between education level of the household heads and household’s food insecurity is expected in this study in accordance with many other studies result (Frehiwot, 2007; Ayantoye et al., 2011; Lewin and Fisher, 2010; Arene and Anyaeji, 2010).
Oxen owned (X8)
This refers to the number of oxen owned by the household to undertake its farming activities. Oxen are one of the important farm assets and are the major source of traction power in the study area. Abebaw (2003) noted that there is a symbolic relationship between crop production and oxen ownership in the mixed farming system. In addition, oxen provide manure and draught power to crop cultivation and therefore used to boost crop production. Therefore, ownership of more oxen power would enable households to have better chance to escape serious food shortages. The same result was also obtained by Habtom et al. (2005) in Koredegaga, Oromia region, Ethiopia. As a result, it is expected that number of oxen owned and food insecurity be negatively related.
Contact with development agents (X9)
It refers to the frequency that a farmer visited development agents for technical guidance. The higher the contact between the farmer and the development agent, the more information and technology flows from the latter to the former which in turn widens the household’s knowledge with regard to the use of improved variety and agricultural technologies. Therefore, those farmers with frequent contact are likely to produce more and become food secure than others and thus, reduce risk of food insecurity. Lewin and Fisher (2010) in their study in Malawi, found that farmers who are less frequently visited by the development agent are more food insecure than those farmers with frequent contact.
Proximity to market center (X10)
This refers to the distance between the farmers’ home and the nearest market that the household usually made transaction which is measured in kilometers. This is included because proximity to market center creates access to additional income by providing non-farm employment opportunities and easy access to inputs, extension and transportation. It is therefore hypothesized, in this study that the nearer the household to the market center, the less would be the probability of being food insecure. The same result was also obtained by Lewin and Fisher (2010). Therefore, in this study it is hypothesized that proximity to market center is positively related with food insecurity.
Fertilizer use (X11)
This refers to the use of chemical fertilizers such as urea and Di Ammonium Phosphate (DAP) to improve farm productivity. Here, it is measured as the total amount applied in the farm land of the household in the survey year in kilograms. Fertilizer use has often been perceived as improving farm productivity per unit area. Thus, households using more kilograms of fertilizer are expected to be more food secure than others. Zerihun (2009) and Adugna and Wogayehu (2011) concluded in their study that households using more quantity of fertilizers were more food secure than others. Hence, fertilizer use is hypothesized contributing negatively to food insecurity.
Improved seed use (X12)
This refers to those seeds that come out of research centers. Use of improved seed is expected to give better or more yield than local seed per unit area which in turn reduces the probability that the household become food insecure. As a result, households using improved seeds on their farm land have more potential of producing more crop output which in turn helps them to reduce risk of food insecurity. Adugna and Wogayehu (2011) concluded in their study that households not using improved seeds have more probability of being food insecure than others. As a result, use of improved seed is hypothesized to be negatively related with food insecurity.
Credit use (X13)
This refers to the amount of money borrowed from different sources. According to Abebaw (2003), credit for the purpose of consumption or purchase of agricultural inputs like improved seed, chemical fertilizers, etc improves the food security status (reduce risk of food insecurity) of the households. Consequently, households who are getting the amount of credit they required were expected to have more probability of being food secures than others. The result of Ayantoye et al. (2011) in Nigeria also confirms this result. Similarly, in this study it is hypothesized that the amount of credit received is negatively related with food insecurity.
Income from safety net (X14)
This refers to income earned from safety net by working on safety net public works or through direct support. The study area is one of the food insecure Districts under productive safety net program (PSNP in west Arsi zone. Households in the study area mostly cover their food shortfall through the income received by working on safety net public works. Therefore, households who have received higher income from safety net are more likely to reduce the risk of food insecurity than others. Zerihun (2009) concluded similar result in his work. As a result, income received from the safety net is expected to affect food insecurity negatively.
Income from off/non-farm activities (X15)
This refers to the sum total of earnings generated in the survey year from activities outside farming like retail trading business, casual work on wage basis, etc. When crop production output and income earned from sales of livestock and livestock products are inadequate, households often look for other income sources other than agriculture to push themselves to the threshold of securing access to food (Abebaw, 2003). Consequently, income earned from such activities enables households to reduce the probability of being food insecure. As a result, it is hypothesized that households who managed to earn higher off/non-farm income are less likely to be food insecure.
Descriptive results
Food insecurity status of the sampled households
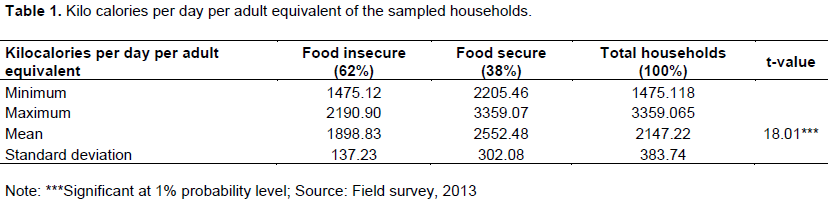
Results of food insecurity status of the sampled households based on the minimum recommended calorie requirement of 2200 kcal/day/AE shows that out of the total surveyed households, 62% were food insecure while only 38% were food secure (Table 1). The mean per capita calorie intake of the sampled household was 2147.22 kcal, which was lower than the minimum calorie requirement of 2200 kcal. Food insecure and food secure households were getting the mean calorie of 1898.83 and 2552.48 kcal/AE/day, respectively. There was statistically significant mean difference in per capita calorie intake between food secure and food insecure households at one percent probability level.
Demographic characteristics of households
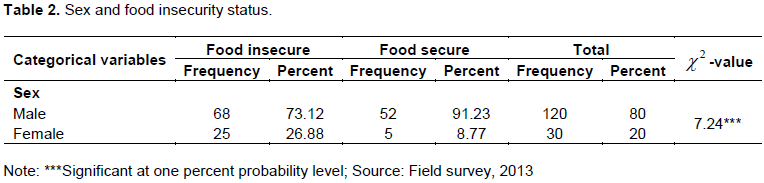
According to the survey results presented on Table 2, from the total sampled households, male headed households accounted for 80% while female headed households accounted for 20%. With this participation, female headed households were more food insecure which accounted for about a quarter of the total food insecure households or 83.33% of the total female headed households. In addition, male headed households accounted for about 91.23% of the total food secure households or 43.33% of the total male headed households. There was statistically significant proportion difference between food secure and food insecure households in terms of gender at one percent probability level. Thus, the result shows that there was great disparity of food insecurity status due to gender difference among the household heads.
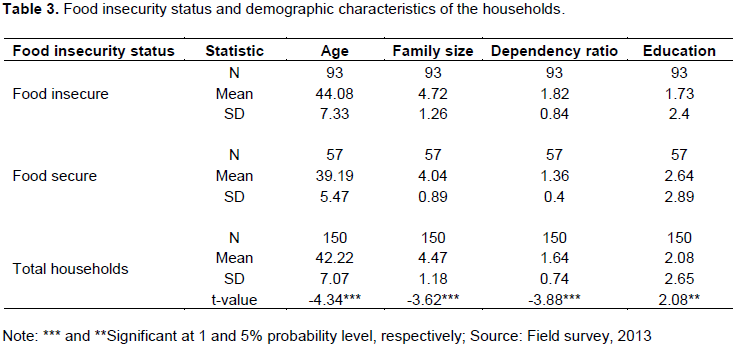
The results of the survey (Table 3) show that the average age of food insecure household heads (44.08 years) was greater than the average age of food secure households heads (39.19 years). In addition, in the study area food insecure households were characterized by large family size in adult equivalent and high dependency ratio. The result then shows that food secure households numbers of dependents living in the food secure households were also few relative to food insecure households. Furthermore, food secure households had also achieved more grade level than food insecure households which may help them to reduce the risks of food insecurity.
Economic factors
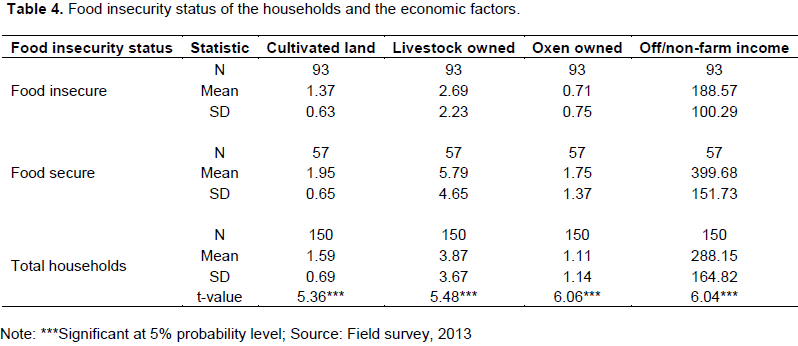
Average cultivated land of the sampled households was 1.59 ha with a standard deviation of 0.69 (Table 4). This average was greater than the national average of 1.18 ha and the zonal average of 1.42 ha (CSA, 2011). The average cultivated land was 1.37ha (SD=0.63) and 1.95ha (SD=0.65) for food insecure and food secure households, respectively. In addition, food secure household were also in a better economic condition having large livestock in Tropical livestock unit (TLU) and large number of oxen which are very crucial to determine the food security status of households in rural areas. Income earned from off/non-farm activities which are expected to supplement crop and livestock production was also relatively higher for food secure household in the study area. Therefore, the socio-economic analysis of the study area shows that food secure households possessed more resources which have boosted their production level and helped them to reduce the risks of food insecurity.
Institutional factors
The institutional factors analysis of the study area (Table 5) also shows the food secure households were relatively in a better condition. Food secure households have used more amount of fertilizer (132.84 kg) and improved seed (73.86 kg) on their cultivated land which are very important input to increase production and productivity levels of farmers in the study area. Thus, use of more yield increasing input by food secure households has helped them to reduce the risk of food insecurity relative to food insecure households who have cultivated very small size of land by applying less of these inputs.
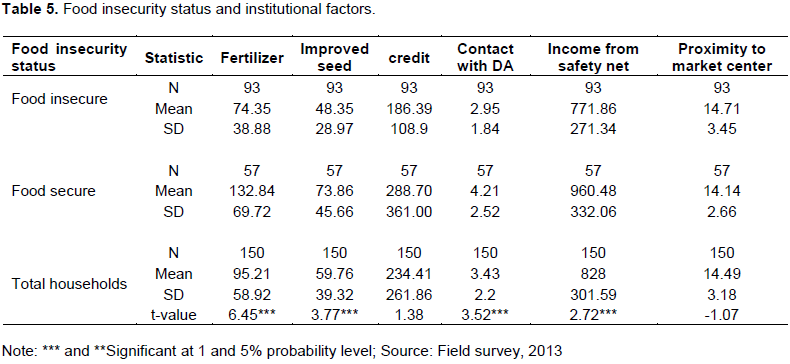
The mean amount of credit received by the food insecure households was Birr 186.39 (SD=108.9) while the average amount of credit received by the food secure households was Birr 288.70 (SD=361.00). The result was in agreement with the hypothesis made that the more the number of contact between the farmer and development agent, the less the probability of households to become food insecure. In addition, the mean annual income was Birr 771.86 (SD=271.34) and Birr 960.48 (SD=332.06) for food insecure and food secure households during the survey year, respectively. Results presented in Table 5 also shows that the mean distance of food insecure households to the nearest market was 14.71 Km while it was 14.14 Km for their counterparts.
Household food deficits
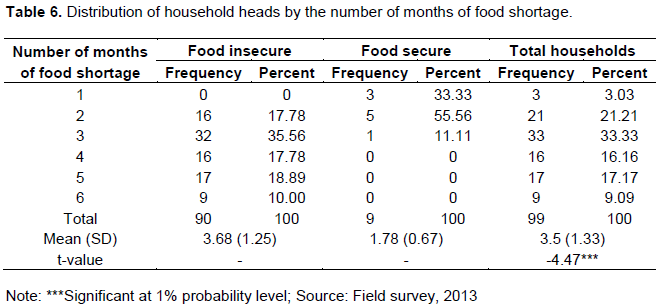
In this specific survey (Table 6) out of the sampled households only 34% reported that what they produced in the reference year was enough to feed their family. While the remaining 66% reported food deficit of an average 3.5 months during the survey year with the minimum of one month and a maximum six months. Among households reporting food deficit, 9% of them were from food secure households while the majority (91%) were from food insecure households. The result shows that food insecure households were facing more number of months of food shortage than their counterparts.
Causes of household food deficits
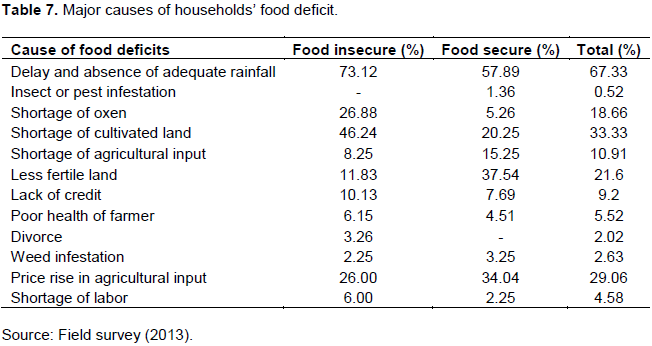
Households who had reported to had food deficit in the survey year were also asked to list the cause of food
deficit in order of their importance. Food insecure and food secure households accounted at about 73.12 and 57.89% mentioned the delay and absence of adequate rainfall as the first and the most pressing problem, respectively. The other most common causes of household food deficit in the study area were listed in Table 7.
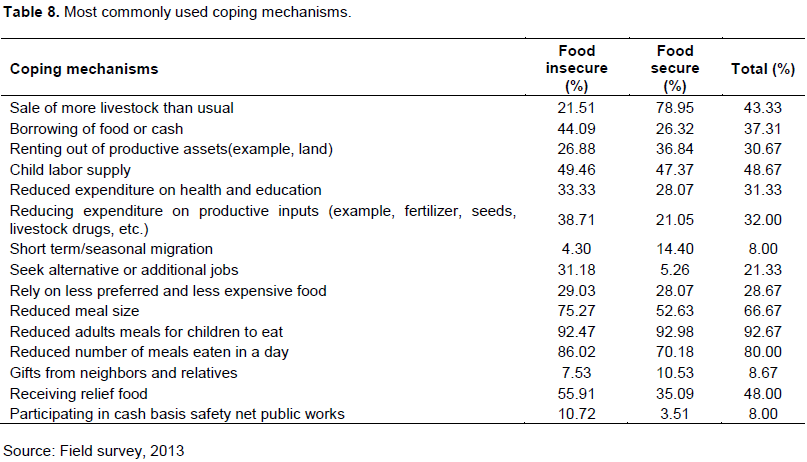
Households coping mechanisms against food deficits
As indicated, 66% of the surveyed households had reported food deficit of at least one month and above (Table 8). Then the next question raised for these households was to ask them ‘how did you cope with the food deficit’? They were asked how they were managing the problem of food shortage. Among the most common copping strategies practiced by majority of the households in the study were reducing adults’ meal for children to eat, reducing number and size of meals. But with the extension and increase in the severity of the problems households were also forced to practice the other different copping strategy against food deficit.
Extents of households food insecurity
In the study area, the head count index or the incidence of food insecurity was found to be 0.62 implying that 62% of sampled households could not meet the minimum recommended energy requirement. The food insecurity gap index (P1) came out to be 0.085. This means that the extent of calorie deficiency gap for the sampled household was 187 Kcal/AE/day. That is, an average of 187 Kcal/AE/day of additional energy food was needed to lift households out of food insecurity. Furthermore, the survey result revealed that the severity of food insecurity in the study area was 0.014 which means that the severity of food insecurity among the sampled household was 1.4%.
Econometric model results
Determinants of food insecurity
Binary logit model was used to identify the determinants of food insecurity. The model which was estimated using STATA version 11.1 revealed the following results (Table 9). The estimate value of Chi-square was 108.35 which was significantly higher than the critical Chi-square value of 30.58 with 15 degrees of freedom at one percent significance level. Thus, we can say that at least one of the parameters of the determinants of food insecurity included in the model was significant or the hypothesis that all the coefficients, except the intercept were equal to zero was rejected, implying the model was a good fit (Table 9).
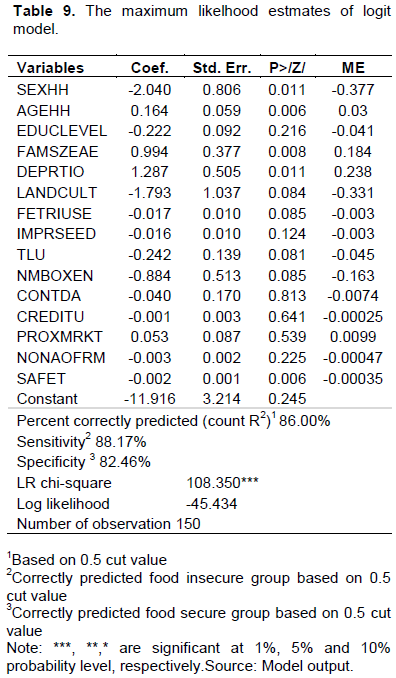
The predictive efficiency of the model as a measure of goodness of fit test in the logistic model was also seen by using the overall predictive efficiency (Count R2). Results in Table 9 showed that out of 150 total surveyed households, 86% (that is 129 households) were correctly predicted by the model. In addition, regarding the predictive power of the model within the group, 88.17 and 82.4% of food insecure and food secure households were correctly predicted by the model. Therefore, the model is good enough in classifying the surveyed households into food insecure and food secure households and it is appropriate for the data.
The logit model results also revealed that among fifteen explanatory variables considered, nine were statistically significant (Table 9). These include, age of household head, sex of the household head, family size in adult equivalent, dependency ratio, cultivated land size, fertilizer used, livestock holding in Tropical livestock unit (TLU), number of oxen owned and income from safety net. They significantly affected households’ probability of being food insecure at different probability levels. The signs of all explanatory variables were as expected. The discussions of significant variables are as follows:
Sex of household heads
It had significant and negative relationship with the household food insecurity status. It was significant at 5% probability level. The negative sign showed that male
headed households were more likely to be food secure than female headed households. Other factors remaining constant, food insecurity decreased by 37.7% for male headed households than female headed households. The possible explanation was the differential access to production resources where male had more access to production resources like cultivated land than females. This was similar with the work of different individuals (Firew, 2007; Zerihun, 2009 and Indris, 2012). Thus, it can be inferred from the result that sex difference in headship of the farm households was one cause of households’ food insecurity.
Family size
This variable was found statistically significant (at one percent probability level) and had positive relationship with the household food insecurity status. The positive sign showed that the probability that the household was food insecure increased as the family size in adult equivalent increases. Other variables remaining constant, increased in the family size in adult equivalent by a unit, increased the probability that the households was food insecure by 18.4%. The underlying reason was the fact that as family size increased, with limited resources additional family member increased the vulnerability of households to food insecurity by contributing more to consumption than to production. The result was in conformity with the works of Zerihun (2009) and Indris (2012).
Age of household heads
It had significant (at one percent probability level) and positive relationship with the household food insecurity status. The positive sign showed that the probability that the household was food insecure increased as the age of household head increases. Other variables remaining constant, increased in the age of the household head by one year, increased the probability that the household was food insecure by 3%. The possible explanation was that with the small pieces of land supporting the households, as the age of the household head increased, labour force of an individual would fall so as to participate in other different income generating activities which in turn increased exposure of households to food insecurity. This result was in conformity with the works of Indris (2012).
Dependency ratio
It had positive and significant relationship with the household food insecurity status. It significantly affected the food insecurity status of households at 5% probability level. The positive sign showed that the probability of becoming food insecure was high for households where productive members were less than unproductive members. Other variables remaining constant, the probability that the household was food insecure increased by 23.8% as the dependent age group increased by a unit. The possible reason was that high dependency ratio results in large numbers of dependents in the households with less contribution to production of households which in turn increased risk of food insecurity to the household. This was in conformity with the works of Adugna and Wogayehu (2011) and Indris (2012).
Land cultivated
It had significant (at ten percent probability level) and negative relationship with the household food insecurity status. The negative sign showed that the probability that the household was food insecure decreased as cultivated land increases. Other variables remaining constant, increased in cultivated land by one hectare, decreased the probability that the household was food insecure by 33.1%. The possible explanation was that, when cultivated land increased, households would be able to minimize its production risks or would be able to produce more which in turn helped to reduce food insecurity problem of his family. This result was in conformity with the hypothesis of this study and the works of Zerihun (2009).
Fertilizer use
This variable was found statistically significant (at ten percent probability level) and had negative relationship with the household food insecurity status. The negative sign showed that the probability that the household was food insecure decreased as the amount of fertilizer used increased. Other variables remaining constant, increased in the amount of fertilizers applied by one kilogram, decreased the probability that the household was food insecure by 0.3%. The possible explanation was that, increased in the use of fertilizer increased productivity and production. In addition, in the descriptive results it was shown that, less fertility of cultivated land was among the major cause of household’s food deficit in the area which in turn was increasing the problem of food insecurity in the area. As a result, use of increased amount of fertilizer could minimize the problems and furthermore could improve the problem of food insecurity. This result was similar with the results of Adugna and Wogayehu (2011).
Livestock holding
It had negative and significant relationship with the household food insecurity status. It significantly affected the food insecurity status of households at ten percent probability level. Other variables remaining constant, increased in the number of livestock holding in Tropical livestock unit (TLU), decreased the probability that the household was food insecure by 4.5%. The possible explanation was the fact that, households with large number of livestock in tropical livestock unit had better chance of earning more income from livestock production. This in turn helped households to buy foods when they faced shortage and invested for the purchase of farm input which increased production and thus ensuring food security at the household level. Similar result was also obtained by Indris (2012).
Number of oxen owned
This variable was found statistically significant and had negative relationship with the household food insecurity status. It significantly affected the food insecurity status of the households at ten percent probability level. Other variables remaining constant, increased in the number of oxen owned by one, decreased the probability that the household was food insecure by 16.3%. The possible explanation was that oxen as the most traction power in the area, helped households to produce more by themselves or to earn income by renting their oxen to others which in turn helped households to access food. Similar result was also obtained by Zerihun (2009).
Income from safety net
It had negative and significant relationship with the household food insecurity status. It was significant at one percent probability level. The negative sign showed that, households with large income from safety net had more probability of becoming food secure than others. The possible explanation was that the program provided additional income for the households with which they purchased foods from the market when their stock was very low and thus ensuring food security for their family. Other variables remaining constant, increased in income from safety net by one Birr, decreased the probability that the household was food insecure by 0.035%. The result was in conformity with the result of Zerihun (2009).
CONCLUSION AND RECOMMENDATIONS
The result of this study shows that 62% of the surveyed households were unable to get the minimum daily energy requirement. In addition, the food insecurity gap and severity of food insecurity was also high calling for intervention. Important factors positively related to food insecurity were age, gender, family size and dependency ratio. Therefore, interventions intended to help food insecure households in the area have to give priority to old aged and female headed households. Furthermore, strengthening capacity of females through education should be an integral part of the intervention. Households should also be educated on the need to adopt the family planning techniques so that they may bear the number of children which their resources can accommodate. Since majorities of the households in the study area are Muslims, natural birth control and other alternatives should be carefully assessed by considering the culture and religion aspects of family planning facilities.
Land, livestock and oxen ownership were negatively related with the food insecurity status of households in the study area. However, with an increase in population size of the District, land was becoming in short supply and the farmers were forced to produce crop on small plot of land (WAZDoPED, 2012). It is, therefore, important that the zonal and regional government should integrate development of the rural sector, the spread of small-scale industries throughout the rural areas and the reorientation of economic activity through promoting off-farm and non-farm employment opportunities. This could shift some proportion of households from entire reliance on land. Furthermore, livestock development packages must be introduced and promoted to increase their production and productivity. In addition, farmers’ capital problem should be solved through enhancing rural credits to the farmers. But provision of rural credit in the area should address the religious practice of households in the area. In addition, to increase their production and productivity necessary efforts should be made to provide improved water supply, sustainable forage program and veterinary services.
Income generated from safety-net was found to have negative effect on food insecurity status of households. This is because; safety nets in addition to meeting the immediate consumption needs of vulnerable households are intended to enhance productivity by allowing investment in agricultural input and prevent asset depletion of households which in turn complement households effort to manage potential shocks. Therefore, the program should continue its operation through proper targeting and identification of beneficiaries, and its fruit should be monitored and evaluated on continuous basis.
The authors have not declared any conflict of interests.
REFERENCES
|
Abebaw S (2003). Dimensions and determinants of food insecurity among rural households in Dire Dawa, eastern Ethiopia. An MSc thesis presented to the school of graduate studies of Alemaya University.
|
|
|
|
Abonesh T (2006). The impact of small scale irrigation on households' food security and assessment of its management system: the case of Feltino and Godino irrigation scheme in Ada Liben district, East Shewa, Ethiopia. An MSc thesis presented to the school of graduate studies of Haramaya University.
|
|
|
|
|
Adugna E, Wogayehu B (2011). Causes of household food insecurity in Wolayita: Southern Ethiopia. Journal of Stored Products and Postharvest Research, 3(3):35-48.
|
|
|
|
|
Arene CJ, Anyaeji RC (2010). Determinants of food security among household in Nsukka metropolis of Enugu State, Nigeria. Pakistan Journal of Social Science, 30(1):9-16.
|
|
|
|
|
Ayantoye K, Yusuf SA, Omonona BT, Amao JO (2011). Food insecurity dynamics and its correlates among rural households in South Western Nigeria. International Journal of Agricultural Economics and Rural Development, 4(1): 43-55.
|
|
|
|
|
Bureau of Finance and Economic Development (BoFED) (2008). Oromia atlas: Oromia Finance and Economic Development Bureau. Addis Ababa.
|
|
|
|
|
Bouis H (1993). Food consumption surveys: How random are measurement errors? In: J. von Braun and D. Putez. Data needs for food policy in developing countries: IFPRI, Washington DC.
|
|
|
|
|
Central Statistical Agency (CSA) (2011). Report on land utilization (Private peasant holding, Meher season), Agricultural sample survey 2010/2011: Statistical bulletin, volume VII, Addis Ababa, Ethiopia.
|
|
|
|
|
Dione J (2004). Assuring food and nutritional security in Africa by 2020: A discussion paper for IFPRI.
View
|
|
|
|
|
Disaster Prevention and Preparedness Agency (DPPA) (2010). Time series data of Ethiopia's Disaster Prevention and Preparedness Agency.
View
|
|
|
|
|
Disaster Risk Management and Food Security Sector (DRMFSS) (2011). Food supply prospect in 2011, early warning system report. Addis Ababa, Ethiopia.
|
|
|
|
|
Ethiopian health and nutrition research institute (EHNRI) (1997). Food composition table for use in Ethiopia. Part III, from 1968-1997. A research project sponsored by government of Ethiopia through former ENI and EHNRI.
|
|
|
|
|
European Union (EU) (2012). Effectiveness of European Union development aid for food security in Sub- Saharan Africa: Special report No. 1, 2012.
|
|
|
|
|
Food and Agriculture Organization of the United Nations (FAO) (2004). The state of food insecurity in the world. Rome.
|
|
|
|
|
Food and Agriculture Organization and World Food Programme Ethiopia (FAO/WFP) (2012). Special-report- FAO/WFP crop and food supply assessment mission to Ethiopia, Addis Ababa.
|
|
|
|
|
Frehiwot F (2007). Food insecurity and its determinants in rural household in Amhara Region. An MSc thesis presented to the School of Graduate Studies of Addis Ababa University, Addis Ababa.
|
|
|
|
|
Guajarati DN (2004). Basic econometrics, 4th Edition: McGraw-Hill Inc. New York.
|
|
|
|
|
Gulled A (2006). Food insecurity and coping strategies of Agro-pastoral households in Awbare Woreda, Somali Region, Ethiopia: An MSc. thesis presented to the School of Graduate studies of Haramaya University.
|
|
|
|
|
Habtom K, Zerihun G, Kudhlande G (2005). Causes of household food insecurity in Koredegaga Peasant Association, Oromia Zone, Ethiopia. Paper submitted to Department of Agricultural Economics at the University of the Free State, South Africa.
|
|
|
|
|
Hoddinot J (2001). Methods for rural development of food security in practice: IFPRI, Washington, D.C.
|
|
|
|
|
Indris S (2012). Assessment of food insecurity, its determinants and coping mechanisms among pastoral households of Afar National Regional State, the case of Chifra district. An MSc thesis presented to the School of Graduate Studies of Haramaya University.
|
|
|
|
|
Kassie M, Ndiritu SW, Shiferaw B (2012). Determinant of food security in Kenya, a gender perspective. Paper Presented to Annual Conference of Agricultural Economics Society. University of Warwick, UK.
|
|
|
|
|
Lewin P, Fisher M (2010). The determinants of food insecurity in rural Malawi: implications for agricultural policy. Malawi Strategy Support Program (MaSSP). Policy Note 4:1-3.
|
|
|
|
|
Maddala GS (1992). Introduction to econometrics, 2nd edition: Macmillan publishing co. New York.
|
|
|
|
|
Ministry of Finance and Economic Development (MoFED) (2008). Dynamics of growth and poverty in Ethiopia. Addis Ababa, Ethiopia.
|
|
|
|
|
Oromia Regional Rural Food Security Commission ORRFSC () (2008). Oromia Regional Rural Food Security Commission. Addis Ababa, Ethiopia.
|
|
|
|
|
Plan for Accelerated and Sustainable Development to End Poverty (PASDEP) (2005). Building progress-a plan for accelerated and sustainable development to end poverty: Volume I, Main Text. Addis Ababa, Ethiopia.
|
|
|
|
|
Shalla Woreda Finance and Economic Development Office (SWFEDO) (2012). Physical and socio-economic condition of Shalla Woreda: Unpublished Document.
|
|
|
|
|
West Arsi Zone Department of Planning and Economic Development (WAZDoPED) (2012). Socio-economic profile of West Arsi Zone, West Arsi Zone Bureau of Planning and Economic Development. Unpublished document
|
|
|
|
|
West Arsi Zone Food Security-Disaster Preparedness and Prevention Office (WAZFS-DPPO) (2011). Emergency food security assessment. Unpublished document
|
|
|
|
|
World Food Program (WFP) (2006). A review of emergency food security assessment practice in Ethiopia: A study commissioned and prepared for World Food Programme, Rome.
|
|
|
|
|
Yamane T (1967). Statistics: An introductory analysis, 2nd Ed. New York: Harper and Row.
|
|
|
|
|
Zerihun N (2009). Food insecurity, its determinants and rural households coping mechanisms, the case of Mareko woreda, SNNPR, Ethiopia. An MSc thesis presented to School of Graduate Studies, Haramaya University.
|
|