Full Length Research Paper

ABSTRACT
Merely providing support on improved yields for increased crop productivity to smallholder farmers can not improve the household food security. But parallel support for market linkages to crop producer smallholders can reap the full benefit of this increased crop productivity because lack of reliable and accessible market linking system has been found to be one of the main constraints faced by smallholder crop producer farmers for their food security improvements. So understanding the effects of crop market participation for the improvements of household food security has essential effects. The focus of this study is analyzing the effects of crop market participation in improving food security among smallholder crop producer farmers in the case of Ada’a woreda, Central Ethiopia. 160 sample size respondents of crop producer smallholder farmers represent this study. Both qualitative and quantitative data were collected from primary and secondary sources. Interview schedules, focused group discussions and key informant interviews were the major data collection methods. Descriptive statistics, Tobit and multinomial logit econometric regression models were employed and operated for the analysis. The result showed that, high, low ad medium degree of crop market challenges and arable land size were significantly identified factors and affected household crop market participation intensity negatively. While none degree of crop market challenges and extension service for the household per year were significantly identified factors and affected household crop market participation intensity positively. Multinomial logit regression result revealed that, household crop market participation intensity was found significant at 1% sig. level on both moderately food secured (51_79) and food secured (80_102) household food security levels relative to food insecure (0_50) and showed its positive effect for the household food security improvement. As a result, though household crop market participation intensity influenced the household food security significantly at 1% sig. level but the food insecure situation is the most frequently occurring situation in the woreda. This implies the household crop market participation intensity in the woreda is low and producing crop for the purpose of household consumption rather than for market. Which indicated that crop market challenge reduced ways of interventions by triggering the augmentation of reliable and accessible marketing system through adaptable crop market linking approach is required for the central Ethiopia household food security enhancement.
Key words: Crop market participation, food security, smallholders, Central Ethiopia/Ada’a woreda.
INTRODUCTION
Globally, the smallholder farmers are estimated to be around 500 million and produce food to about 80% of the population, but at the household levels, they themselves continue to be food insecure (Upali et al., 2014). The authors also stated that, those smallholder farmers are paradoxically the poorest and most food-insecure.
Many literature such as "Agriculture for impact" had revealed the necessity of market linking systems for the entire life change of smallholder farmers by taking farm Africa's endeavor as an example claimed that, over the last 25 years, farm Africa has provided essential field level support for improved yields on smallholder farms in Africa. However, it is very clear that without parallel support for market linkages and value addition, smallholders will not reap the full benefit of this increased productivity (Agriculture for Impact, 2013). Thus, defining and researching the capable, possible and acceptable ways to foster reliable and accessible marketing system for the smallholder farmer's food security improvement need high attention.
Government of Alberta (2015) claimed that, marketing should be more than just selling. Marketing includes setting financial goals, assessing risk, exploring pricing and deliver alternatives, seeking market opportunities, and keeping one’s pride in check. Moreover, good marketing takes planning, selling discipline, access to good market information and a good understanding of pricing and delivery alternatives. Expecting to price everything at the market peak is unrealistic (Alberta, 2015).
Lack of reliable markets has also been found to be one of the main constraints faced by smallholder farmers. The majorities of smallholder farmers are not capacitated with financial and marketing skills and are unable to meet the quality standards set by fresh produce markets and food processors (Department of Agriculture, Forestry and Fisheries, 2012).
Leykun and Jemma (2014) stated about Ethiopia’s agriculture that, the agricultural sector is predominantly subsistence where the major part of farm production is used for household consumption rather than for market. According to these authors, smallholder peasant farms cultivate close to 95% of the total cropped land and produce more than 90% of the total agricultural output. From these we can understand that, lack of reliable markets has also been found to be one of the main constraints faced by the majority of Ethiopian smallholder farmers in the country. Such limitation of reliable and accessible market opportunities, forced those majority smallholder farmers to be less market participant in the agriculture sector specifically in crop market participation that has led its production to be limited merely for household consumption rather than for market. The remaining produced crop from the household consumption is sold for traders with low prices. Such low crop market participation by smallholders leaves them with little income for long last till the upcoming harvesting season which also exposes them for unimproved food security and to lead vicious life cycle style. Such situation needs intervention as stated by the following literature.
Barrett (2007) claimed that, stimulating increased participation by most smallholders and thus greater reach for price and trade policies in affecting food supplies and farming households’ welfare will likely require interventions to address the entry barriers that impede food grains market participation. Smallholders face two basic classes of entry barriers. The first are micro-scale associated with households’ insufficient private access to productive assets, financing and improved production technologies with which to generate adequate marketable surplus to make market participation feasible and worthwhile (Barrett, 2007). Therefore, in order to shape the current crop production which is limited merely for household consumption rather than for market, market linking systems for Ethiopian smallholder crop producers is necessarily required to enhance the crop producers sale of output which is highly helpful to improve their household food security; therefore, endeavoring for the establishment of reliable and accessible market opportunities to the Ethiopian smallholder crop producers become necessary not only for household food security improvement but also for further crop producers entire life improvement.
Studies by Williamson (2007), North (1991) and Matungul et al. (2002) claim that, the establishment of new institutions with the intent of lowered transactional cost centered institutional economics are required to reduce the implicit cost (that is, cost of banking and marketing, cost of new partner searching, cost of gathering market information, cost of traveling and waiting time) and to reduce the explicit cost (that is, cost of transport, for example bus fares). In addition, IFDC (2015) claimed that, a certain level of organization among smallholder farmers can be quite beneficial to helping them access markets; improved knowledge of how to access markets and how to engage in transactions in competitive markets is also required. Improved access to timely information on prices is needed so that farmers can respond to market incentives and thereby help improve food security at the family and national levels. Enabling favorable policies that allow for the development of farmer-to-market linkages are required (IFDC, 2015).
Maxwell and Smith claimed that, in the 1970s, "food security" was mostly concerned with national and global food supplies and in the 1980s, the focus of "food security" shifted to questions of access to food at household and individual levels (Maxwell and Smith, 1991).
Hoddinott and Yohannes (2002) claimed that, household food security is an important measure of well-being and food security encompasses three dimensions: availability (a measure of food that is, and will be, physically available in the relevant vicinity of a population during a given period); access (a measure of the population’s ability to acquire available food during a given period); and utilization (a measure of whether a population will be able to derive sufficient nutrition during a given period). Moreover, the authors stated that, although it may not encapsulate all dimensions of poverty, the inability of households to obtain access to enough food for a productive healthy life is an important component of their poverty (Hoddinott and Yohannes, 2002).
Hoddinott (1999) also claimed that, food security is a concept that has evolved considerably over time and there is much literature on potential household food security indicators. There are approximately 200 definitions and 450 indicators of food security. In addition, in the same work of Hoddinott, dietary diversity, individual intakes, household caloric acquisition and indices of household are identified as the four ways of measuring household food security outcomes. Thus, this study had measured the smallholder crop producer's household food security improvements, due to their market participation in terms of dietary diversity. Based on the Hoddinott description, dietary diversity is the sum of the number of different foods consumed by an individual over a specified time period. Further, this author reported on dietary diversity, as it may be a simple arithmetic sum, the sum of the number of different food groups consumed, sums of the number of different foods within a food group, or a weighted sum-where additional weight is given to the frequency by which different foods are consumed (Weighted Sum is = number of food Items + consumption frequency of households individual).
Rios et al. (2009) argues that, market participation is directly associated with the generation of a market surplus, thus production technologies and productive assets affect a household’s market participation by influencing its productivity. The author furthering that, on the other hand, local market conditions influence incentives to increase productivity. Moreover, the author stated that, poor infrastructure and weak institutions raise transaction costs that considerably alter production and market participation decisions. As a result, increasing rates of market participation or productivity could have bidirectional synergies, and increasing both could boost living standards. Many studies address the impact of either market participation or productivity on farmers’ income, and some studies relate them to each other. Little research to date, however, asks to what extent these factors influence each other and almost no research examines empirical evidence on this matter at the whole-farm level across a range of countries (Rios et al., 2009).
This study argues that increasing the rate of household crop market participation demands a greater attention for the increment of Ethiopian smallholder crop producers’ market participation intensity. This is further supported by the work of Berhanu and Moti (2010) who stated that, the average crop output and crop input market participation of Ethiopian smallholders are 25 and 20%, respectively, which indicate infant market participation situation. The research conducted on this study area showed the degree of smallholder farmers crop market participation for the typical household head is computed to be 22.4% (Leykun and Jemma, 2014). This clearly indicates the degree of crop market participation in Ada’a woreda is smaller than the average output market participation of the country at 25% as aforementioned. The authors also defined that, the degree of crop market participation is the ratio of the gross value of all crop sales to the gross value of all crop production times hundred (Leykun and Jemma, 2014). Thus, the situation of lowered crop market participation intensity in Ada’a woreda related with the average output market participation intensity of the country, triggered the researcher to assess crop market situation of crop producer farmers in the woreda, to identify factors of crop market participation intensity on crop groups of roots/tubers, cereals and beans/groundnuts and the researcher also triggered to analyze the effects of household crop market participation intensity on the improvement of household food security. The researcher believed that the situation needs high attention to establish reliable and accessible marketing system. Because this reliable and accessible marketing system enables crop producer smallholder farmers to have enhanced market participation intensity at the household level and has a capacity to generate increased sale value thereby from that sale value the smallholder farmer households can get income which can be able to improve their household food security. This is further elaborated by the following literatures.
Food security revolves around income generation as much as it does in assuring that aggregate production meets aggregate demand (Alderman, 1992). The author also, empirically stated that, low income appears to be the main constraint to calorie consumption. This is indicated by the pronounced increase of calories with increased income at lower levels of long-run income in the household. Kirimi et al. (2013) claimed that, market participation can play a significant role in reducing food poverty, thus ensuring food security. This suggests that facilitating the expansion of market participation by smallholder farmers can be critical in helping households transition out of food poverty (Kirimi et al., 2013).
Previous studies, such as Leykun and Jemma (2014), Osmani and Hossain (2015), Nwigwe et al. (2009), Achandi and Mujawamariya (2016), and Berhanu and Moti (2010), focused merely on degree of smallholder market participation and/or determinant factors for smallholder market participation intensity. But uniquely, this study is not limited on the factor identification of household crop market participation intensity on crop groups and on the assessment of crop market situation of crop producer farmers in Ada’a Woreda. The study had further analyzed crop producer smallholder's crop market participation intensity on crop groups of roots/tubers, cereals and beans/groundnuts and its effects for the improvement of household food security which has not been carried out in the country before. In this way, the study bridges the knowledge gap of the effects of household crop market participation intensity for the crop producer household food security improvement by identifying household crop market participation factors and by assessing crop market situations, particularly for the specific area of Ada’a Woreda. This analysis was done by the employment of simple summary of descriptive statistics, tobit and multinomial logit econometric regression models. All were employed to assess crop market situation of crop producer smallholder farmer households in the study area. These were to identify factors of crop market participation intensity on crop groups and lastly the study analyzed the effects of crop market participation intensity for the improvement of household food security.
MATERIALS AND METHODS
Study area
The study was conducted in Ada’a Woreda of the Eastern Shewa zone located at about 45 km south-east of the capital Addis Ababa. White teff, black teff, wheat, maize, barley, onion, potato, lentils, white/black chickpeas, soy, beans, etc., are the main crops cultivated in Woreda. According to Population Projection from 2014 to 2017 of Central Statistical Agency (CSA, 2013), total rural population of Ada`a Woreda is 155,035, from this 80,537 are male and 62,452 are female.
According to Nigatu et al. (2012), Ada’a Woreda lies between longitudes 38°51’ to 39°04’ East and latitudes 8°46’ to 8°59’ North covering a land area of 1750 km2 on east of Addis Ababa. Most of the land (90%) is plain highland ranging between 1600 and 2000 m above sea level. The Woreda is characterized by sub-tropical climate and receives 860 mm rainfall/annum. In general, the main rainy season occurs between mid-June and September, followed by a dry season that might be intercepted by the short rainy season in February and March (Figure 1).

Research design and approach
A cross sectional research design was employed and operated due to its complement to obtain information and to understand the awareness on the effects of household market participation to the improvement of household food security and its challenges at one time occasion. Quantitative and qualitative approaches were also employed as both the approaches could provide broader and deeper understanding of the issue
Population, sample size determination and sampling technique
Ada’a Woreda is selected as a target population of this study. The sample size for this study was calculated based on the following assumption. The total population of the Ada’a Woreda is about 155,035 as the aforementioned literature in the description part and as carried out by Leykun and Jemma (2014), the degree of market participation of the Woreda is 22.4% which indicated that around 34,728 crop market participants are available; this number is less than 50,000. Therefore, Godden (2004) is appropriate to calculate the sample size. So, the new sample size for the population less than 50,000 is calculated as follows:

where New SS = New Sample size and Pop = Population which is 22.4% (that is, 34,728).
Therefore, assuming that the sample size is 150,

The total sample of the respondents becomes 149. By assuming 8% for contingency, it becomes 160, according to Ada’a Woreda's finance office data, this sample size can be a representative for total rural household male number 16,793, for total rural household female number 2,776 and for total male number of families under household 42,072 and for total female number of families under household 53,012 household situations in the rural.
The sampling technique for this study was a multi-stage sampling. This was done first by selecting high, medium and low household crop market participants 4 rural kebeles among the 26 kebeles, after stratifying 26 rural kebeles of the study area into 3 stratums (kebeles holding high, medium and low crop market participant households) in the Woreda; by randomizing households within the kebeles. Second, to conduct quantitative survey, respondents from each kebeles are determined with a proportional to sample size and simple random sampling is run to each member kebeles of the sampling households in order to have equal chance of being picked for the sample (Table 1):

Numbers of crop market participants of a household were identified, by the degree of market participation which is the ratio of the gross value of all crop sales to the gross value of all crop production times hundred (Table 1).

Data collection tools and instruments
Semi-structured questionnaire that had been adjusted with schedule and translated Amharic e and Afan Oromo language translator enumerators for effective communication with 160 respondents were used as the main instrument to quantitative data in order to investigate the association between the dependent and independent variables of the data about the assessment of crop market situation of crop producer farmers in Ada’a Woreda, factors affecting crop market participation and effects of smallholder crop market participation on food security at the household level of the smallholder farmers.
A key informant interview of an open-ended questionnaire interview guide was the other tool which had been applied for purposively selected expert of agriculture extension service deliverers in Ada’a Woreda that was held face to face and for qualitative information that was about the assessment of crop market situation of crop producer farmers in Ada’a Woreda, factors affecting smallholder crop market participation intensity and effects of crop marking on food security.
Focus group discussion is the other enhancing tool which was conducted by purposively selected participants in the intent of 160 sample size household representation that was applied for household heads who were highly facing crop market challenges, none facing ones and moderately facing ones of the challenges were those from formally organized structured groups of individuals from crop marketing associations and individuals from Equb and Edir (Ethiopian Cultural Social Associations self-formation to help each other), among which both active crop market and less crop market participants were selected and also from other concerned households who came together and discuss on a series of issues within limited time period. Thus qualitative information was about the assessment of crop market situation of crop producer farmers in Ada’a Woreda; factors affecting smallholder crop market participation intensity and effects of crop marking on food security were discussed.
Methods of data analysis
Descriptive statistics
For specific objective, to assess crop market situation of crop producer farmers in Ada’a Woreda, the study used descriptive statistics in order to describe variables which was done by employing simple statistical summary by operating the variables mean, standard deviation, minimum and maximum values.
Regression analysis and rationales of using Tobit and multinomial logit models
To address specific objective (2), that is, to identify factors affecting crop market participation intensity for smallholder crop producer farmers' in Ada’a Woreda, the study used Tobit econometric regression model. James Tobin who proposed Tobit model for the first time in 1958 had explained the necessity of Tobit model by stating that, in economic surveys of household, many variables have a lower or upper limit and takes on the limit value for a substantial number of respondents. For the remaining respondents, the variable takes on a wide range of values above or below, the limit (Tobin, 1958). Thus, for doing such variable characteristics survey of households, this Tobit model is essential. Nevertheless, here James Tobin agrees that, the sample may give unbiased estimates of the parameters of the relationship, even though it gives biased estimates of the separate frequency distribution of the variables. For such sample selection biased estimation problems (Gujarati, 2003) suggested as Heckman model is appropriate. Moreover, Fernando (2011) claimed the reasoning behind using Tobit model by stating that, if we include the censored observations as y = 0, the censored observations on the left will pull down the end of the line, resulting in underestimates of the intercept and overestimates of the slope. If we exclude the censored observations and just use the observations for which y>0 (that is, truncating the sample), it will overestimate the intercept and underestimate the slope. The degree of bias in both will increase as the number of observations that take on the value of zero increases. The Tobit model uses all the information, including information on censoring and provides consistent estimates (Fernando, 2011).
To achieve specific objective (3), that is, to analyze the effect of crop market participation on household food security, the study used multinomial logit econometric regression model. As stated by Richard (2017), when categories are unordered, multinomial logistic regression is one often-used strategy. Mlogit models are a straightforward extension of logistic models.
Specification of the models
For achieving specific objective (2), that is, to identify factors affecting crop market participation intensity for smallholder crop producer farmers' in Ada’a Woreda, following Gujarati (2003), the study employed the Tobit model on the sampling procedure that was followed during survey data collection. Based on the aforementioned literature by Fernando (2011) explanation since Tobit model uses all of the information, including information censoring from below and above threshold points and provides consistent estimates, it has been chosen and applied.
For this specific objective (2), following Gujarati, the Tobit model is specified as follows:

where Y* is a censored variable of the household (h) market participation (mp):

where α = is an intercept, βi = a parameter to be estimated, X= is a vector of explanatory variable, and ε = is the error term.
To address the specific objective (3), multinomial logit econometric regression model, which was adopted and modified from Richard (2017), has been employed. As explained earlier, this specific objective is to analyze the effects of crop market participation on household food security improvement. According to the author, the study supposed that household food security has M or three categories. Among these categories, one value (typically the first, the last, or the value with the highest frequency) of among the household food security level is designated as the reference category. For household food security with M (three) categories, this requires the calculation of M-1 equations, one for each category relative to the reference category, to describe the relationship between the household food security levels and the reference groups.
Hence, if the first category is the reference, then for m = 2… M,

For each case, there will be M-1 predicted log odds, one for each category relative to the reference category (Note that when m = 1, we get ln(1) = 0 = Z11 and exp(0) = 1).
When there are more than 2 groups, computing probabilities is a little more complicated than it is in logistic regression. For m = 2… M,

In other words, the study takes each of the M-1 log odds, thereby computed and exponentiate it. Once the calculation of the probabilities is straightforward, note that, when M = 2, the mlogit and logistic regression models (and for that matter the ordered logit model) become one and the same. Where,
α is an intercept and  =Continuous unmeasured variable (latent Variable) in this case household food security improvement on crop groups (i), Xki = is the effects influencing household food security improvement on crop groups (i), β and M-1= are parameters to be estimated.
As the aforementioned literature of Leykun and Jemma (2014), defined the degree of market participation, which is as the ratio of the gross value of all crop sales to the gross value of all crop production times hundred. Therefore, this can be the measurement for the level of crop market participation intensity on crop groups to this study. Matungul et al. (2002) also empirically indicated that, food crop income of the household is explained by the sale value of the crop producer, sale value represents the total food crop income in birr of marketed output per household that affect the household food security directly. So the household sale value raises the household crop market. Participation intensity increases, this in turn increases the household income and thus enhances the household food security.
From the aforementioned formulas, household crop market participation intensity on crop groups and other transactional cost related explanatory variables had shown their effect on dependent variable household food security for the third objective via multinomial econometric regression model. The value of household food security outcomes of smallholder crop producer farmers was at measured by dietary diversity as the aforementioned literature the introduction part. Whereas the value of household crop market participation intensity on crop groups was measured with the ratio of the gross value of all crop sales to the gross value of all crop production times hundred.
The hypothesized explanatory variables have been signified in Table 2 for the Tobit regression models and multinomial logit model so as to operate objective two and objective three, respectively; the estimation for those hypothesized explanatory variables was mainly based on Matungul et al. (2002).


Based on empirical indication of Matungul et al. (2002) the model hypothesizes that food crop revenue is explained by marketing participation intensity; as crop producer's market participation increases, their income increases and as their income increases the tendency to secure their household food security increases. But for doing so smoothly, there are estimated signs shown in the hypothesized explanatory variables in Table 2, which show the negative and positive aspect factors of estimated variables for the household crop market participation intensity of smallholder crop producer farmers and the negative and positive aspect effect for their household food security improvements.
As mentioned earlier, the main objective of this study is to analyze the effects of crop market participation among smallholder crop producer farmers in improving their food security at the household level. The study is mainly based on primary data that has been collected from 160 respondents of Ada’a Woreda. The required data was collected by following a standard sampling technique from the crop producer smallholder farmers in the study area. Random sampling technique for the household respondents has been applied to select the sampled households. So the study has analyzed and discussed by applying the aforementioned Tobit and multinomial logit econometric models for objectives two and three, respectively and descriptive statistics of simple quantitative summary of data set has been employed and operated for the description purpose of specific objective one.
Diagnostic test
Richard defined heteroskedasticity by considering Wikipedia's meaning which stated that, if the error terms do not have constant variance, they are said to be heteroskedastic [Tidbit from Wikipedia: The term means “differing variance” and comes from the Greek “hetero” ('different') and “skedasis” ('dispersion') (Richard, 2015)]. To check whether the error terms have constant variance, hettest (hetroskesdacity test) is employed.
Before the start of complete analysis, an assortment of diagnostic tests was conducted to make the data ready for regression and also after regression, model fitness was checked. So, VIF (variance inflation factor test), pwcorr (pair wise correlation), hettest (hetroskesdacity test) have been implemented before running Tobit econometric regression model for the second objective. pwcorr (pair wise correlation) and ovtest (omitted variable test) have been applied for the multinomial logit model for the third objective. After running Tobit regressions for the second objective, linktest (link test for model specification) and margins (marginal means, predictive margins, marginal effects, and average marginal effects) tests were seen. While after running multinomial logit regression, margins (marginal means, predictive margins, marginal effects, and average marginal effects) tests have been seen. Further for Tobit econometric model, Prob > Chi2=0.000 has been considered to check the model goodness of fit (Table 5). Moreover, for multinomial logit econometric model, the likelihood ratio Chi2of 132.34 which can be calculated by -2 × (L(null model) – L(fitted model)) = -2 × ((-163.34) – (-97.17)) = 132.34 with a p-value < 0.0001 tells us that our multinomial model as a whole fits significantly better than any empty model.
RESULTS AND DISCUSSION
Descriptive statistics
To assess household crop market situation of crop producer farmers in Ada’a Woreda, to identify factors affecting crop market participation intensity and to analyze the effects of crop market participation on household food security, sample of 160 households were taken from 4 selected rural kebeles of Yatu, Gice, Gobesaye and Denkaka which are found under Ada’a Woreda, Central Ethiopia. Thus, all samples of the households are used for analysis.
Situation of household crop market participation in Ada’a Woreda, Central Ethiopia
The household crop market situation in Ada’a Woreda is shown in Table 3; the maximum households' crop market participation intensity is 100 and the minimum is 0, whereas the mean average value of crop market participation intensity is 39.87. For the degree of crop market participation challenges, the high, low and medium degree of crop market challenges mean value was found around 36, 23 and 21%, respectively, only the remaining 20% was none degree of crop market challenges. In Table 2, the degree of crop market challenges categorized under the variable high is: no market place, no financial institution/s, no/low infrastructure, etc.

Situation of household food security in Ada’a Woreda, Central Ethiopia
The household food security situation in Ada’a Woreda is shown in Table 4; from the total 160 sampled households, 50% of household food security situation is the most frequently occurring household food insecure/ unimproved situation, 31% of those respondents were moderately food secured situation and the remaining 19% of the respondents household were food secured. This result shows that food insecure/unimproved situation is the most frequently occurring household food security situation in Ada'a Woreda and can be the reference group in this description and for the regression outcomes.

Factors affecting crop market participation intensity
In the descriptive statistics, factors affecting crop market participation intensity in the woreda has also been described by using simple summary of descriptive statistics method. Moreover, to identify statistical significant factors that have been affecting crop market participation intensity of a household, Tobit econometric regression model has been employed and operated here. The aforementioned literature of Tobin (1958) and Fernando (2011), in general can be stated as the Tobit model is also mostly called a censored regression model; even though the model is nonlinear model and similar to the probit model, it is designed to estimate linear relationships between variables when there is either left- or right-censoring in the dependent variable (also known as censoring from below and above, respectively). Based on these authors claim, censoring from above takes place when cases with a value at or above some threshold, all take on the value of that threshold, so that the true value might be equal to the threshold, but it might also be higher. In the case of censoring from below, values of those that fall at or below some threshold are censored. Therefore, a Tobit model can be used to predict an outcome that is censored from above, from below, or both, Tobit regression will generate a model that will predict the outcome variable to be within the specified range.
In this study, a censored variable is household crop market participation of Ada’a Woreda's smallholder crop producer farmers. For this purpose, Tobit regression is applied to generate a Tobit model which predicts the household food security outcome to be within the set of specified range of explanatory variables. These set of hypothesized explanatory transaction cost related variables which were included and analyzed in the Tobit model are shown in Table 2. Among those set of hypothesized explanatory transaction cost related variables, household crop market participation intensity on crop groups of roots/tubers, cereals and beans/ groundnuts (mp), degree of crop market challenges (dcmc) which were facing crop market participation intensity, extension service for the household head per year(exten), producing groups of crops for a household (pgc), accessibility of electricity (eletric) and market information (mi), availability of asset (asset) and arable land (land) and household total amount of total crop group production of household (tcgp), were the specified range of explanatory variables in this Tobit regression model. Moreover, those explanatory transactional costs related variables were taken into the responds of household interview, key informant interview and focus group discussions to identify factors of household crop market participation intensity.
As shown in Table 5, the Tobit regression estimation result has been identified as there were variables that have explanatory power on crop market participation intensity of smallholder crop producer households in Ada’a Woreda at 1, 5 and 10% level of significance.

Since a Tobit model can be used to predict an outcome that is censored from above, from below, or both, for this study, the household market participation has been listed (outcome variable) followed by the factor predictors of extension service for the household per year (exten), market information (mi), amount of total crop group production of household (tcgp), accessibility of household electricity and asset, arable land of household, crop producing groups of household (pgc) degree of crop market challenges(dcmc) and then, upper limit of the outcome variable which is done to generate a Tobit model in stata has been specified. Lastly, the output is signified as follows in Table 5.
The log likelihood result of the Tobit model from Table 5 indicated as the model is the fitted model. This is used in the likelihood ratio Chi2 test of whether all factor predictors’ regression coefficients in the model are simultaneously zero. The likelihood ratio (LR) chi-square test that is at least one of the factor predictors’ regression coefficients is not equal to zero. The number in the parentheses indicates the degrees of freedom of the Chi2 distribution used to test the LR Chi2 statistic and is defined by the number of predictors in the Tobit model. From Table 5, Prob > Chi2 is the probability of getting a LR test statistic as extreme as, or more so, than the observed statistic under the null hypothesis. The null hypothesis is also explained in the above, that is, all of the regression coefficients are simultaneously equal to zero. In other words, this is the probability of obtaining this Chi2 statistic (108.04) or one more extreme if there is in fact no effect of the predictor variables. This p-value is compared to a specified alpha level, our willingness to accept a type I error, which is typically set at 0.05, 0.01 or 0.1. The small p-value from the LR test, <0.0001, would lead us to conclude that at least one of the regression coefficients in the model is not equal to zero. The parameter of the Chi2 distribution used to test the null hypothesis is defined by the degrees of freedom as explained in the prior line. The regression coefficients displayed in Table 5 with the abbreviation "coef." is to mean coefficient. Tobit regression coefficients are interpreted in similar manner to ordinary least squares (OLS) regression coefficients; however, the linear factor is on the uncensored latent variable, not the observed outcome. The expected household food security score changes by coefficient for each unit, if the coefficient is negative decrease in the corresponding predictor and if the coefficient becomes positive increase in the corresponding predictor. So from Table 5, effect predictor factor coefficients of household arable land, high degree of crop market challenges, low degree of crop market challenges and medium degree of crop market challenges for Ada'a Woreda smallholder household crop market participation intensity have denoted negative coefficient factors which implies the expected household crop market participation intensity score change decreases by coefficient for each unit, on these effect predictor factors. Whereas on effect predictor factor coefficient of none degree of crop market challenge and extension service for the household per year have denoted positive coefficient that implies the expected household crop market participation intensity score change increases by coefficient for each unit, on these effect predictor factors. This is clearly shown in Table 5.
From Table 5, "Obs. summary" means observation summary that indicates how many of the observations in the dataset are censored. Here, we see that zero or none of the observation in the data set is left censored and 8 of the observation in the data set are right censored at household market participation intensity (mp) greater than or equal to 83. Moreover, from Table 5, "Number of obs." means number of observations that is the number of observations in the dataset, all of the response and predictor variables are non-missing, that is, all of the 160 responses and predictor variables were none missed. Therefore, based on the explanation and as shown in Table 5, the effect predictor factors of arable land, high degree of crop market challenge and low degree of crop market challenges were found significant at 1% level and
the other medium degree of crop market challenge effect predictor factor was found significant at 10% level while extension service for the household per year was found significant at 5% level. In addition to these, Table 5 shows the effect predictor factors on the household crop market participation intensity that have been included on the categorical variables but not displayed on the Tobit regression output. These effect predictor factors were roots/tubers producing groups of crops from producing groups of crop categorical variable and none degree of crop market challenge from degree of crop market challenges categorical variable. So these variables are considered as their coefficients and standard error values are the constant value of the Tobit model and since the constant value of the model from Table 5 denoted significant at 1% level, thus the effect predictor factor of root/tuber producing groups of crops and the effect predictor factor of none degree of crop market challenge were also significant at 1% level.
Further, the Tobit regression result revealed as there were effect predictor factors of market information, total amount of crop group production for household, electric accessibility, availability of asset, producing groups of cereal crops and producing groups of bean/groundnut crops were insignificant which showed their insignificancy on outcome variable of household crop market participation intensity (Table 5 ).
In general, from Table 5, it can be generalize that based on the effect predictor factors significance level and based on the case of censoring at the threshold points of the absolute t value on the output of household crop market participation intensity dependent variable, the independent variable high degree of crop market challenge was found to be the highest negatively affecting factor on the household crop market participation intensity at 1% significance level among all included effect predictor factors at the t absolute value 6.86, while arable land, low and medium degree of crop market challenges were found to be the next negatively affecting factors for household crop market participation intensity in Ada’a Woreda smallholder crop producer farmers. Whereas none degree of crop market challenge was found to be the highest positively affecting factor for household crop market participation intensity at 1% significant level. Moreover, extension service was also found to be the positive factor for household crop market participation intensity in Ada’a Woreda's smallholder crop producer farmers (Table 5).
Degree of crop market challenges (dcmc): This variable is categorical variable and the Tobit model regression result shows the same as the hypothesized estimation result in Table 2. High and low degree of crop market challenges were significant at 1% significant level and medium level of crop market challenge was significant at 10% significant level, all of these have been included on this degree of crop market challenges (dcmc) independent categorical variable. Table 2 shows that under high degree of crop market challenges, no market place, no financial institution/s, no or low volume of infrastructure challenge for household crop market participation intensity were the factors and no financial institutions was the factor for low degree of crop market challenges while no crop market place and no financial institutions/s were the factors under medium level of crop market challenges. Among them, high degree of crop market challenge was found to be the highest negatively affecting factor for household crop market participation intensity at 1% significant level and censoring from the above at 6.86 absolute t values in Ada’a Woreda's smallholder crop producer farmers. Therefore, this Tobit model regression estimation result in Table 5, verified the results described on descriptive statistics using simple summary statistics.
Arable land size: The size of arable land was hypothesized as it would have positive influence on the crop market participation intensity of smallholder households. As hypothesized, a larger area of arable land helps to reduce transaction costs per unit of output and would positively be related to smallholder crop market participation intensity but in Table 5, the Tobit regression result showed negative sign but statistically significant at 1% level. From the result, we understand that, household crop market participation intensity was negatively affected by the low size of arable land for Ada’a Woreda's crop producer smallholder household farmers which were found not to be larger as hypothesized and negatively affecting factor for the household market participation intensity.
Extension service for the household per year: This is an independent variable that denotes the provision of extension services for a household in a year within Ada’a Woreda smallholder crop producer farmers. The Tobit regression result in Table 5 is as similar as the hypothesized estimation result in Table 2. As hypothesized, the regression result is found statistically significant at 5% level for household crop market participation intensity of smallholder crop producer farmers in the woreda and as the hypothesized estimation result, the coefficient of the Tobit regression result indicated positive factor with household crop market participation intensity of smallholder crop producer farmers. But the significance level and when censoring from the above, the absolute t value which is 1.94 indicated at the lowest level. This lowest level Tobit regression result fits with the information found on the key informant interview and focus group discussions collected data. Those collected data showed that almost all of extension service deliverer's main duty is on crop productivity. The qualitative information gathered on both key informant interview and focus group discussions implied that, the extension deliverer's service provision is mainly based on crop productivity without incorporating market linking issue. The lowest level effect implies the extension service in the Woreda triggered to decrease the likelihood of household crop market participation intensity on producing groups of crops with time. Therefore, it is highly advisable to give attention for the provision of extension services in the intent of triggering crop market participation (sale of output) intensity parallel with crop productivity issues which calls high attention for the focus of delivering extension services on crop market linking issues in Ada’a Woreda. The marginal effect predicted probability after Tobit regression, by setting predictor factors to the specific value is shown in Table 5. As the aforementioned concept, in Tobit regression the outcome (dependent) variable is household crop market participation intensity. In this case, the variable household crop market participation intensity marginal effect after Tobit regression in Table 5 is indicated as factor variables are at their mean value.
The effects of crop market participation on household food security
In the descriptive statistics, in addition to describing the assessment of crop market situation of crop producer farmers with the association of food security in Ada’a Woreda, the effects of household crop market participation intensity on household food security in the Woreda has been also described by using descriptive statistics method with the application of simple statistical summary of descriptive statistics. Further to analyze statistical significant effects which have been influencing household food security of Ada’a Woreda's smallholder crop producer farmers, multinomial regression model was employed and operated in this section.
Based on the aforementioned literatures, when categories are unordered, multinomial logistic regression is one often-used strategy. Mlogit models are a straightforward extension of logistic models. Moreover, according to Williams (2017), this study supposed that household food security has M or three categories. Among these categories, one value (typically the first, the last, or the value with the highest frequency) of among the household food security level is designated as the reference category. For household food security with M (three) categories, this requires the calculation of M-1 equations, one for each category relative to the reference category, to describe the relationship between the household food security levels and the reference groups.
In this study, a response variable is household food security of Ada’a Woreda's smallholder crop producer farmers. For this purpose, multinomial regression is applied to generate a multinomial model. Multinomial model predicts the household food security outcome within the set of specified range of explanatory variables. These set of hypothesized explanatory transaction cost related variables which were included and analyzed in the multinomial model are summarized in the results and discussion (Table 2). Among those set of hypothesized explanatory transaction cost related variables, household crop market participation intensity (mp), degree of crop marketing challenges (dcmc), extension service for the household head per year (exten), producing groups of crops (pgc), access of household market information (mi), amount of total crop group production of household (tcgp), access of electric (electric), access of asset (asset) and availability of arable land (land) were the specified range of explanatory variables in this multinomial regression model.
Moreover, those explanatory transactional costs related variables were taken into the responds of household interview, key informant interview and focus group discussions to analyze the effects of household crop market participation on the dependent variable of improvement of household food security.
As shown in Table 6, the multinomial regression estimation result analyzed that there were variables that have explanatory power effects on the household food security improvements of crop producer farmers in Ada’a Woreda at 1, 5 and 10% level of significance.
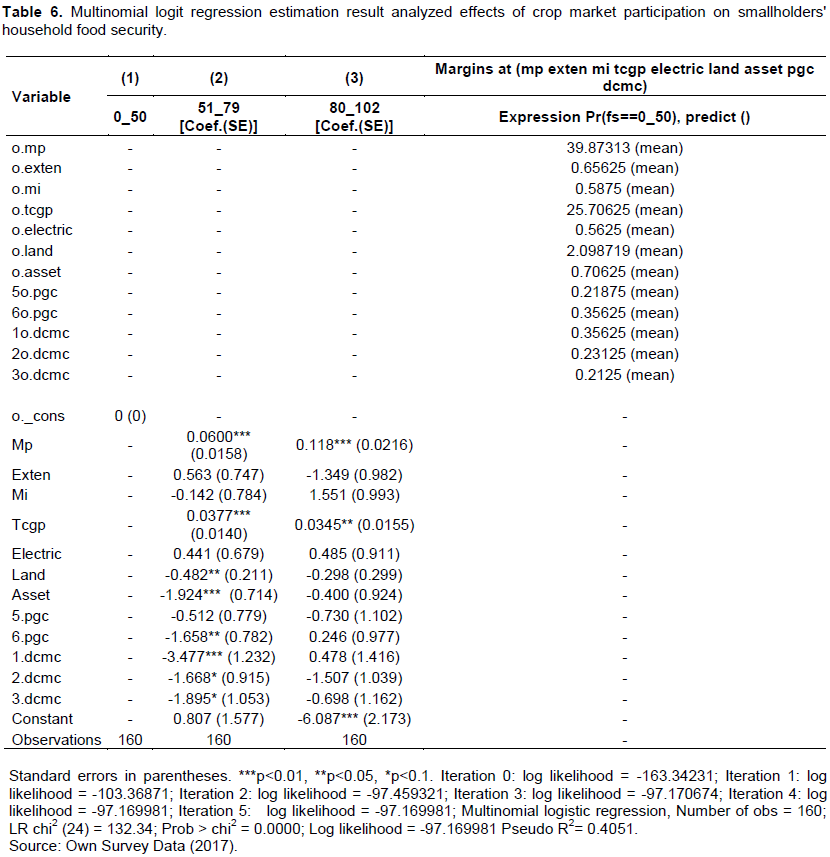
Table 6 and Appendix E show the multinomial model regression estimation result as the following. The outcome status of the three unordered categories under multinomial logit model are coded as weighted sum 0_50=Food insecure, weighted sum 51_79= moderately food secured and weighted sum 80_102 =Food secured. The predictors are: household market participation intensity (mp), household extension service per year (exten), access of household market information (mi), amount of total crop group production of household (tcgp), access of electric service for household (electric), access of asset for household (asset), type of producing groups of crops (pgc) and degree of crop market challenges (dcmc).
Iteration log is a listing of the log likelihoods at each iteration point. Remember that multinomial logistic regression, like binary and ordered logistic regression, uses maximum likelihood estimation, which is an iterative procedure. The first iteration (called iteration 0) is the log likelihood of the "null" or "empty" model, that is, a model with no predictors. At the next iteration, the predictor(s) are included in the model. At each iteration point, the log likelihood increases because the goal is to maximize the log likelihood. When the difference between successive iterations is very small, the model is said to have "converged", the iterating stops, and the results are shown in Table 6. In the output, we first see the iteration log, indicating how quickly the model converged. The log likelihood (-97.169981) can be used in comparisons of nested models, but this study did not show an example of comparing models here. The likelihood ratio Chi2 of 132.34 with a p-value < 0.0001 tells us that this model as a whole fits significantly better than an empty model (that is, a model with no predictors). LR Chi2 (24) is the Likelihood Ratio (LR) Chi2. The number in the parentheses indicates the degrees of freedom of the Chi2 distribution used to test the LR Chi2 statistic and is defined by the number of models estimated (2) times the number of predictors in the model. The LR Chi-Square statistic can be calculated by -2*(L(null model) – L(fitted model)) = -2×((-163.34) – (-97.17)) = 132.34, where L(null model) is from the log likelihood with just the response variable in the model (Iteration 0) and L(fitted model) is the log likelihood from the final iteration (assuming the model converged) with all the parameters.
From Table 6 (Household food securities==Food insecure (0_50) is the base outcome), household food security is the response variable in the multinomial logistic regression. Underneath household food securities are two replicates of the predictor variables, representing the model that is estimated: Moderately food secured (51_79) relative to food insecure (0_50) and food secured (80_102) relative to food insecure (0_50). The Coef. and referent group are the estimated multinomial logistic regression coefficients and the referent level, respectively, for the model. An important feature of the multinomial logit model is that it estimates k-1 models, where k is the number of levels of the outcome variable.
In this instance, stata, by default, set food insecure (0_50) as the referent group, and therefore estimated a model for moderately food secured (51_79) relative to food insecure (0_50) and food secured (80_102) relative to food insecure (0_50). Since the parameter estimates are relative to the referent group, the standard interpretation of the multinomial logit is that for a unit change in the predictor variable, the logit of outcome m relative to the referent group is expected to change by its respective parameter estimate (which is in log-odds units) given the variables in the model are held constant.
Based on multinomial logit regression, the result in Table 6 revealed that, household market participation intensity (mp) was found significant at 1% level on both moderately food secured (51_79) and food secured (80_102) household food security levels relative to food insecure (0_50). Whereas the amount of total crop group production of household (tcgp), access of asset (asset), and high degree of crop market challenges (1.dcmc) were found significant at 1% level on moderately food secured (51_79) household food security level relative to food insecure (0_50). Moreover, arable land (land) and beans/groundnuts producing groups of crops were found significant at 10% level on moderately food secured (51_79) household food security level relative to food insecure (0_50). While amount of total crop group production of household (tcgp) was found significant at 10% sig. level on food secured (80_102) household food security levels relative to food insecure (0_50).In addition, low and medium degree of crop market challenges were found significant at 5% level on moderately food secured (51_79) household food security level relative to food insecure (0_50). On the other hand, the multinomial regression result revealed that, cereal producing groups of crops (5.pgc), extension services for the household per year (exten), access of market information (mi) and electric services(electric) were found insignificant on both moderately food secured (51_79) and food secured (80_102) household food security levels relative to food insecure (0_50).
Household crop market participation intensity (mp): Market participation is the participation of smallholder households in crop marketing. As clearly verified in Table 6, the multinomial model regression result signified that household market participation has as same as the hypothesized estimation result in Table 2. It is displayed as it has a direct positive effect and statistically significant on food security at 1% level which is the highest significant level. Moreover, in Table 6 within food security levels, household crop market participation intensity signified as it has essential effects on household food security to move out from food insecure status into moderately food insecure and further to food secured status since it is the highest z absolute value (Table 6). Therefore, the household crop market participation intensity statistically signified its direct essential positive effects for the household food security improvements of smallholder farmers in Ada’a Wereda.
Degree of crop market challenges: This variable is a categorical variable, high, low and medium degree of crop market challenges are included in this categorical variable which is displayed in Table 6, high degree of crop market challenge was significant at 1% level, while low and medium degree of crop market challenges were significant at 5% level.
Producing groups of crops (pgc): This variable is the effect predictor categorical independent variable for the household food security improvement in Ada’a Woreda, the producing groups of crops are roots/tubers, cereals and beans/groundnuts which are the three category of producing groups of crops that were included in this effect predictor variable. The multinomial regression model estimation result signified in Table 6 was the same with the hypothesized estimation result in Table 2; the hypothesized estimation result denoted that household production ratios is in different groups of crop categories on each of their household farm can market a greater share of their output and therefore face lower/none level of food insecurity challenges; then the change in coefficient predictor effect of these producing groups of crops on the household food security increases. But even though this transaction costs related effect predictor categorical independent variable regression result was significant on 5% level in beans/groundnuts producing groups of crops and this effect predictor categorical variable in Table 6 denoted negative relationships with household food security which were not fitted with the hypothesized estimation result in its sign. The hypothesized point of view was on the suggestion that production ratios with enhanced market orientation on each of specific crop categories would cause to increase the likelihood of household crop market participation intensity on these producing groups of crops with time; this in turn improves the household food security. But in Table 6, multinomial regression result of producing groups of crops has signified negative effect predictor on household food security improvement which clearly indicates as better endeavor is still required for Ada’a Woreda's household food security enhancement, the endeavor needed specifically on household crop market participation intensity on this producing groups of crops should be in the intent of supporting for the establishment of reliable and accessible marketing system; because the result verifies as the Woreda's smallholder crop producer farmers crop production is for the purpose of their household consumption not for market participation, this exposes them for unimproved food security and to lead vicious cycle life style.
Land (Land): The size of arable land was hypothesized as it would have positive influence on the household food security improvement of smallholder households. As hypothesized, a larger area of arable land helps to reduce transaction costs per unit of output and would positively related to smallholder household food security improvement but in Table 6, the multinomial logit regression result showed the reverse but statistically significant at 10% level with household food security improvement, which indicates that the size of arable land for smallholders of Ada’a Woreda's households was not larger as hypothesized.
From Table 6, the study use the margins command to calculate the predicted probability of choosing each food security type at each level of household food security holding all other variables in the model at their means. Moreover, the baseline or reference outcome, in this case 0_50 (food in secured), which indicated that the coefficient is zero for this baseline outcome.
Econometric estimation
Model specification diagnostic tests of overall model fit, VIF (variance inflation factors test), hettest (hetroskesdacity) and pwcorr (pair wise correlation) has been checked before applying Tobit regression model to estimate the potential effect of each explanatory variables on the dependent variables of the model. The results of these tests have shown that no problems of sever multi-collinearity, model specification bias and hetroskesdacity. For Tobit regression model, probability of Chi2=0.000 has been considered to check the model goodness of fit (Table 5).
Diagnostic test result
Richard William's defined heteroskedasticity by considering Wikipedia's meaning stated that, if the error terms do not have constant variance, they are said to be heteroskedastic [Tidbit from Wikipedia: The term means “differing variance” and comes from the Greek “hetero” ('different') and “skedasis” ('dispersion') (Williams, 2015)]. From this, so as to check whether the error terms have constant variance, hettest (hetroskesdacity test) is employed.
As it is known that, Variance Inflation Factor (VIF) and tolerance level (1/VIF) are two important measures of multicollinearity, this test was conducted for Tobit regression model for the second objective. Therefore, VIF (variance inflation factor test), pwcorr (pair wise correlation), hettest (hetroskesdacity test) have been employed before running Tobit regression for the second objective. Whereas pwcorr (pair wise correlation) and ovtest (omitted variable test) tests was applied before running multinomial logit regression to the third objective. After running Tobit regression for the second objective linktest (link test for model specification) and margins (marginal means, predictive margins, marginal effects, and average marginal effects) tests were employed. After running multinomial logit regression, margins (marginal means, predictive margins, marginal effects, and average marginal effects) test were employed. Moreover, for Tobit regression model probability of prob. > Chi2=0.000 was considered to check the model goodness of fit (Table 5). For multinomial logit econometric model regression, the likelihood ratio Chi2of 132.34 which can be calculated from table 6 by -2×(L (null model) – L (fitted model)) = -2°((-163.34) – (-97.17)) = 132.34 with a p-value < 0.0001 which tells us that this multinomial model as a whole fits significantly better than any empty model for this study. From these, both models are signified as statistically significant. Therefore, the indicated regression models on the displayed results of Tables 5 and 6 which were used for the second and third objectives, respectively were fitted well. Variance Inflation Factor (VIF) and tolerance level (1/VIF) are two important measures of multicollinearity problem (Wooldridge, 2009). In addition, the author claimed that, by rule of thumb, VIF value of 10 or tolerance indexes of 0.10 are used as a critical point to indicate serious multicollinearity problem. The minimum, maximum and mean value of VIF values for the second objective was found 1.41, 3.97 and 2.10 respectively. Therefore, there were no severe multicollinearity problems in the second objective. To test the correlation between variables included in the model pair-wise correlation test was run. As general rule, multicollinearity is a problem when the correlation result is above 0.80 and below -0.80 (Stock and Watson, 2007). The coefficients of all variables were found above -0.2824 and below 0.2738 and between -0.2802 and 0.3775 in the second and third objectives.
The marginal effect results after Tobit model regression result in Table 5 and Appendix F denoted that the variables were at their mean values called marginal means and the marginal effect results after multinomial logit regression result in Table 6 which indicated that the effect predictor independent variables were at their mean values which is also called marginal means.
Williams (2014) claimed that, the variable _hat should be a statistically significant predictor, since it is the predicted value from the model. So based on Richard Williams concept if the model is properly specified, the linear predicted value squared variable (_hatsq) should have much predictive power except by chance and the linear predicted value variable (_hat) should be a statistically significant predictor, since it is the predicted value from the model. Therefore, the link test results denoted that the Tobit regression model applied for the second objective was the fit model, because the result implied that the variable _hats was found significant with p-value of 0.001 on this Tobit model. Whereas the variable hatsq is insignificant in this model with p-value of 0.136 for the Tobit econometric regression model.

CONCLUSIONS
This study explores the effects of crop market participation in improving food security among smallholder crop producer farmers: in the case of Ada’a Woreda, central Ethiopia and tried to sort out the most influencing factors on household crop market participation intensity on producing crop groups of smallholder crop producer farmers, the effects of smallholders market participation intensity on their food security at the household level and crop market participation situation in the Woreda. To assess crop market situation of crop producer farmers in Ada’a Woreda, simple statistical summary of descriptive statistics was employed and operated. Moreover, to identify factors that affect smallholder's market participation intensity on crop groups and to analyze the effects of crop market participation intensity on household food security improvement, Tobit and multinomial logit econometric regression models were employed, respectively. For this purpose, the study had applied mainly primary data that was collected from 160 household crop producer smallholder farmers of the four kebeles; these kebeles were Yatu, Gice, Gobesaye and Denkaka found under Ada’a Woreda, Central Ethiopia.
The findings of this study on the specific objective one by using simple statistical summary of descriptive statistics revealed that in the household crop market participation situation, the maximum households' crop market participation intensity was found to be 100 and the minimum was 0. Whereas the mean average value of crop market participation intensity was found 39.87. While, the high, low and medium degree/level of household crop market participation challenges mean value were found around 36, 23 and 21%, respectively, only the remaining 20% household crop market participants of smallholder farmers was none or zero degree/level of crop market challenges in Ada'a Woreda from the 160 sampled household respondents. Whereas in the food security situation of the woreda, among the household food security categories, the food insecure (0-50 weighted sum) category/level showed the most frequently occurring household food security situation in Ada'a Woreda and became the reference group for both the description and the regression outcomes. From the 160 sampled household respondents of smallholder crop producer farmers, around 50% were found food insecure (0-50 weighted sum), 31% were found moderately food secured (51-79 weighted sum) and only the reaming 19% were found food secured (80-102 weighted sum) households.
The findings of this study on the specific objective two via Tobit model indicated that there were factors which were affecting household crop market participation intensity of smallholders at different levels. Therefore, high and low degree of crop market challenges and arable land size of the household were identified significant at 1% level and negatively affecting factors. While medium degree of crop market challenges was identified significant at 10% level and negatively affecting factor for household crop market participation intensity. Whereas none degree of crop market challenges were found significant at 1% level and extension services per year for household were found significant at 5% level and both were identified as positively affecting factors.
The findings of this study on the specific objective three via multinomial logit regression result revealed that, household crop market participation intensity (mp) was found significant at 1% level and showed positive effect on both moderately food secured (51_79) and food secured (80_102) household food security levels relative to food insecure (0_50). Whereas amount of total crop group production of household (tcgp) showed positive effect, access of asset (asset) showed negative effect, and high degree of crop market challenges (1.dcmc) which showed negative effect were found significant at 1% level on moderately food secured (51_79) household food security category/level relative to food insecure (0_50). Moreover, arable land size (land) and beans/groundnuts producing groups of crops were found significant at 10% level and showed negative effect on moderately food secured (51_79) household food security level relative to food insecure (0_50). While amount of total crop producing group was found significant at 10% level on food secured (80_102) household food security levels relative to food insecure (0_50). In addition, low and medium degree of crop market challenges were found significant at 5% level and indicated negative effects on moderately food secured (51_79) household food security level relative to food insecure (0_50); these were the results found in Ada’a Woreda.
The originality of this study is that it has assessed crop market situation of crop producer farmers and identified factors affecting crop market participation intensity and then in turn it analyzed the effects of crop market participation on the improvements of crop producer smallholder’s household food security in Ada’a Woreda Central Ethiopia, from the perspectives of crop market participation effects on the improvements of household food security; this may create an opportunity for further constructive debate.
RECOMMENDATIONS
For further household food security improvement understanding, statistically significant factors that are affecting household crop market participation in general, specifically giving attention for negatively affecting factor variables and enhancing positively affecting variables on market participation intensity and reducing negatively affecting effect variables on household food security are needed.
Based on the result and conclusion of this study, these actionable suggestions are forwarded:
(1) Interventions of strategic efforts for the establishment of reliable and accessible marketing system through adaptable market linking approach are required in Ada’a Woreda for smallholder crop producer farmers. Because, as the findings of this study have shown, even though the household crop market participation intensity on crop groups is highly significant at 1% level and has positive effect for the household food security improvement but the food insecure situation is the most frequently occurring situation in the woreda. This indicates the household crop market participation intensity in the woreda is low and their crop production is for the purpose of household consumption rather than for market. This situation exposes smallholders for unimproved food security and to lead vicious cycle life style. Therefore, interventions are needed to reduce the founded aforementioned high, low and medium degree of crop market participation facing challenges. The intervention should be in the intent of triggering the household crop market participation intensity augmentation specifically on the establishment of reliable and accessible marketing system through adaptable crop market linking approach.
(2) The conclusion, from the study result identified the main factors for household crop market participation intensity on crop groups and also indicated the analyzed effect predictor independent variables on the outcome (dependent) variable of household food security. For those identified factors and analyzed effects, the following actions both in policy and implementation mechanism needs high attention.
(3) Development of market infrastructure, provision on marketing issue based extension services, preferably market linking focused extension services rather than to continue being dependent merely the present crop productivity extension services and marketing incentive to smallholder crop producers and enhancement of institutionalized crop marketing financial and information services, that is, transaction cost reducing intent institution establishments for smallholders, group marketing system enhancements such as establishing involvement opportunity for the majority crop producer households in crop market associations/cooperatives. For the formation of cooperatives using Equb and Edir Ethiopian cultural social associations is worthwhile, establishing farmer to farmer engagements across the woreda as well as across the country to bring best practices is also essential. In general, high attention is needed for crop marketing issue specifically focusing on adaptable crop market linking systems rather than to be dependent merely on crop productivity is highly advisable. Moreover, it is highly worthwhile to focus in the intent of employing reliable and accessible marketing system for those majority smallholders. These are the recommendations based on the study findings, so as to improve the majority crop producer smallholder farmers' household food security via enhanced market participation and commercializing of their producing groups of crops in Ada’a Woreda Central Ethiopia. The researcher believed that this study result can be applied more or less for the other similar Woredas also.
ACKNOWLEDGEMENTS
The author thanks Dr. Abrham Seyoum, from Addis Ababa University, College of Development Studies, for sharing knowledge in the initial development of this study and Dr. Berhanu Danu, who contributed by giving his prominent and constructive comments as an evaluator of this study proposal. Moreover, The author is grateful to the research symposium coordination committee of the 75th Anniversary Addis Ababa University, School of Commerce; Ada’a Woreda Agricultural Offices Deputy Head, Ato Akelilu Metekiya who allowed this research to be conducted without any bureaucratic obstacles and Ato Aserse Diro who made facilitation, especially for Yatu, Gice and Gubsaye Kebele Development Agents (DA) who highly supported during data collection; Zemenaye Asefa who was this research key informant interviewees; and those who gave their time to this research as enumerators, respondents to surveys and FGDs and to Chala and Elesabet who supported to get the map of the study area.
CONFLICT OF INTERESTS
The author has not declared any conflict of interests.
REFERENCES
|
Achandi LE, Mujawamariya G (2016). Market participation by smallholder rice farmers in Tanzania: A double hurdle analysis. Studies in Agricultural Economics 118:112-115. |
|
|
Agriculture for Impact (2013). Business solutions for African smallholder farmers to address food security and nutrition, views of agriculture for impact for the g8. |
|
|
Alberta Government (2015). Agricultural marketing guide, Government of Alberta, Agriculture and forestry, Alberta. |
|
|
Alderman H (1992). Incomes and food security in Ghana. Washington, DC, May, 1992, CFNPP Publications Department 1400 16th Street NW, Suite 420 Washington, DC 20036 202-822-6500 |
|
|
Barrett C (2007). Smallholder market participation: Concepts and evidence from eastern and southern Africa. Department of Applied Economics and Management, 315 Warren Hall, Cornell University, Ithaca, NY 14853-780, USA. |
|
|
Berhanu G, Moti J (2010). Commercialization of Smallholders: Is Market Participation Enough? International Livestock Research Institute (ILRI), Addis Ababa, Ethiopia. |
|
|
Central Statistical Agency (CSA) (2013). Population Projection of Ethiopia for All Regions At Woreda Level from 2014 – 2017, Federal Democratic Republic of Ethiopia Central Statistical Agency (CSA) August 2013, Addis Ababa |
|
|
Fernando R (2011). Presented at PLCS/RDC Statistics and Data Series at Western, March 23, 2011 P. 2. |
|
|
Godden B (2004). "Sample Size Formulas,". |
|
|
Gujarati D (2003). Basic Econometrics (4th Ed.). New Work, NY: The McGraw−Hill Companies. |
|
|
Hoddinott J (1999). Choosing outcome indicators of household food security. International Food Policy Research Institute (IFPRI) 2033 K Street, N.W. Washington D.C. (20006) U.S.A. March, 1999 |
|
|
Hoddinott J, Yohannes Y (2002). Dietary Diversity as a Household Food Security Indicator. Food and Nutrition Technical Assistance Project FHI 360 1825 Connecticut Avenue, NW Washington, D.C. 20009-5721. |
|
|
International Fertilizer Development Center (IFDC) (2015). Linking Farmers to Markets, IFDC, Nairobi, Kenya. |
|
|
Kirimi L, Gitau R, Olunga M (2013). Household food security and commercialization among smallholder farmers in Kenya. Tegemeo Institute of Agricultural Policy and Development, Egerton University, Nairobi, Kenya. 4th International Conference of the African Association of Agricultural Economists. |
|
|
Leykun D, Jemma H (2014). Econometric analysis of factors affecting market participation of smallholder farming in Central Ethiopia. Adama Science and Technology University, Haramaya University Adama & Dire Dawa, Ethiopia. |
|
|
Maxwell S, Smith M (1991). Part I-Household food security: A conceptual review. |
|
|
Nigatu A, Hoekstra D, Azage T (2012). Smallholder dairy value chain development: The case of Ada'a woreda, Oromia Region, Ethiopia. Nairobi: ILRI. https://cgspace.cgiar.org/handle/10568/25118 |
|
|
North D (1991). Institutions. The Journal of Economic Perspectives 5(1):97-112. |
|
|
Nwigwe C, Oyekal A, Oni O, Okoruwa V (2009). Socioeconomic Factors Affecting Intensity of Market Participation among Smallholder Yam-Based System Farmers in Oyo North Area of Nigeria. Department of Agricultural Economics, University of Ibadan, Ibadan, Nigeria. International Journal of Economic Perspectives 3(2):131-140. |
|
|
Osmani G, Hossain E (2015). Market participation decision of smallholder farmers and its determinants in bangladesh. Economics of Agriculture. |
|
|
Richard W (2015). Heteroskedasticity. University of Notre Dame. |
|
|
Richard W (2017). Multinomial Logit Models -Overview University of Notre Dame. |
|
|
Rios R, Shively E, William A (2009). Farm Productivity and Household Market Participation: Evidence from LSMS Data, August 16-22, 2009. |
|
|
Stock J, Watson M (2007). Introduction to econometrics (2nd ed.). Botson: Pearson Addison Wesley. |
|
|
Tobin J (1958). Estimation of relationships for limited dependent variables. Econometrica 26:24-36. |
|
|
Upali W, Omot N, Patiken D, Ryan J (2014). Market Participation of Smallholder Agricultural Households in Papua New Guinea, Centre for Alleviation of Poverty through Sustainable Agriculture-Economic and social Commission for Asia and the Pacific (CAPSA-ESCAP) Working Paper No. 108, Indonesia. |
|
|
Williamson O (2007).Transaction Cost Economics: An Introduction, University of California, Berkeley, Discussion Paper 2007-3 March 1, 2007. |
|
|
Wooldridge J (2009). Introductory econometrics: A modern approach (4th ed.). South- Western Cengage Learning: Macmillan Publishing Solutions. |
|
Copyright © 2024 Author(s) retain the copyright of this article.
This article is published under the terms of the Creative Commons Attribution License 4.0


