Full Length Research Paper

ABSTRACT
While Malawi’s per capita cereal production may be higher than her per capita cereal consumption, Malawi is a net cereal importer and thus food insecure. The food situation is much worse in Malawi’s prisons because inmates generally eat one meal per day. The general objective of this study was to project prisoner population and food demand for ten years, from 2015 to 2025. Using structured questionnaires in face to face interviews, the study collected data from 1000 prisoners and 30 officers-in-charge from all prisons in the country. The data was analysed using Excel employing demand projection models. Results from the analysis showed that Malawi prison food demand was going to grow by 32% from 5,046 tonnes in 2015 to 6,648 tonnes in 2025, while prisoner population was projected to grow from 12,598 prisoners in 2015 to 16,605 prisoners in 2025. This huge growth in food demand as well as prisoner population would call for drastic strategic management policies.
Key words: Malawi’s prisons, Malawi’s prison population growth, Malawi’s prison food demand projections.
INTRODUCTION
Politically, Malawi is divided into four regions, these being the Northern, the Central, the Eastern and the Southern regions. There are six prisons with a prisoner population of 1,717 in the Northern region. In the Central region, there are eight prisons with a prisoner population of 3,784. The Eastern region has eight prisons with 4,072 prisoners, while the Southern region has 3,025 prisoners in eight prisons. There were 12,598 prisoners in Malawi’s 30 prisons in 2016 when this study was conducted.
The focus of this paper was on projecting the growth in Malawi’s prisoner population and associated food demand for the period 2015 to 2025, based on food items commonly eaten in Malawi’s prisons. Theories relating to food acquirement, utilization and nutrition were outside the scope of this study.
The food situation in Malawi
The Millennium Development Goals (MDGs) through the medium term development strategy, the Malawi Growth and Development Strategy (MGDS), identified nine key priority development goals (Malawi Government, 2010). The first of these development goals is to eradicate extreme poverty and hunger. To achieve this, the Government’s target was to halve, between 1990 and 2015, the proportion of people who suffered from hunger. One of the indicators for monitoring hunger was the proportion of the population living below the minimum level of dietary energy consumption of 2,100 kilocalories per person per day (Ecker and Qaim, 2008).
Malawi is an aggregate net exporter of food. The bulk of the food exports, however, are non-cereals such as tea and sugar and so although the country is a net food exporter, it remains a net importer of cereals and thus food insecure. Maize is the staple food in Malawi (De Graaff, 1985; Kidane et al., 2006; World Bank, 2008; Food and Agriculture Organization (FAO), 2010, 2015).
The food situation in Malawi’s prisons
It is a requirement of the United Nations that every prisoner should be provided, by the administration at the usual hours, with food of nutritional value adequate for health and strength, of wholesome quality and well prepared and served (Medecins Sans Frontieres, 2009). The Malawi Prison Act Cap. 9:02, (1983) provides a dietary schedule for prisoners belonging to various categories of prisons (Malawi Government, 1983). Despite these legally binding dietary guidelines, the practice on the ground is different. The African Commission on Human and Peoples' Rights (2002) observed that Malawian prisoners receive only one meal per day and that meals are not balanced as prisoners eat the same food every day. The report also observed that the meals comprise of maize (nsima) and boiled beans and sometimes pigeon peas or vegetables. Neither meat nor fish was provided but salt was available in all prisons. This is a typical case of food insecurity.
Statement of the problem
Although Malawi is generally food insecure, it is common in Malawi that most people consume three meals per day. What differs is mainly the quality, quantity and variety of the food that they eat. Inmates in Malawi’s prisons, however, generally eat one meal per day (African Commission on Human and Peoples' Rights, 2002; Penal Reform International, 2005). These reports mention food issues as observations made in relation to health and human rights. None of these studies specifically studied Malawi’s prison population growth nor food demand projections for any future period.
Justification of the study
The overall objective of the Food and Nutrition Security Policy is to significantly improve the food and nutrition security of the Malawi population (Malawi Government, 2005) while the specific objective of the Food Security Policy, is to guarantee that all men, women and youth in Malawi have, at all times, physical and economic access to sufficient nutritious food required to lead a healthy and active life (Malawi Government, 2006a, b, c; Malawi Government, 2012). Since prisons accommodate about 0.08% of the Malawi population, it is important that prisons are food secure and that every prisoner has access to not less than the minimum meal requirement. Given the Malawi Government’s commitment to ensuring food security, it was important that this study be carried out so that the growth in prisoner population and future food demand levels in Malawi’s prisons could be ascertained. It was important to study and understand these economic parameters in order to lay the foundation upon which efforts to improve and re-engineer the food situation in Malawi’s prisons could be based. This would enable policy makers and prison management to take appropriate policy and budgetary measures regarding prison subvention, strategic resource allocation, food production or procurement, and food demand and consumption levels to accurately address the problem and ensure prison food preparedness and improve prison food security. Also, since no study has been conducted in this area, it was important to conduct this study so that the existing knowledge gap could be filled.
Objectives of the study
The general objective of this study was to project prisoner population and prison food demand for ten years. The specific objectives were to project prisoner population for the period 2015 to 2025, and to project prisoner food demand for the period 2015 to 2025.
MATERIALS AND METHODS


 is income elasticity, y is annual rate of change in per capita income, and z is the annual trend factor. This model can be applied to aggregate consumption in a given base year, and it is expressed as shown in Equation 4:

The projected prisoner population, Nt was given as Equation 6:

where Nt is prisoner population in year t, N0 is base year prisoner population, and g is growth rate in prisoner population.
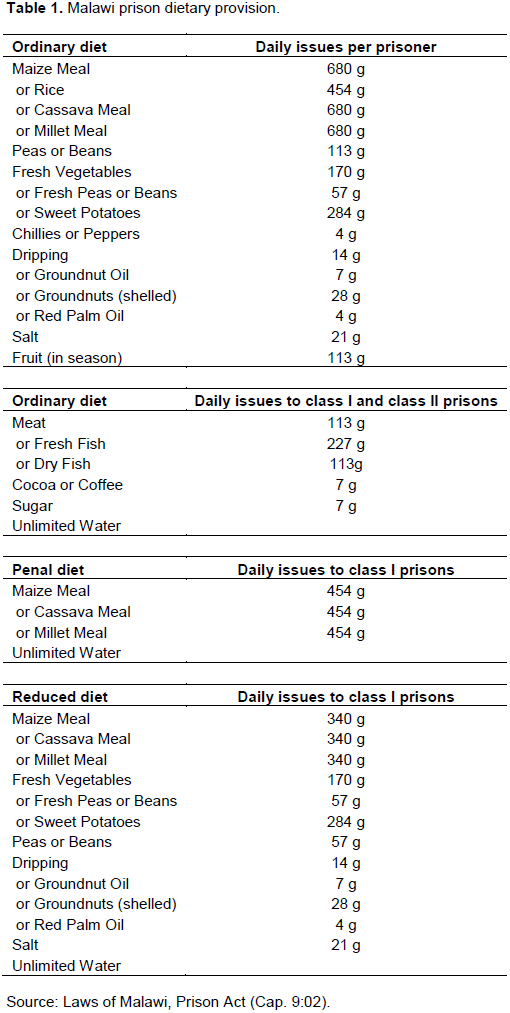
The foods commonly eaten in Malawi prisons were maize (eaten as nsima), beans and salt which were consumed practically every day in all prisons in the country. Other foods, for example, meat and vegetables, were consumed rarely. The rest of the foods provided in Table 1 were either not eaten at all or were eaten only once in a long while and in extremely rare occasions in certain prisons. As such, these foods were excluded from the study. Demand projections of the commonly eaten foods were made based on the quantities legally provided in the Malawi Prison Act (Cap. 9.02) as shown in Table 1.
Quantities provided in Table 1 were used as constants so that projected food quantities should not deviate negatively nor positively from provisions made in the law. This was done despite that the practice on the ground was that food provisions made to prisoners were far below the legally recommended quantities. The base year was 2015. The base year prisoner population, N0, was 12,598. Figures for prisoner population and total food demand were computed using Excel.
RESULTS AND DISCUSSION
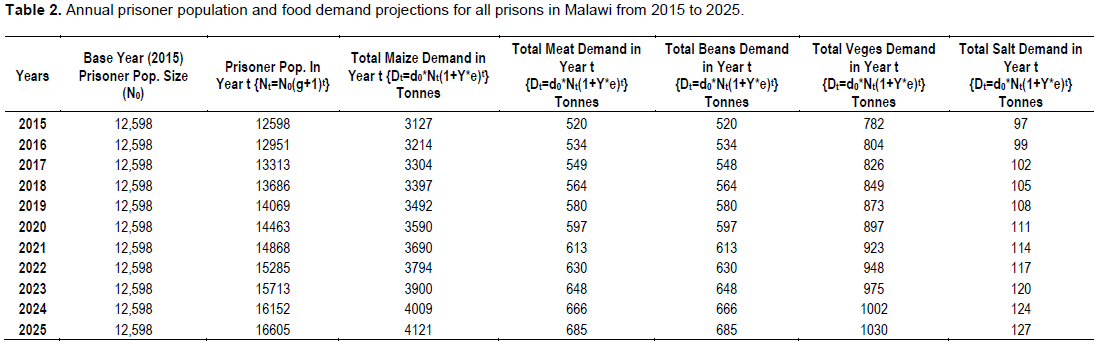
Prisoner population is estimated to grow from 12,598 prisoners in 2015 to 16,605 prisoners in 2025. As a result of this, demand for prison food is also expected to grow. During the same period, annual maize demand is estimated to grow from 3,127 tonnes to 4,121 tonnes; demand for meat and beans will each grow from 520 tonnes to 685 tonnes; vegetable demand from 782 tonnes to 1,030 tonnes and salt demand will grow from 97 tonnes to 127 tonnes. Aggregate food demand is, therefore, estimated to grow by 32% from 5,046 tonnes in 2015 to 6,648 tonnes in 2025. Table 2 shows 10 year demand projections for food items commonly eaten in Malawi’s prisons.
The growth in food demand was big, so big that it would be almost impossible for the prison service to meet it. Although the projected food demand was worked out from recommended food quantities provided for in the Prison Act, the actual quantities given to prisoners were much less. This was an indication that the prisons could not afford the recommended quantities. It was not hard, therefore, to see that if the prisons could not afford 5,046 tonnes in 2015, they would possibly not afford 6,648 tonnes in 2025. The failure to purchase the required quantity of food would be because prisons run on government subvention, just like all other government departments, and subvention to departments as a percentage of GDP has been declining over the years (Ministry of Finance, Economic Planning and Development, 2014). Government subvention to Malawi prisons, for example, dropped by 37.2% between 2009 and 2014 and this resulted into a precarious food and health situation in the prisons (Jali, 2016). A possible government policy intervention could be to make it a requirement that every prison in the country owns and operates a farm where, using prisoner labour, crops and animals are produced as food for the prisoners. Normally, own-produced food is cheaper than procured food.
In 2015, with 12,598 prisoners, prisons in Malawi were over-crowded. In 2025, there is likely to be 16,605 prisoners in the prisons. A deliberate policy to build more prisons could arrest the situation. The Malawi Prison Service (MPS), however, does not seem to have plans to build more prisons. In the absence of additional prisons, this growth in prisoner numbers will put serious pressure on the existing facilities.
The problems discussed above could possibly also be reduced or put under control if government allowed entrepreneurs to own and operate private prisons alongside government prisons. A private prison or for-profit prison is a place in which individuals are physically confined or incarcerated by a third party that is contracted by a government agency (Goyer, 2001). Private prison companies typically enter into contractual agreements with governments that commit prisoners and then pay a monthly rate, either for each prisoner in the facility, or for each place available, whether occupied or not (Le Vay, 2015). Some countries that have a private prison policy are the United Kingdom, Australia, Canada, The United States of America, Brazil, Chile, Greece, Jamaica, Japan, Mexico, New Zealand, Peru, South Africa and Thailand (Biron, 2013). Because of funding problems, private prison operation in Malawi would have to be negotiated and funded differently from the way it is done elsewhere. The objective of this study was to project prison food demand for ten years from 2015 to 2025. The research hypothesis was that demand for food in Malawi Prisons was going to increase annually in the ten years. Based on the study findings as presented in this paper, this hypothesis was accepted.
CONCLUSION
The findings of the study showed that prisoner population was to grow from 12,598 prisoners in 2015 to 16,605 prisoners in 2025. During the same period, aggregate food demand was to increase by 32% from 5,046 tonnes to 6,648 tonnes. This huge growth in food demand would call for drastic strategic management policies. Possible interventions would include prisons producing their own food from prison farms, government building more prisons to ease congestion, and allowing entrepreneurs to build and operate private prisons as the case is in some countries.
CONFLICT OF INTERESTS
The authors have not declared any conflict of interests.
REFERENCES
|
African Commission on Human and Peoples' Rights (2002). Prisons in Malawi-Report on a Visit 7 to 28 June 2001 by Dr. V.M. Chirwa Special Rapporteur on Prisons and Conditions of Detention in Africa. Paris, France. |
|
|
Biron CL (2013). More Countries Turn to Faltering U.S. Prison Privatisation Model. IPS News. http://www.ipsnews.net |
|
|
Bryars D (1983). Advanced Level Statistics. Slough: University Tutorial Press. |
|
|
De Graaff J (1985). Introduction to the economics of maize. (Unpublished manuscript). |
|
|
Ecker O, Qaim M (2008). Income and price elasticities of food demand and nutrient consumption in Malawi. |
|
|
Food and Agriculture Organization (FAO) (2015). Food Balance Sheets 2015. View. |
|
|
Food and Agriculture Organization (FAO) (2010). Food Security Information for Decision Making. View. |
|
|
Goyer KC (2001). Prison Privatisation in South Africa: Issues, Challenges and Opportunities. Institute for Security Studies. |
|
|
Jali K (2016). Crisis in prisons. The Daily Times, April 04, P 1. |
|
|
Kidane W, Maetz M, Dardel P (2006). Food security and agricultural development in Sub-Saharan Africa; building a case for more public support. Rome: FAO. |
|
|
Kothari C (2004). Research Methodology: methods and techniques, 2nd edition. New Delhi, New Age International. |
|
|
Kumar P, Joshi P, Birthal P (2009). Demand projections for food grains in India. Agric. Econ. Res. Rev. 22:237-243. |
|
|
Le Vay J (2015). Competition for Prisons: public or private? Wikipedia, https://en.wikipedia.org/wiki/Private_prison. |
|
|
Magnani R (1997). Sampling Guide. IMPACT Monitoring Project. Va: Arlington. |
|
|
Malawi Government (1983). Laws of Malawi, The Prison Act (Cap. 9:02). Zomba, Malawi Government. |
|
|
Malawi Government (2005). Food and Nutrition Security Policy. |
|
|
Malawi Government (2006a). Food Security Policy. Lilongwe, Ministry of Agriculture and Food Security. |
|
|
Malawi Government (2006b). Agricultural and livestock development strategy and action plan. Lilongwe, Ministry of Agriculture and Food Security. |
|
|
Malawi Government (2006c). Malawi Growth and Development Strategy-from poverty to prosperity 2006-2011. |
|
|
Malawi Government (2010). Malawi Millenium Development Goals Report. |
|
|
Malawi Government (2012). Integrated househols survey 2010 - 2011: Household socio-economic characteristics report. Zomba, National Statistical Office. |
|
|
Maxwel S, Frankenberger T (1992). Household Food Security: concepts, indicators and measurements; a tecchnical review. New York, UNICEF and IFAD. |
|
|
McGill F, McLennan S, Migliorini J (2000). Complete Advanced Level Mathematics – Statistics . Cheltenham, Stanley Thornes. |
|
|
Medecins Sans Frontieres (2009). No food or medicine here until you die. View. |
|
|
Ministry of Finance, Economic Planning and Development (2014). Annual Economic Report. Lilongwe, Malawi Government. |
|
|
Mittal S (2006). Structural shift in demand for food: Projections for 2020. New Delhi, India, Indian Council for Researchon International Economic Relations. |
|
|
Mittal S (2012). Food demand and supply trends and projections in India. New Delhi, India. |
|
|
Penal Reform International (2005). A model for good prison farm management in Africa. Penal Reform in Africa 2000. |
|
|
Swindale A, Bilinsky P (2006). Development of a universally applicable household food insecurity measurement tool: Process, current status and outstanding issues . J. Nut. 136:1449s-1452s. |
|
|
United NationsDevelopment Programme (UNDP) (2011). Human Development Report. UNDP. |
|
|
World Bank (2008). World Development Report. Washington D.C: World Bank. |
|
|
Zikmund WG (1997). Business Research Methods, fifth edition. Fort Worth, The Dryden Press. |
|
Copyright © 2024 Author(s) retain the copyright of this article.
This article is published under the terms of the Creative Commons Attribution License 4.0


