Full Length Research Paper

ABSTRACT
In Ethiopia, cereal production and marketing are the means of livelihood for millions of households. Teff is the major cash crop grown in the study area mainly for market. However, the teff marketing has not been given due attention, which has potential production volume and marketability. The objective of this paper is to identify the factors affecting market participation and intensity of teff marketed surplus. A two stage random sampling procedure was used and a total of 154 smallholder farmers were randomly and proportionally selected to collect both primary and secondary data. Heckman two-stage model was used. The first stage model result indicated that lagged price, family size and credit access were factors that influenced market participation and second stage model result indicated that amount of teff produced, family size, land size, livestock and age were factors that determined the extent of teff marketed. Providing adequate size of credit, improving production of teff which enhances its productivity and relying on intensive cultivation are strategies to increase farmers' participation in teff marketing.
Key words: Heckman two-stage model, teff, market participation and intensity of participation.
INTRODUCTION
Agriculture is the mainstay of the Ethiopian economy contributing about 46% of the GDP and 90% of its export earnings and holding about 85% of the country’s labor force (Tesfaye, 2009). Commercializing smallholder agriculture is an indispensable path towards economic growth and development for most developing countries relying on the agriculture sector (Bizualem et al., 2015). Agricultural marketing plays a vital role in the production, consumption and the economy in general. However, farmers are hindered by limited access to information, services, appropriate technology and capital. These factors restrict their capacity to effectively participate in the marketing of their produce (Bonabana, 2013). The weak performance of the agricultural markets has been recognized as a major hindrance to the agricultural development and the overall economy. Some regions experience depressed local price due to surplus production but higher in other regions, even when there is a balance between aggregate supply and demand at national level due to the poor marketing system. So a critical problem stands in the course of formulating appropriate policies and procedures for the purpose of increasing marketing efficiency (Haile, 2009).
To meet the ever increasing demand of teff, the country is heavily dependent on the availability of adequate local supplies particularly from Amhara region. In order to expand the leading role agriculture plays in economic growth and poverty reduction, smallholder farmers need to improve their marketed surplus. A higher marketed surplus would help farmers to participate in a high value markets by increasing their level of income. Despite the importance of teff for better income generation, smallholder farmers in Dera District continue to face numbers of challenges related to marketing. Though teff is one of the Ethiopian most traded goods, as the commodity price has plunged in recent years it is increasingly hard for teff farmers to survive on their crops (Bizualem et al., 2015). Even if some farmers are continuously encouraged to increase supply of teff into the market, the low price offer forces farmers to hoard their products waiting for better price.
The nature of the commodity on the one hand and lack of properly functioning marketing system on the other hand often result in lower producers’ price. Limited access to market facilities, less exposure for market information, infrastructural problem, inadequate support services and problem in transportation services are some of the problems resulting in low participation of smallholder farmers in selling their products. More importantly marketed surplus of teff in the study area is subjected to seasonal variation where surplus supply at the harvest time is the main feature (preliminary information). Therefore, understanding variables affecting marketed surplus of teff can be of great importance in the development of sound policies with respect to agricultural marketing and prices and overall rural and national development objectives of the country. Hence, it is was important to identify factors affecting market participation and intensity of marketed surplus of teff.
METHODOLOGY
Description of the study area
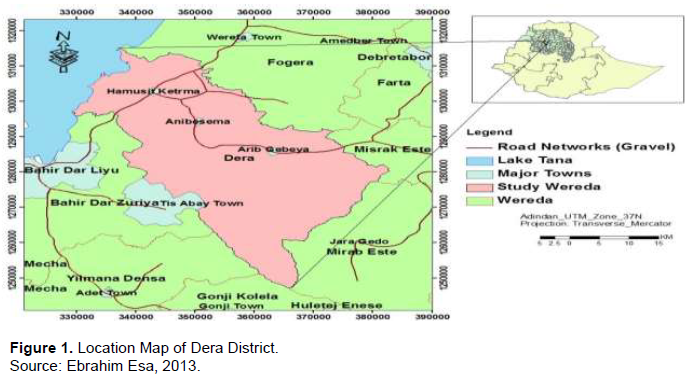
The study was conducted in Ethiopia Amhara National Regional State South Gondar Zone specific to Dera District rural households. Amhara National Regional State is located at 9° and 13° 45’ north latitude and 36° and 13° 45’ east longitude. Dera is one of the districts in the Amhara Region of Ethiopia. Dera District is one of the 11 districts in South Gondar Administrative Zone. It is bordered on the south by the Abbay River which separates it from the West Gojjam Zone, on the west by Lake Tana, on the north by Fogera, on the northeast by East, and on the east by West. Dera District is found at 42 Km from Bahir Dar, which is the capital city of Amhara Regional State and about 79 Km from Debre Tabor, which is the capital city of South Gondar zone. The woreda lies between 37°25΄45΄΄E-37°54΄10΄΄ E longitude and 11°23΄15΄΄ -11°53΄30΄΄N latitude with an area of 152,524.13 ha (Ebrahim, 2013). To total surface area of the district is 1,525.24 square kilometers and known by potential teff production. The district is characterized under Woina Dega agro- ecological zone with an average rain fall ranging from 1000-1500 mm; its annual temperature is between 13 and 30°C. The district altitude ranges between 1,560 to 2,600 m.a.s.l. Flat land accounts for 51% and mountain and hills are the rest 49% (DDAO, 2015) (Figure 1).
Sampling technique and sample size
A two stage sampling procedure was employed to select potential teff producer households. First, five potential teff producer kebeles from the District were selected through purposive sampling method. During the selection, the kebele’s potential for teff production and the accessibility of the areas to travel were taken into consideration. In the second stage, using the population list of teff producer farmers from sample kebeles, the intended sample size was determined proportionally to population size of teff producer farmers. Then 154 representative households were randomly selected using simple random sampling technique of Yamane (1967) formula.  . Where: n is the sample size, N is the population size (total household size) and e is the level of precision. For this study 8% precision level was used. Based on the number of the total households (9218) in the sampling frame, the formula was equated and reached a minimum of 154 respondents to be drawn.
Data source and data collection method
Both primary and secondary data on a wide variety of variables were gathered to meet the objectives of the study. Primary data were collected through the administration of semi-structured and personal interview by a team of five trained enumerators to 154 small-scale teff farmers and key informants were the other method of data collection. Secondary data were collected from past reports and studies conducted by institutions and researchers.
Data analysis
Two types of analysis, namely: descriptive and econometric analyses were used for analyzing the collected data.
Descriptive statistics
The main descriptive indicators that were employed are t-test and Chi square to investigate the relative difference between market participants and non-market participants of teff marketing. This method of data analysis refers to the use of ratios, percentages, means, and standard deviations in the process of examining and describing marketing facilities, services and household characteristics.
Econometrics analysis
The appropriate econometric models that can help to identify the factors affecting the amount of teff sold to the market and the market participation decision are Tobit or Heckman Two-stage (Gujarati, 2004; Heckman, 1979). Heckman Two-Stage model was employed because of its advantages over the Tobit model in its ability to eliminate selectivity bias and it separates the effect of variables on the probability of market participation from the effect on the volume of tef that can be sold (Heckman, 1979). Using the Heckman sample selection model, the first stage is market participation equation, which helps to identify factors affecting tef market participation decision using Probit. Then in the second stage, OLS regression was fitted along with the probit estimate of the Inverse Mill’s ratio to identify factors that determine the volume of marketed surplus of teff.
(1). The probability of a household’s head to participate in supplying of teff was given by the selection equation as:
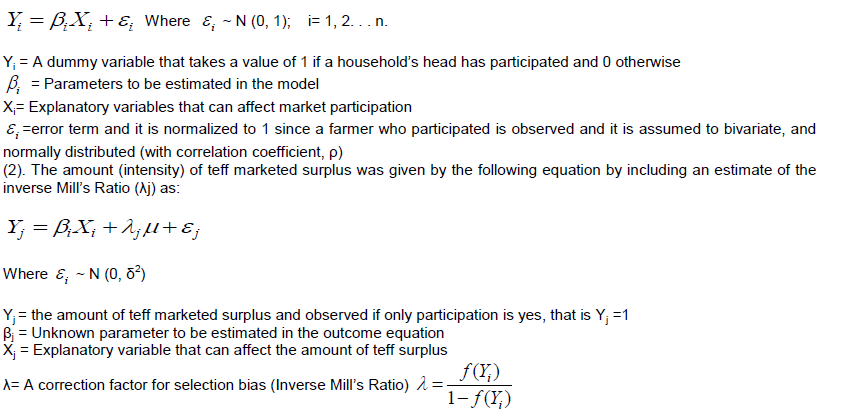
εј = Error term, this is assumed to be bivariant, and normally distributed with correlation coefficient , δ2
If IMR is insignificant, interpretation of the results from the Heckman two-step procedure was not relevant for the fact that the procedure is highly sensitive to model misspecification. If the IMR included in the supply equation by regressing all the variables in the selection equation is insignificant, we need to drop it because it creates bias due to inclusion of irrelevant variable. This problem can be accounted for by estimating the two equations (participation and supply equations) simultaneously by the Heckman ML method where the IMR is omitted from the set of the explanatory variables.
RESULTS AND DISCUSSION
Description of teff production and marketing
Table 1 presents the demographic and socio-economic characteristics of the sample respondents in relation to market participation. The total sample size of the farm respondents handled during the survey was 154. Out of the total sample respondents, 85.7% were male headed households and 14.3% were female headed households. In terms of market participation, 70.13% of market participant were male headed, while 8.44% were female headed. On the other hand, 15.58% of non-market participants were male headed households, while 5.84% of non-market participants were female headed households. The chi-square result in Table 1 showed that sex is statically significant at 5% significance level. This indicates there is an association between market participant and non-participant. Majorities of sample respondents were male headed households in the study area (district). This implies that the participation of women/females/ in teff cultivation was very low; this might be related with unequal distribution of resources as well as cultural barriers and belief of the society.
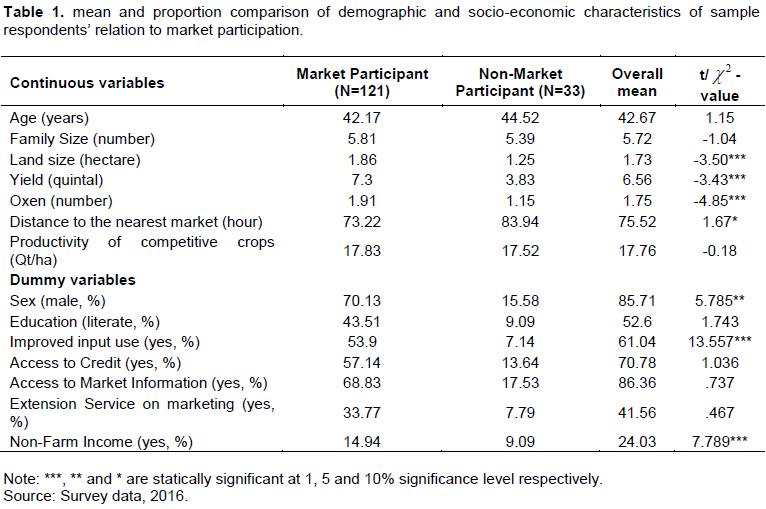
In terms of land size, the result indicates that the average land size owned by market participants was 1.86 ha, while that of non-market participants was 1.25 ha. The overall mean of land size owned by sample farmers was 1.73 ha. The result of t-test indicates that land size is statistically significance at 1% significance level. This means that the mean land sizes owned by market participants are greater than that of non-market participants. Therefore, land is the single most important factor of production and a measure of wealth in the study area.
In terms of teff yield, the result indicates that the mean of teff yield produced by market participants per year was 7.3 quintals while that for non-market participants was 3.83 quintals. The overall mean of teff yield was 6.56 quintals. The result of t-test shows that teff yield was statistically significant at 1% significance level. This indicates that the market participants had more teff yield than non-market participants. The result is consistent with the findings of Astewel (2010) and Geoffrey (2014) who confirmed that increasing the volume of production increases market participation.
In terms of oxen owned, the result indicates that the mean of oxen owned by market participants was 1.91 numbers, while that for non-market participants was 1.15 numbers. The overall mean of oxen owned by the sample household farmers were 1.75 numbers. The result of t-test shows that number of oxen owned was statistically significant at 1% significance level. This indicates that market participant farmers owned more numbers of oxen than non-market participant farmers. Oxen increases agricultural production and productivity. This implies that increasing the volume of production increases the market participation of farmers.
In terms of distance to the nearest market, the assessment on this variable, measured in single-feet minutes. Most of the sample farmers have to walk a long distance from home to the nearest market to sell their agricultural products. Access to physical market infrastructure is fairly low in the villages thus farmers to take their commodities to the nearest market. The result indicates that the mean of distance to the nearest market for market participant was 73.22 min, while that of non-market participant was 83.94 min. The overall mean of distance to the nearest market for sample respondents was 75.52 min. The result of t-test shows that distance to the nearest market was statistically significant at 10% significance level. This indicates the mean distance to the nearest market for market participants were less than non-market participants. The distance to the market has been found to have a negative impact on market participation. The result is consistent with the finding of Geoffrey (2014) who found that a greatest distance to the market increases transaction costs and marketing costs and this hampers the extent of market participation.
In terms of agricultural input use of household head, agricultural inputs are important elements for production and productivity. As a result the typical inputs utilized for the production of teff were improved seed, fertilizer, chemicals and farm implements. Almost all teff farmers used fertilizer and chemicals for the production of teff but the only difference was with regard to the use of improved seed. The result indicates that 53.9% of market participants were utilized improved inputs, while 24.68% was not used improved inputs. On the other hand 7.14% of non-market participants were utilized improved inputs, while the remaining 14.29% was not utilized improved inputs. The overall agricultural input use status of sample households was dominated by improved input users, which accounts for 60.04% and the remaining 38.96% was non-users. The result of chi-square shows that the use of improved input was statistically significant at 1% significance level. The use of agricultural inputs increases the volume of production. This implies that increasing the volume of production increases the market participation of farmers.
In terms of non-farm income, farming was the main occupation and source of likelihood for all sample farmers (100%) in the study area. Almost all farmers have been practicing mixed farming system. However, in addition to farming activities, some respondents have also engaged in non-farm activities like in small trading activities. This is believed to raise their financial position to acquire new inputs. The result indicates that about 14.94% of market participants were engaged in non-farm activities, while 63.64% was not engaged in non-farm activities. On the other hand, 9.09% of non-market participants were engaged in non-farm activities, while 12.34% was not engaged in non-farm activities. The overall status of sample farmers related to engaging in non-farm income activities was dominated by non-market participants, which accounts for 75.97% and the remaining 24.03% was market participant farmers. The result of chi-square shows that non-farm income was statistically significant at 1% significance level. A farmer who engages in non-farm activities reduces the volume of production. This implies that the reduction of the volume of production decreases the market participation of farmers.
Econometrics result
The Heckman sample selection model was employed to identify the determinants of teff market participation and marketed surplus. Before running Heckman two-step selection model, Multicollinearity test was carried out. In this study, the result showed that Multicollinearity was not a problem.
Factors influencing teff market participation
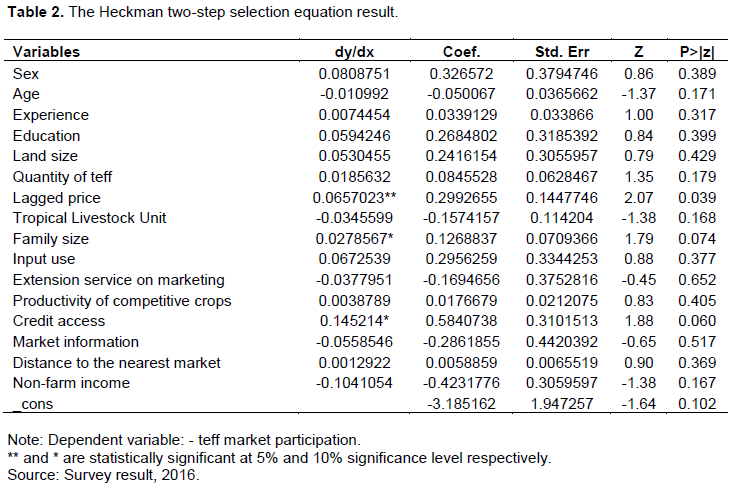
The results of first stage Heckman two-step selection model estimation of the determinants of teff market participation of the sample households are given in Table 2. Out of 16 potential variables, three variables significantly influence the decision to participate in teff marketing.
Lagged price
This was a lagged price that a farmer sees from the neighbor that probably contributed to decide to participate in teff marketing. According to the econometric result, lagged price was found positively and significantly influenced the farmers decision to participate in teff marketing and statistically significant at 5% significance level. As lagged price increased by one birr per kilogram, it increases the probability of farmers to participate in teff marketing by 6.57%, all other factors held constant. In line with this, a study conducted by Abay (2007) found that lagged price had a positive and significant effect on tomato farmers' decision to participate in the tomato market.
Family size
As expected, family size (measured in adult equivalent) positively and significantly influences the farmers’ decision to participate in teff marketing and is statistically significant at 10% significance level. This indicates that as the number of family size increases by one, it increases the probability of farmers to participate in teff marketing by 2.79%, all other factors held constant. The reason behind is obvious a farmer who has more family size has more family labour which is the major source of labour force in the area; hence those farmers who have access to more family labour are likely to produce more quantity of teff which in turn increases the probability of farmers to participate in teff marketing.
Credit access
As expected, access to credit positively and significantly influence the farmer’s decision to participate in teff marketing at 10% significance level. This indicates that a farmer who has credit access increases the probability of participating in teff market by 14.52%, all other factors held constant. This suggests that access to credit improves the financial capacity of farmers to buy improved inputs, thereby increasing production which is reflected in the marketed surplus of teff. This finding is in line with Ashenafi (2010) who found that credit access had positive and significance influence on farmers’ decision to participate in grain marketing.
Factors influencing teff marketed surplus
Heckman second stage estimation identifies factors that determine the extent of teff market participation by using the selection model which included the inverse Mill’s ratio calculated from probit estimation of teff market participation. The coefficient of Inverse Mill’s ratio (Lambda) in the Heckman two-stage estimation is significant at less than 5% probability level (Table 3). This indicates that sample selection bias, existence of some unobservable farmer characteristics determine farmers’ participation in teff market and thereby affecting marketed surplus. The chi-square result indicates that the overall goodness of fit (model adequacy) of the Heckman two-step selection model is statistically significance at a probability of less than 1%. This shows that jointly the independent variables included in the selection model explain the level of teff market participation.
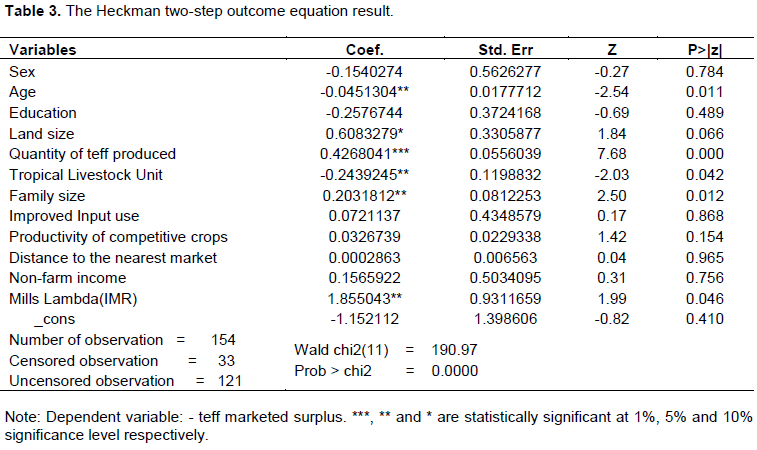
Age
It was hypothesized that the age of household head could determine their marketed surplus positively. This was from the point of view of the experience that they could acquire through time. However, the opposite was revealed from the result. The age of household head negatively and significantly influences quantity of teff supplied to the market at 5% level of significance. It indicates that as the age of the household head increases by a year, the quantity of teff supplied to the market decreases by 0.045 quintal, all other factors held constant. This is because when households get older and older, they tend to rent out their land or they shift to the production of lesser labour intensive farming alternatives; also the younger people are more receptive to new ideas and are less risk averse than the older people. This finding is in line with Adugna (2009) who found that age of household head had negative and significance influence on farmers' marketable supply in onion marketing.
Land size
The influence of this variable on the extent of teff marketed was as predicted in the original hypothesis. The landholding size of farmers/household head positively and significantly affects the quantity of teff supplied to the market at 10% level of significance. It indicates that as the landholding size of household head increases by a hectare, the quantity of teff supplied to the market increases by 0.608 quintal, all other factors held constant. This finding is in line with Bosena (2008) who found that size of landholding of household head had positive and significance influence on farm level marketable supply of cotton in Metema District.
Amount/quantity of teff produced
The influence of the amount of teff produced on the extent of teff marketed was as predicted in the original hypothesis. The total annual quantity of teff produced in a year had positively and significantly influence on the quantity of teff supplied to the market at 1% level of significance. It indicates that a household who produced more quantity of teff had also supplied more to the market or when the production of teff in a given year is better, the higher the market supply and the amount of teff that can be sold to the market. The result reveals that the amount of teff produced by the farmer increases by one quintal, the quantity of teff supplied to the market increases by 0.43 quintal, all other factors held constant. This is in line with the findings of Habtamu (2015), Amare (2014), Rehima (2006), Assefa (2009), Ayelech (2011), Muhammed (2011) and Abraham (2013) who found that the amount of potato, pepper, pepper, honey, avocado and mango, teff and wheat, and vegetables (potato, cabbage and tomato), respectively, produced by farmers/households influence quantity of supplied to the market for each commodity positively and significantly. Hence, the amount of teff produced by households is one of the major factors that determine the volume of teff supplied to the market.
Number of Livestock (TLU)
The influence of livestock (in terms of tropical livestock unit) owned by households on the extent of teff marketed was as predicted in the original hypothesis. The number of livestock owned by household head negatively and significantly influences the extent of teff supplied to the market at 5% level of significance. This indicates that as the number of livestock owned by household increases by one, the quantity of teff supplied to the market decreases by 0.24 quintal, all other factors held constant. The reason behind is that farmers who have more livestock tend to sell them instead of selling teff produced to cover their repayment of input purchased as well as household consumption needs; they may tend to specialize in livestock production as a means of generating cash. This is in line with the findings of Rehima (2006) and Efa et al. (2016) respectively, who found that the number of livestock owned by farmers influences the quantity of pepper and teff supplied to the market negatively and significantly.
Family size
The influence of family size (measured in adult equivalent) of households on the extent of teff marketed was as predicted in the original hypothesis. The number of family size that the household head holds positively and significantly influences the quantity of teff supplied to the market at 5% level of significance. This indicates that as the number of family size household head holds increases by one, the quantity of teff supplied to the market increases by 0.203 quintal, all other factors held constant. The reason behind is obvious: a farmer who has more family size has more family labour which is the major source of labour force in the area; hence those farmers who have access to more family labour are likely to produce more quantity of teff which in turn increases the quantity of teff supplied to the market. This is in line with the finding of Alene et al. (2008) who found that a larger family size provides cheaper labour and produce more output in absolute terms which in turn increases the quantity of output to be sold.
CONCLUSION AND RECOMMENDATION
Teff is an important cash crop in Dera District. It takes the lion's share of the available cultivable land and produced mainly for market. Demographic and socio-economic characteristics of sample respondents were determined. Teff market participation and extent of market participation were influenced by different sets of factors in the Heckman two-step selection model. To this effect, lagged price, family size (adult equivalent) and credit access influence farmers’ decision to participate in teff marketing. On the other hand, age of household head, land size of household, quantity of teff produced, tropical livestock unit family size and inverse mill’s ratio were found significantly influencing the extent of teff market participation. Therefore, based on the finding of this study, the following points are recommended to develop sustainable production and marketing of teff that is locally adaptable and acceptable to increase the competitiveness of smallholder farmers: improving access to credit to apply fertilizer, farmers should rely on intensive cultivation rather than extensive cultivation and strengthen extension service.
CONFLICT OF INTERESTS
The authors have not declared any conflict of interests.
REFERENCES
|
Abay A (2007). Vegetable Market Chain Analysis in Amhara National Regional State: The Case of Fogera Woreda, South Gondar Zone MSc. Thesis Haramaya University. |
|
|
Abraham T (2013). Value Chain Analysis of Vegetables: The Case of Habro and Kombolcha Woredas in Oromia Region, Ethiopia MSc. Thesis Haramaya University. |
|
|
Adugna G (2009). Analysis of Fruit and Vegetable Market Chains in Alamata, Southern Zone of Tigray: The Case of Onion, Tomato and Papaya. MSc. Thesis Haramaya University. |
|
|
Alene AD, Manyong VM, Omanya G, Mignouma HD, Bokanga M, Odhiambo G (2008). Smallholder Market Participation under Transactions Costs: Maize Supply and Fertilizer Demand in Kenya. Journal of Food Policy 3(3):318-328. |
|
|
Amare T (2014). Determinants of Agricultural Commodity Market Supply. Journal of Economics and Sustainable Development 5(7):55-62. |
|
|
Ashenafi A (2010). Analysis of Grain Marketing in Southern Zone of Tigray Region, Ethiopia. Master of Art in Cooperative Marketing, MSc. Thesis Mekelle University. |
|
|
Assefa A (2009). Market Chain Analysis of Honey Production: In Atsbi Wemberta District, Eastern Zone of Tigray National Regional State. MSc. Thesis Haramaya University. |
|
|
Astewel T (2010). Analysis of Rice Profitability and Marketing Chain: The Case Of Fogera Woreda, South Gondar Zone, Amhara National Regional State, Ethiopia. MSc. Thesis Haramaya University. |
|
|
Ayelech T (2011). Market Chain Analysis of Fruits for Gomma Woreda, Jimma Zone, Oromia National Regional State. MSc. Thesis Haramaya University. |
|
|
Bizualem GA, Degye HG, Zekarias S N (2015). Analysis of marketed surplus of coffee by smallholder farmers in Jimma zone, Ethiopia. Journal of Biology, Agriculture and Healthcare 5(5):242-252. |
|
|
Bonabana J (2013). The Performance of Potato Markets in South Western Uganda. Journal Development and Agricultural Economics 5(6):225-235. |
|
|
Bosena T (2008). Analysis of Cotton Marketing Chains: The Case Of Metema Woreda, North Gondar Zone, Amhara National Regional State. MSc thesis Haramaya University. |
|
|
Dera District Agriculture Office (DDAO) (2015). Draft report on agriculture production and productivity and agro ecology of Dera district. |
|
|
Ebrahim E (2013). Land Suitability Assessment for Sorghum and Maize Crops Using a SLA and GIS Approach in Dera Wereda, ANRS, Ethiopia. Ethiopian Rennassance Journal of Social Science and Humanities 1(1):119-139. |
|
|
Efa GT, Degye G, Tinsae D, Tadesse K (2016). Determinants of market participation and intensity of marketed surplus of teff producers in Bacho and Dawo districts of Oromia State, Ethiopia. Journal of Agricultural Economics and Development 5(2):020-032 |
|
|
Geoffrey S, Hillary B, Lawrence K (2014). Determinants of Market Participation among Small-scale Pineapple Farmers in Kericho County, MSc thesis Kenya Egerton University. |
|
|
Habtamu G (2015). Analysis of Potato Value Chain in Hadiya Zone of Ethiopia. MSc thesis Haramaya University. |
|
|
Haile A (2009). Analysis of sesame production, supply, demand and marketing issues in Ethiopia. MSc thesis Haramaya University. |
|
|
Heckman JJ (1979). Sample selection bias as a specification error, Econometric 47(1):$161-153. |
|
|
Muhammed U (2011). Market Chain Analysis of Teff and Wheat Production in halaba Special Woreda, Southern Ethiopia; MSc thesis Haramaya University. |
|
|
Rehima M (2006). Analysis of red pepper Marketing: The case of Alaba and Silitie in SNNPRS of Ethiopia. A M.Sc. Thesis presented to School of Graduate Studies of Haramaya University. |
|
|
Tesfaye Z (2009). Determinants of adoption of maize technologies and inorganic fertilizer in Southern Ethiopia. Research Report No. 39. Ethiopia Agricultural Research Organization (EARO). |
|
|
Yamane T (1967). Statistics, an Introductory Analysis, 2nd Ed. New York: Harper and Row. |
|
Copyright © 2024 Author(s) retain the copyright of this article.
This article is published under the terms of the Creative Commons Attribution License 4.0


