ABSTRACT
Agricultural companies (2011-2013) were chosen as the samples of this study. Financial report data were used to analyze the disciplines of the executives, their strength mean, research and development (R&D) strength and productivity. The results of the empirical research showed that companies with technology executives will significantly have increased R&D intensity; but companies with management executives would have reduced R&D intensity; while both executives would have increased R&D intensity. Hiring management executives would have significant impact, but technical executives have no significant impact. Agricultural companies’ R&D intensity and corporate productivity have a significant negative correlation, because R&D transformation takes longer time. It is believed that reasonable arrangements of senior management structure, a modest increase in business R&D intensity, vertical integration strategy for improving productivity and competitiveness of core formation are necessary.
Key words: Knowledge-based executives, agricultural companies, R&D intensity, productivity.
With the current agricultural development faced by small enterprises, the extensive mode of development, aging workforce, poor organization, poor health service system and other outstanding issues, the state made it clear at the policy level to build intensive, professional, organizational, and social operating system to speed up China's agricultural modernization process. Throughout the process of agricultural modernization in Europe, America and other developed countries in the last centuries, the effective supply of agricultural enterprises has made farmers to increase employment; the construction of modern agriculture plays an important role. The Ministry of Agriculture shows that as at the end of 2012, our agricultural enterprises were nearly 110,000, with annual sales income of more than 5.7 trillion yuan; agricultural products provided the total market supply; 1/3 cities supply more than two thirds of agricultural exports, accounting for over 80% of total exports. Presumably, within "five-second", the total number of enterprises will reach 150,000, their sales will reach hundreds of billions; there will be an annual output value of over $10 billion, which would lead to clusters of enterprises.
Scientific and technological innovation is a breakthrough resource, but environmental constraints will hinder sustainable and stable development of agricultural base support. The development of leading enterprises is inseparable from scientific research and innovation in agricultural science and technology innovation capacity. The Ministry of Agriculture supports the promotion of agricultural science and technology enterprises to develop innovative ideas; it clearly supports the hosting of enterprises, commitment to agricultural science and technology projects, the establishment of a high level of research and development (R&D) institutions, the establishment of science and technology, promotion of scientific and technological talents, rational allocation of resources, etc. A number of guiding opinions help to improve the capability of independent innovation of agricultural enterprises, agricultural science and technology to solve the problem of out touch with production and management. As modern production factor is the most important human capital (particularly senior management), it is bound to become the decisive force to accelerate the construction of modern agriculture, starting by ensuring national food security, effective supply of agricultural products and other important long-term roles.
However, China's leading academics on agricultural research and development investment and different disciplines of executives lag behind in this area. Most of the R&D investment and productivity research are still limited to advanced manufacturing, computer software industries, research on agricultural research and development investment, and the transformation rate is very limited. From the overall small-scale agricultural enterprises, their R&D investment cannot truly improve their productivity. This is an important reason for the lack of R&D investment, which leads directly to lack of research. But in the stock exchange generally, the industries are leading, mainly in large-scale production, corporate governance structure, appropriate R&D investment, high scientific and technological achievements conversion rate. China's capital markets are maturing in the background; the securities regulatory agency responsible for disclosing the information of the listed companies have stringent financial report for corporate human capital, R&D investment, and productivity, and the reliability of the data obtained is greatly improved. In January 1, 2013 the companies provided guidelines for information disclosure content and format. This paper studies the disciplines of the senior management listed in agricultural sector, R&D intensity of internal relations to provide business productivity between micro-data at the industry level.
Faced with an increasingly competitive external environment, improving total factor productivity has been the subject of managers, shareholders and other stakeholders. Foreign scholars doing a large number of empirical studies have shown that the continuous enhancement of R&D investment (total R&D) and R&D intensity (R&D and total revenue ratio) can significantly increase productivity (Hall and Mairesse, 1995; Jefferson et al., 2006). However, domestic scholars’ conclusion about the relationship between independent R&D investment, productivity and intensity in literature is controversial. Some scholars believe that independent research and development, technology transfer, foreign investment in R&D are total factor productivities, which have a significant role in promoting and improving business performances (Wu, 2008; Feng and Chen, 2013). Further study found that it is only when the R&D intensity is moderate, that is when a range of business productivity can have the greatest role in promoting the intensity; if it is too high or low it will offset this mechanism (Maode et al., 2013).
But another part of the researchers found that, at this stage of internal R&D, increasing productivity has a significant negative effect; it will not only fail to encourage enterprises to improve competitiveness, but will reduce productivity (Li, 2010). In the agricultural enterprises there is a significant positive correlation between more R&D investment and the risk of bankruptcy (Huangjie et al., 2014). Existing research suggests that employees enhancing human capital can significantly enhance the absorption of existing technologies and applications. This results in the motivation to create new technologies that increase investment in research and development to produce the direct cause (Raffaello and Paolo, 2009; Xia, 2010). As a business decision-making and senior management personnel (including directors, supervisors and other senior executives), their behavioral characteristics influence the company's future growth and development. Educated executives at the industry level encouraging technological innovation (Subrahmanya, 2005), and formal and technical knowledge for grasping of technological innovation achievements conversion rates are positively correlated (Marvel and Lumpkin, 2007); thus human capital is the driving innovation and transformation determinant (Winne and Sels, 2010).
Chinese scholars use incentives given to executives to expand research. The question is, ‘is short-term or long-term equity incentive compensation positively correlated with R&D investment, and do state-owned and high-tech enterprises have more significant impact (Wang and Chai, 2012; Yu and Wang, 2014). The researchers also found that technical executives involved in R&D investment have a significant positive effect, but R&D investment due to the technical background of executives has certain inhibition (Yu and Wang, 2014). This work empirically demonstrates a significant impact of business R&D intensity or total factor productivity, but this work uses a large sample of data in all sectors; it focuses on industrial manufacturing, information technology services, traditional animal husbandry and fishery. There were no traditional agriculture and its related upstream and downstream industries (including agricultural and sideline products processing, food and beverage manufacturing, etc.) as research subjects in the literature on agriculture sector, which is clearly inconsistent with the connotation and extension of modern agricultural enterprises. The current literature in the study of individual executives states the impact of R&D investment. Failure to function in all types of executives is classified, but executives of the different functions of class technology, management and other R&D investment are clearly different. In the existing literature, modern agro-industries’ micro data used to study the characteristics of different professional executives of R&D investment, and the impact of R&D intensity on the enterprises’ total factor productivity can be used for further expansion.
Data sources
Animal husbandry and fishery sample of enterprises listed in Shanghai and Shenzhen main board, agro-food processing industry, food industry, alcoholic beverages and refined tea manufacturing limited to R&D investment are disclosed in the Commission after the promulgation of "Annual Report Guidelines" (revised 2012), taking into account the report of current year. But, the information available may be that of previous year. So this study selects the time zone of 2011-2013. These enterprises’ annual financial report was downloaded from the Shanghai and Shenzhen Stock Exchange official website, and chose to disclose the amount of R&D investment; it accounted for the operating income ratio, the formation of 244 3-year panel data as samples and data sources of 2011, 37; 2012, 100; and 2013, 137.
The model specification and variable selection
The empirical analysis consists of three parts: one, examining the relationship between knowledge-based executives and corporate R&D investment; two, measuring the production efficiency, and three, studying the impact of the manipulated variable R&D investment and productivity relations.
Relationship between knowledge-based executives and corporate R&D investment
This paper investigates the impact of knowledge-based executives on R&D strength. Usually companies will employ technical, management, legal and other three professors with doctoral degrees or titles as senior management. This article does not consider the legal executives as having impact on R&D intensity. Depending on the technology employed, management executives are divided into four categories: two categories are only in the management class; the other two are both in technical and managerial class, so as to establish a model for the academic disciplines of research and development executives:

R&D is the ratio of R&D investment and business current revenue. TE, ME, and BE, respectively are technology class, management class, and both technical and managerial class and business executives are the dummy variables; the variable reference is neither technology class, management class, nor business executives. β1, β2, and β3 are the corresponding variable parameter estimates. Φ is the control variable, δ is the vector of parameter estimates. Note that, it is only when the value of the confidence interval is not 0, that is when the parameter estimates would have meaning. As shown earlier, the executives’ education experience and their mastery of technology will make them request for additional R&D investment, so technology is expected to help improve the executives’ R&D investment. According to smiling curve theory, value-added business activities take place in more R&D and marketing of these two links; while the lowest increases in the manufacture of intermediate links.
When companies only involve in the daily management of production and business class executives, the paper industry is expected to increase the payment chain end marketing, research and development which will reduce the strength of the enterprise. When the technology and management executives participate in the production and operating activities, it would have impact on the intensity of R&D investment. In order to accurately estimate the impact of R&D, the executives’ disciplines strength must also control other factors that may affect R&D strength. According to the relevant theory and literature search, this article selected control variables including economic disparities, firm size, debt ratio, ownership concentration, and regions.
(1) Enterprise scale: Expansion of business scale enables one to face the broader market, therefore, is expected to positively affect R&D intensity scale enterprises. Herein, the size of the enterprises’ total assets is based on the value of the natural logarithm.
(2) Asset-liability ratio: Ratio of total liabilities to total corporate assets is the asset-liability ratio; this paper argues that only companies in the debt ratio will increase the low level of R&D investment, so there is expected negative impact of corporate assets and liabilities on the R&D strength.
(3) Ownership concentration: When most equity firms are sometimes occupied by minority shareholders, the company's future operations are likely to be under minority shareholder control. If the R&D strength under minority shareholders is uncertain, the proposed model under the largest shareholder will be more than 50% of the reference variable, making the holding ratio less than or equal to 50% dummies.
(4) Regional economic disparities: The status of unbalanced regional economic development projections in the eastern part of the total economy is significantly stronger than that of the northeast, central and western regions. In this paper, corporates were registered in the eastern provinces or municipalities as a reference variable, while those registered in other parts were set as dummies.
Production efficiency calculation model
On the second phase, it is assumed that each sample has its own stochastic frontier production function, using data envelopment analysis (DEA) to estimate the productivity of all samples; while inputs and outputs are clearly defined. In other industries, there are not only main inputs of capital and labor but also modern agribusiness production factor. The special nature of the agricultural production of raw materials, seeds, fertilizers, pesticides and others occupies a higher proportion of the factors of production if all the refinement of indicators could lead to multicollinearity problems, in order to reflect as accurately as possible the enterprises’ input elements. This paper selected indicators of capital investment, labor, and other inputs. Among them, capital investment and net fixed assets in the financial statements should be reflected; accurate labor inputs should be measured. Considering it is difficult to obtain, at the end of the year the company’s financial report discloses registered number of employees, other inputs with main business income, total amount of administrative expenses of the enterprise and output indicators for the year’s total income (million). Some scholars identified the output indicators of total income, and other scholars believe that net profit is more appropriate, taking into account factors that affect operating income. Income taxes are not considered in this paper; output indicators are recognized as gross revenue.
R&D investment and productivity in relation to adjusting the variables introduced
R&D investment and R&D funding affect business productivity, but the magnitude and direction of influence is not uniform. The relationship between the two may be affected by the operating conditions of internal and external business environment; so to explore the precise relationship between them, one must consider the impact of other variables, and these factors are used to adjust variables in the model. From the results of previous studies, this paper selected the following as adjustment variables: firm size, industry, property, capital per worker, and the nature of shares.
(1) Enterprise scale: Expansion of the scale will always lead to "economies of scale" effect. When the agricultural industry has a strong competitive impact on firm size, R&D investment and productivity will not be inverted U-shape. Therefore, this article shows the relationship between firm size and productivity of R&D is positive; the value is firm size Total assets (million) based on the value of natural logarithm.
(2) Industry attributes: Agriculture, forestry, animal husbandry and fishery enterprises are primary products producers, while manufacturing firms are primary processors of products; the downstream industry chain enterprises need stronger R&D. Therefore, animal husbandry and fishery enterprises are assigned 0 in the model, while manufacturing enterprises are 1 in the entry model.
(3) Capital per worker: When each worker has a modest capital, there would be a positive relationship between per capita capital investment and R&D productivity; otherwise, it will be counter-regulatory relationship. The value of capital per period, its total assets (million) and the ratio of the number of employees registered are natural logarithm.
(4) Nature of shares: Expected shares of the different nature of the regulation of companies’ R&D investment and productivity are different. This article analyzes the largest shareholders of state-owned property, shares of natural persons, and mixed shares assigned 2, 3 in the entry model.
Descriptive statistics and correlation test
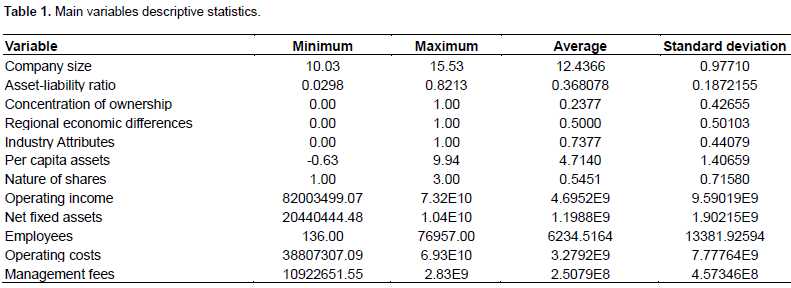
The dependent variables used in the empirical study were descriptive statistics, as shown in Table 1. In Table 1, from China's listed companies in the agricultural industry, their average asset-liability ratio is not high, indicating that most of the companies' capital structure is more reasonable. Their property industry average was 0.74. This indicates that the mean of most of the companies listed in the agricultural industry chain downstream is 2.55. This shows that majority of the equity of the enterprise is not owned by the state; a large gap between the number of employees shows there is a big difference between the size of the companies. In addition, Pearson’s correlation test was used to calculate the control variable, manipulated variable; the absolute value of the correlation coefficient for the amount of output variables within each group was less than 0.5. This indicates there was no serious multicollinearity between variables.
EMPIRICAL RESULTS AND DISCUSSION
Relations executives’ disciplines and R&D intensity
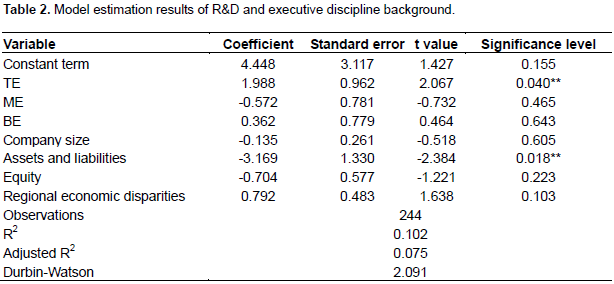
This work uses Stata13.0 fitting software development and business executives’ disciplines model, and the model of the firm size, debt ratio, ownership concentration, regional differences as control variables in the model. The result is shown in Table 2. Overall, only technology executives can significantly promote the increase in R&D intensity, while the role of the management executives showed that more companies had reduced R&D intensity. When business executives in both of these groups have positive effect greater than the negative effects of technology executives, management executives will have increased R&D strength. In addition, the results of the control variables in the model estimation, asset-liability ratio, regional differences in line with theoretical expectations show that the lower the debt ratio, the greater the economic activity in the more developed regions. The scale of business results does not meet the expectations theory; the larger the enterprise the smaller would be the R&D intensity. Results of ownership concentration of R&D intensity show negative effect.
Calculation of production efficiency and productivity of enterprises of different types of variance test
The first stage of the Stata command of DEA analysis estimates the productivity of each sample; then for different types of enterprises’ productivity analysis of variance was used to compare the mean equality. Table 3 shows the different types of enterprises’ productivity descriptive statistics; Tables 4 and 5 show the productivity homogeneity of variance test results and the results of multiple comparisons. Class I did not represent neither the technology nor the management executives, class II represents only technology executives, class III represents only the management executives, and class IV represents both classes. In Table 3, the vast majority of knowledge-based companies are hiring senior management personnel, in line with the overall trend of modern business development. Management executives employ modern business more than technology-based business executives, indicating agricultural enterprises pay more attention to marketing.
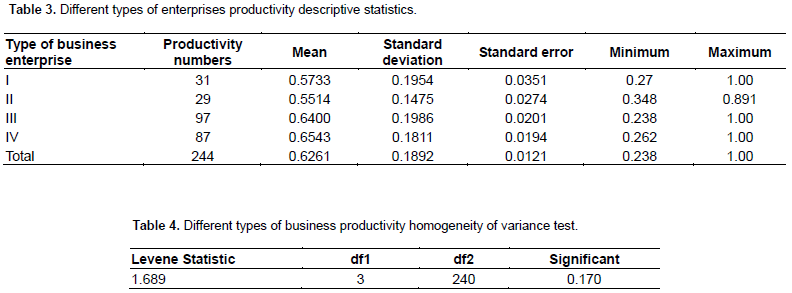
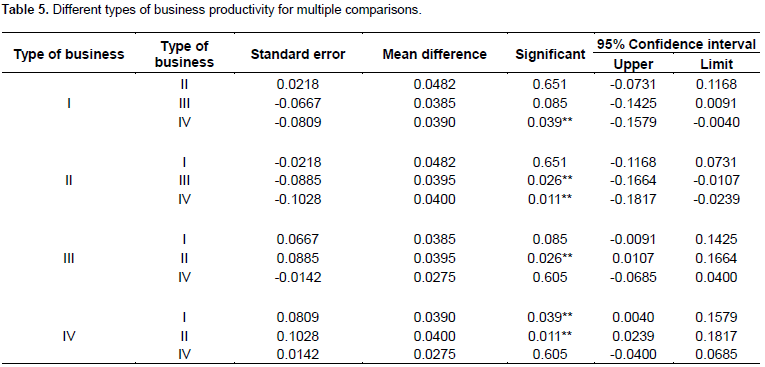
In addition, the maximum value of enterprises’ productivity is 1.00 and the minimum value is 0.238, indicating that there is a big difference in the management efficiency of enterprises. Table 4 shows the homogeneity of variance test results (a significant value 0.170>0.05), indicating that the data set has four homogeneous variance; therefore, they are omitted from the results in Table 5 based on the heterogeneity of variance multiple comparisons. Table 5 shows that there is 5% significance level of differences between constituency I and IV (0.039), II and III (0.026), II and IV (0.011), indicating that appointing senior management for enterprises’ productivity impact is significant.
The role of moderator in R&D investment and productivity
This stage was added in R&D investment, firm size and productivity of the enterprises based on the research, industry, per capita assets, shares for manipulated variable nature using stata13.0 business productivity software to fit the model. The model summary was obtained and the best fit model coefficients are shown in Tables 6 and 7; wherein a variable represents the product of 2× industry R&D intensity, another variable represents the product of 3× per capita assets of R&D intensity, while another one represents the product of 4× R&D strength. All the variables are shown using Durbin-Watson statistic of 1.737; therefore, the assumption that there is no serial correlation between the variables cannot be rejected.
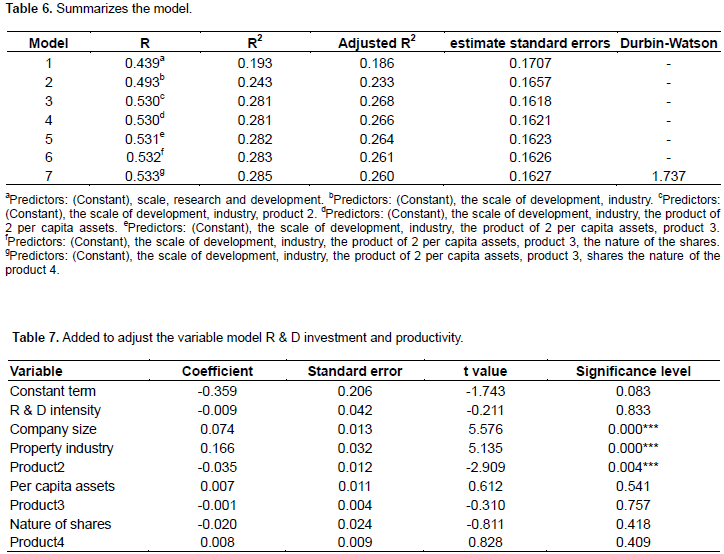
Estimates show that R&D investment and business productivity have a significant negative correlation, indicating agricultural enterprises’ R&D investment in the current period was not successful; industry and corporate productivity have a significant positive correlation; if there is advancement in the downstream industry chain, business productivity will increase. The industry is the moderator and also significantly affects the development of the relationship between investment and enterprises’ productivity. Finally, the per capita share of assets and properties as the moderator of the relationship between R&D and productivity is also in line with theoretical expectations; the higher the per capita amount of the assets, the higher the degree of privatization of its shares as a moderator.
CONCLUSION AND IMPLICATION
This work defines the connotation of agricultural listed companies based on the integration of modern agriculture, including animal husbandry and fishery analysis followed by four broad categories of three years’ 244 samples of knowledgeable senior management incumbency, and the use of financial reporting data on the study executives, firm R&D intensity, impact of R&D intensity on the enterprise productivity. The following conclusions are given: There is (1) technology executives will significantly increase R&D intensity, management executives will reduce R&D intensity; when the two types of executives exist, the positive effect is greater than the negative effects; (2) there is a big difference between the current Chinese agricultural listed companies market efficiency; most knowledge-based executives were hired; hiring of management executives for business productivity is significantly positive, hiring technology executives is not statistically significant; (3) the agricultural industry companies and business R&D intensity productivity have a significant negative correlation, probably because research into productivity requires more than a year's cycle, but has not been reflected in this issue.
At the same time as the moderator of the industry, per capita assets, and share properties can be adjusted in the relationship between the two.The following conclusions are given: First, there is reasonable arrangement of senior management structure, and technical or management executives are unevenly distributed; the executives’ synergy can promote enterprise productivity. Secondly, there is a modest increase in business R&D intensity; increased R&D intensity is bound to improve productivity in the current or short-term effects due to the conversion period. This would not be immediately apparent. If the business current R&D intensity is too high, it may affect other aspects of normal business activities. Finally, to increase the implementation of the corporate strategy of vertical integration at the end of the industrial chain enterprises will have more operating profit than its front-end business; if companies can produce, process, market, import and export trade of agricultural products at reduced prices, it would help improve productivity and form core competitiveness.
The authors have not declared any conflict of interests.
Supported by Project of National Natural Science Foundation (71573098 & 71173085); Social Science Foundation for The Excellent Youths of Huazhong Agricultural University; the Fundamental Research Funds for the Central Universities (Program No.52902-0900202876).
REFERENCES
|
Feng Z, Chen W (2013). Source technology innovation and R & D total factor productivity growth. Sci. Manage. Empir. Res. Chin. Reg. LMEs. 03:33-41.
|
|
|
|
Hall BH, Mairesse J (1995). Exploring the relationship between R & D and productivity in French manufacturing firms. J. Economet. 65(1):263-293.
Crossref
|
|
|
|
|
Huangjie Li, Tang Pei, Jiang Zhanhua (2014). Tax incentives under the agricultural R & D investment, risk and return. Empir. Stud. Based Chin. Agric. Listed Comp. Agric. Econ. 02:120-128.
|
|
|
|
|
Jefferson GH, Bai HM, Guan XJ, Yu XY (2006). R & D performance in Chinese industry. Econ. Innov. New Technol. 15(4):345-366.
Crossref
|
|
|
|
|
Li B (2010). Hampering the development of domestic TFP. J. Sci. Res. 07:1035-1042, 1059.
View
|
|
|
|
|
Maode F, Li J, Peng F, Luo ZQ (2013). R & D investment and enterprise TFP - Based on PSM and GPS testing. J. Fin. Econ. 04:134-144.
|
|
|
|
|
Marvel M, Lumpkin G (2007). Technology Entrepreneurs' Human Capital and Its Effects on Innovation Radicalness. Entrep. Theory Pract. 31:6.
Crossref
|
|
|
|
|
Raffaello B, Paolo P (2009). Determinants of Long-run Regional Productivity with Geographical Spillovers: The Role of R & D, Human Capital and Public Infrastructure. Reg. Sci. Urban Econ. 39(2):187-199.
Crossref
|
|
|
|
|
Subrahmanya MHB (2005). Technological innovations in Indian small enterprises: dimensions, intensity and implications. Int. J. Technol. Manage. 30(1-2):188-204.
Crossref
|
|
|
|
|
Wang Y, Chai XK (2012). Research R & D investment, Executive Ownership and Firm Performance - Empirical Evidence from the private high-tech listed companies. J. Zhongnan Univ. Graduate 05:113-119.
|
|
|
|
|
Winne DS, Sels L (2010). Interrelationships between Human Capital, HRM and Innovation in Belgian Start-ups Aiming at an Innovation Strategy. Int. J. Hum. Resour. Manage. 9:21.
Crossref
|
|
|
|
|
Wu YB (2008). Independent research and development, technology transfer and Productivity - Empirical Research on Chinese industrial areas. Econ. Res. 08:51-64.
|
|
|
|
|
Xia L (2010). Division how human capital and R & D Total Factor Productivity - Empirical Analysis Based on China's large and medium industrial enterprises. Number Tech. Econ. 04:78-94.
View
|
|
|
|
|
Yu SL, Wang Y (2014). Vine executives technical background and research and development investment Correlation. Econ. Manage. Res. 05:14-22.
|
|