ABSTRACT
Crop diversification is one of the most important risk management and income enhancing strategies for farmers. The study investigates the pattern, trend, and factors influencing crop diversification in different districts of West Bengal, based on secondary data. The Simpson index has been used to estimate diversification. The results show that all the districts of West Bengal and the state as a whole have exhibited a higher crop diversification during new millennium than the nineties. Both the supply side and demand side variables have been found to influence crop diversification. These variables include rural literacy rate, the percentage of urban population to total population of the district, relative earning from high-value crops (HVC) than cereals, the market density of a particular region, the percentage of small landholders and area under high yielding varieties (HYV) of food grains. The magnitude of rainfall and extension of crop insurance facility also have a significant impact on crop diversification. The government should come forward with suitable policies to encourage crop diversification. These policies may encompass the development of rural infrastructure, enhancement of rural literacy rate, the extension of crop insurance facilities and above all, the development of suitable price policy in favor of high-value crops.
Key words: Crop diversification, Simpson’s index, panel data regression, high-value crop, smallholder.
The agriculture and allied sector continues to be pivotal to the sustainable growth and development of the Indian economy. Not only does it meet the food and nutritional requirements of 1.3 billion Indians, it contributes significantly to production, employment and demand generation through various backward and forward linkages leading to a multiplier impact on the gross domestic product of the economy. Moreover, the role of the agricultural sector in alleviating poverty and in ensuring the sustainable development of the economy is also well established (Government of India, 2017). The sector is, however, currently facing a dilemma. While it has made large strides in achieving the agricultural development goals of food security, availability and accessibility, it is still being challenged by a formidable agrarian crisis in the form of ‘farmer’s welfare/ development’. This situation has recently led to fresh thinking on the developmental approach in the agriculture sector. The need for focusing on the welfare and prosperity of farmers has gained prominence (State of Indian Agriculture 2015-16, Government of India, 2015; Ministry of Agriculture and Farmers Welfare, Government of India, 2016a, b). Indian agriculture is predominantly a small and marginal peasant-based economy with approximately 85% of the operational holdings being below two hectares and at the same time, only 44.58% of the agricultural land is cultivated by them (Agriculture Census 2010-11, Government of India, 2010). Because of small operational holdings, it is indeed very difficult for the small farmers to improve their earnings only by raising the yields of the existing crops, mainly cereals.
However, with the availability of modern farm inputs in the current decades, farmers have a ready option to generate higher levels of income by introducing high value crops commonly known as cash crops in their farming units. Thus, the high-value crops being more labour intensive usually provide stable employment and income to a large section of the rural households who face the severe problem of seasonal unemployment and underemployment under the mono-crop economy (De and Chattopadhyay, 2010). Therefore, diversification from low-value crop to high-value crop at farm level can solve many of the problems faced by small and marginal farmers. In general, diversification is an integral part of the process of structural transformation of an economy (Singh et al., 2006). A deviation from agriculture towards industries and services denotes diversification (across sectors) at the macro level. But there is a lack of clarity when it comes to diversification within a sector itself, and the same holds true also for the agriculture sector. In Indian agriculture, diversification has occurred both between crops and across activities (that is, crop cultivation, livestock raising, forestry, and fishing). Within agriculture, the share of output and employment in the non-crop sectors, i.e. animal husbandry, forestry, and fisheries, has been gradually increasing (Joshi et al., 2004). Thus, significant diversification is taking place in terms of moving away from crop production to other agriculture-allied activities. Simultaneously, similar significant changes are taking place even within the crop sector which is evident from changes in cropping pattern (Singh et al., 2006).
So, to summarize, there are two kinds of diversification at farm level: horizontal diversification and vertical diversification. Horizontal diversification refers to the cultivation/introduction of different kinds of crops that is, minor crops, fruits, and vegetables along with conventional major crops at farm level by farmers. Vertical diversification occurs when farmers engage themselves in different value-added activities at the farm level or adopt some other enterprises that is, livestock, poultry farming and fish farming along with the growth of crops at farm level (Haque, 1996). It needs to be noted here that the incidence of crop diversification in India was very uncommon, particularly before the introduction of new agricultural technology in the mid-sixties. With the advent of new agricultural technology particularly, water-seed-fertilizer technology, a significant change in land allocation towards some high-value cash crops such as fruits and vegetables cultivated is evidenced in India, particularly by the small farmers (De and Chattopadhyay, 2010).Crop diversification as a concept and tool is a strategy to maximize the use of land, water, and other resources and for the overall agricultural development in the country. It provides the farmers with viable options to grow different crops on their land around the year. The diversification in agriculture is also practiced with a view to avoiding risk and uncertainty due to climatic and biological vagaries. It minimizes the adverse effects of the current system of crop specialization and monoculture for better resource use, nutrient recycling, reduction of risks and uncertainty and better soil conditions. It also provides better economic viability with value-added products and improvement of ecology.
Agricultural diversification construed in the sense of change in the cropping pattern towards high-value crops is undoubtedly a major factor contributing towards agricultural development. This is because of two main reasons, first, it has been observed that the impacts of the green revolution in cereals get exhausted after an ‘optimum’ level is reached that is, agricultural growth becomes stagnant. Secondly, the small and the marginal farmers who dominate the agricultural scenario of most of the Indian states, including West Bengal, can generate higher farm income and employment and mitigate risks by adopting a diversified crop portfolio (Vyas, 1996). Based on the aforementioned discussion, it may be argued that the small and marginal farmers, depending on a small piece of land and having no alternative sources of employment and income due to the existence of a vast population of surplus labor in the countryside, would always try to produce the maximum output on the given piece of land. They would also try to cultivate as many crops as possible and choose such high-value crops (for example, boro paddy, oilseeds like rapeseed and mustard, potato, jute, fruits and vegetables), which after meeting their consumption needs, would meet their minimum cash requirements for the maintenance of their daily life. Even the medium and large farmers approach diversification for the improvement of their living standard. Thus the phenomenon of crop diversification in India could be viewed as the survival needs of the farmers, especially of the small and marginal ones. Agricultural diversification is also contributing to employment opportunities in agriculture, increasing incomes and exports.
During the recent decades, the process of diversification has been wide-spread due to the combined effects of water-seed- fertilizer technology as well as some infrastructural development such as market centers, roads, transport etc., in the countryside (Vyas, 1996; Bhalla and Singh, 1997). Agricultural diversification is strongly influenced also by price policy and income of farmers. Rural literacy also has an influence on crop diversification. It has also been observed that rain fed areas have benefited more as a result of agricultural diversification in favour of high-value crops by substituting inferior coarse cereals. In West Bengal, an interesting observation is that a marked diversification of cropping pattern away from food grains has occurred since economic liberalization. The share of cropped area under non-food grains increased substantially over the past two and a half decades. The percentage of acreage of oilseeds, particularly mustard, was nearly doubled during 1980-2006. The area under potato also increased magnificently during the same period. But the share of cropped area under jute declined over this period, although increased in the 1990s (West Bengal Development Report 2014a; Planning commission, Government of India (GOI), 2007). In West Bengal, 95.91% of the operating households belong to the marginal and small category and operating about 80.71% of the total land holding (Government of West Bengal, 2014). Like other states of India, the small farmers of West Bengal have got the high priority to high-value crops like summer paddy, mustard, potato, jute and vegetable (De, 2000). Agriculture in West Bengal has been diversifying gradually also towards high-value crops. West Bengal is one of the leading producers of fruits and vegetables contributing nearly 19.62% to the country’s total production in 2014-2015 (Government of India, 2016a, b).
Objective
The specific objectives of this paper are:
(1) To analyze the pattern and trend of horizontal crop diversification
(2) To find the factors affecting the crop diversification
The study area
The study focuses on 17 major districts of West Bengal during 1990 to 91 to 2013 to 14. These districts differ in terms of gross cropped area, soil fertility, climatic condition such as rainfall, and availability of agricultural inputs. Due to non-availability of disaggregated data for both South and North Dinajpur from 1990-91 to 1995-96, we have considered Dinajpur as a single district in the name of West Dinajpur. The district of Midnapore has been administratively divided after 2005. However, the agricultural division was done in the 90s. So East Midnapore and West Midnapore are considered separately.
Type and sources of data
The secondary data on an area under different crops and major agricultural inputs at the district level and state level for West Bengal have been collected from different issues of “District Statistical Hand Books”. The data on per capita income have been collected from “State Domestic Product and District Domestic Product of West Bengal” published by Bureau of Applied Economics and Statistics, Department of Statistics and Programme Implementation, Government of West Bengal. The post-harvest price data of different crops have been taken from various issues of “Estimates of Area and Production of Principal crops in West Bengal” Evaluation Wing, Directorate of Agriculture, Government of West Bengal.
Determination of crop diversification
There are quite a few methods, which explain either concentration (that is, specialization) or diversification of commodities or activities in a given time and space by a single indicator. Important ones include:
(1) Index of maximum proportion (IMP = Max Pi), where, Pi = Proportion of acreage under crop to total cropped area
(2) Herfindahl index, mathematically, the index is defined as:
Where N = Total number of crops; Pi = Proportion of acreage under

crop to the total cropped area. This index was first used to measure the regional concentration of industries (Theil, 1967). The value of HI is bounded by 0 (perfect diversification) and 1 (complete specialization)
(3) Ogive index is computed in order to get an idea about the extent of crop diversification. OI is given by the formula:

Where = Proportion of acreage under crop to the total cropped area, N = Total number of crops cultivated in the region. OI also takes larger values with increasing diversification and its value decreases with rising specialization. It was first used by Tress (1938) to measure the industrial diversity. Two other indices are also considered as inverse measures of concentration. They are entropy index (EI) and modified entropy index (MEI). These two measures are widely used by agricultural economists for analyzing diversification of agriculture (Singh et al., 1985; Shiyani and Pandya, 1998).
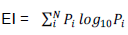
(4) The formula for computing entropy index is:
Where, Pi stands for the proportion of an area under i th crop. The index would increase with an increase in diversification and the upper value of index can exceed ‘one’ when the number of total crops is higher than the value of logarithmic base i.e 10. The value of index approaches Zero when there is complete concentration. When the number of crops is less than the value of logarithmic base, the value of index varies between Zero and One.
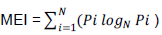
(5) In order to get a more accurate measure, MEI is used, which is defined as:

MEI incorporates the number of crops as the base of the logarithm. The lower and upper value of MEI is 0 (total concentration) and 1 (perfect diversification) and other one is composite entropy index (CEI).
(6) The formula of CEI is given by:

The CEI has two components namely distribution and number of crop, or diversity. The value of composite entropy index increases with the decrease in concentration and rises with the number of crops (Pandey and Sharma, 1996; Chand, 1996). The value of CEI ranges between zero and one.
(7) Another one is Simpson’s index (SID). Simpson’s index, mathematically defined as:
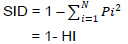

is the proportionate area (or value) of
crop activity in the gross cropped area (or the total value of output). Each method has some limitation and/or superiority over the other. However, the Simpson’s index takes into account both richness (the number of crop species present in a particular area) and evenness (the relative abundance of different crop species) of crops present in a particular area. As crop richness and evenness increase, diversity increases. Thus, the Simpson’s index provides a clear dispersion of crops in a particular area. The Simpson’s index ranges between 0 and 1. If there exists complete specialisation, the index moves towards zero and away from zero implies diversification. The most widely used method for measuring diversity in recent times is Simpson’s index. It is easy to compute and interpret (Joshi et al., 2004). Considering the study objective of assessing the extent of diversity in crop activities, Simpson’s index has been used.
Econometric model for determinants of crop diversification
Panel data regression model
To discern the determinants of crop diversification at the district level, fixed effect model (FEM) with Standard Ordinary Least Squares (OLS) has been used. A balanced panel data set is used which has an equal number of observations for each individual (district). The sample size comprises 408 observations. The regression equation specification has been used to find the association between SID (dependent variable) and technology, infrastructure, relative income, resources - information, demand, and climate (independent variables). The FEM has constant slopes but intercepts differ according to the cross-sectional (district) unit. For i classes, i–1 dummy variables are used to designating a particular districts. It allows for heterogeneity or individuality among districts (units) as each district is allowed to have its own intercept value. So, intercepts may differ across districts but they do not differ over time.
Fixed effect models
To take into account the individuality of each district (cross-sectional unit), intercept is varied by using dummy variable for fixed effects. Fixed effect models for panel data (intercept or individual) can be represented by Equation:

SID = Simpson index of diversification, TECH = technology, INFR = infrastructure, KNOW = resources and information, DEMA= demand, RAIN = climate, INCM = relative income, u =Stochastic error-term.
To know the factors influencing the shift in cropping pattern, the following variables considered as the explanatory variables (independent variable) were broadly grouped into:
(1) Technology (TECH) related
(2) Infrastructure (INFR) related
(3) Resources and information (KNOW) related
(4) Demand (DEMA) side
(5) Climate (RAIN) related, and
(6) Relative income (INCM) related.
To capture their effect, few proxy variables were used in the model. Technology (TECH) included, proportionate area under high yielding varieties of food grain crops (percent), fertilizer use (kg per ha), proportion of gross irrigated area to gross cultivated area (per cent). For infrastructure (INFR), the proxy variables were market density (number of markets per 1000 ha of gross cropped area), and roads length (square km per 1,000 ha of gross cropped area). Relative revenue of high-value enterprises with cereals and other crops was the proxy for income (INCM) related variables. The average size of landholding (ha) and proportion of small landholder in total holdings used the proxy for available resources and rural literacy (percent) for information (KNOW) related variables. On demand-side (DEMA) variables, urbanization (percentage of urban population) and per capita income (rupees per person) were used in the model. Annual rainfall (mm) was used to define the climate (RAIN) related variable in the model.
Trend and pattern of crop diversification
The district-wise crop diversification indexes of West Bengal for different decades are presented in Table 1. The successively increasing value of Simpson’s index (SI) indicates an increased level of diversification. The falling value of the index on the other hand, indicates increasing specialization. The calculated Simpson’s indices for different districts as well as for the whole state of West Bengal registered higher value for the period starting from 2000 as compared to the previous decade. Among the different districts of West Bengal considered in this study, the value of Simpson’s index is the highest in Nadia followed by Murshidabad in all the sub-periods. This indicates that Nadia showed the highest crop diversification followed by Murshidabad in all the sub-periods under study. Malda is an important district in terms of crop diversification consistently showing high value of Simpson’s index. North 24 Parganas, Coochbihar and Hoogly also have a high value of Simpson’s index. Burdwan is agriculturally the most developed district in West Bengal, but the speed of crop diversification is not very high in this district. The magnitude of crop diversification indices of Burdwan, Birbhum (except sub-Period I), Howrah, East Midnapore and West Midnapore are more or less the same in all the sub-period under analysis.
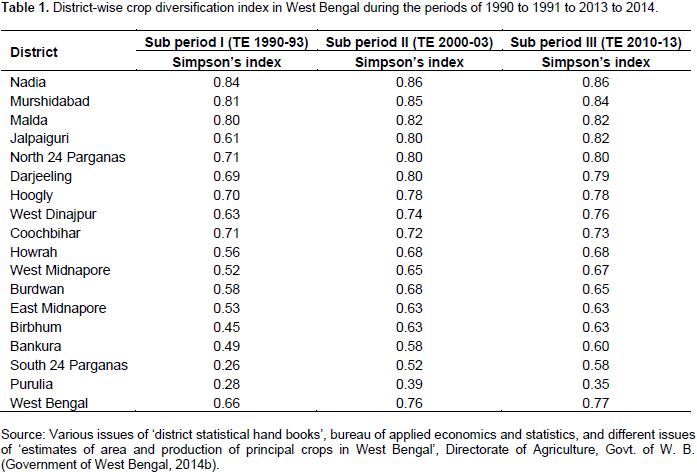
The value of Simpson’s index in Purulia is always less than 0.40 meaning that there is no tendency of crop diversification. In South 24 Parganas and Bankura, the magnitudes of crop diversification indices are also low. During sub-Period I, South 24 Parganas showed the lowest value of Simpson’s index followed by Purulia. The speed of diversification is quite worth mentioning in Jalpaiguri, Darjeeling and West Dinajpur (Table 1). In Jalpaiguri, the magnitude of crop diversification index was 0.61 in sub-Period I but the value increased to 0.80 and 0.82 in the following two sub-periods. Darjeeling shows the same pattern of diversifying tendency with the value of diversification index being 0.69, 0.80, and 0.79 during the three sub-periods respectively. In West Dinajpur, the magnitude of diversification index was 0.63 in sub-period I. This value changed into 0.74 and 0.76 respectively in next two sub-periods. The state of West Bengal as a whole indicates diversifying tendency in crop cultivation with the value of Simpson’s index being 0.66, 0.76, and 0.77 in three consecutive sub-periods under study. The result obtained from the study indicates towards a very interesting fact. Out of 17 districts under analysis, 7 districts have always exhibited a higher value of crop diversification index compared to the state as a whole.
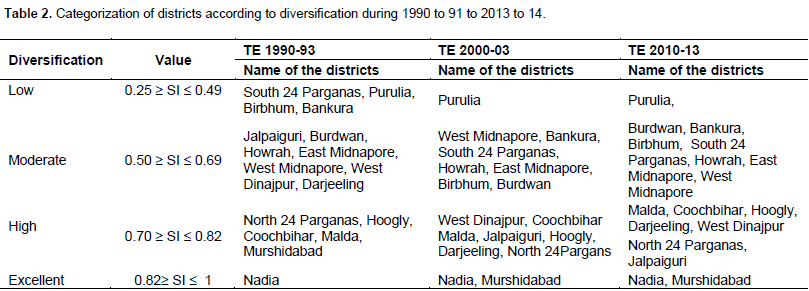
On the contrary, 10 districts always had crop diversification indices lower than the state figure. While the districts of Nadia, Murshidabad and Malda have always remained within top five. Purulia, Birbhum, Bankura and South 24 Paraganas were in the category of bottom five districts in terms of diversification of crops. The district-wise values of other indices like ‘Herfindahl, Entropy, and Ogive’ also show a similar pattern for all the chosen sub-periods (Appendix Table 1). On the basis of the magnitude of Simpson index, we categorize the districts in four groups’ namely low, moderate, high and excellent which are presented in Table 2. Nadia always belonged to the excellent group in terms of diversification while Purulia remained in a low category throughout the period under study. South 24 Parganas, Bankura and Birbhum remained in the low category in sub-period I but shifted to the moderate group in the subsequent two sub-periods. This implies that Bankura, Birbhum and South 24 Parganas have slowly attempted crop diversification. Similarly, Murshidabad has shifted from the category of high diversification in sub-period I to the excellent category in the following two sub-periods. Darjeeling, Jalpaiguri, and West Dinajpur are in the moderate category of diversification in sub-period I but interestingly moved up to the high category of diversification in the successive two sub-periods. Districts like Malda, Coochbihar, Hoogly, and North 24 Parganas always fell in the category of high level of diversification. Burdwan, Howrah, East Midnapore and West Midnapore always remained moderately diversified.
Determinants of crop diversification
Crop diversification is influenced by a number of factors both in the supply-side (infrastructure development, technology adoption, relative income, resource endowments) and the demand-side (size of urban population and per capita income) as well as a climatic variable (rainfall). The study has also used dummy variable to analyze the influence of crop insurance on crop diversification. This section examines the factors influencing diversification in favor of high-value crops. Multiple regression analysis has been carried out using the time series panel data for the period 1990-91 to 2013-14 to identify the important factors affecting crop diversification (Joshi et al., 2004). Both linear and non-linear (log form) multiple regression functions have been attempted in the study. The one, which provided good fit has been considered. The estimated linear equations of Ordinary Least Square are given in Table 3. In the course of analysis, the variables that are statistically insignificant have been dropped step by step.
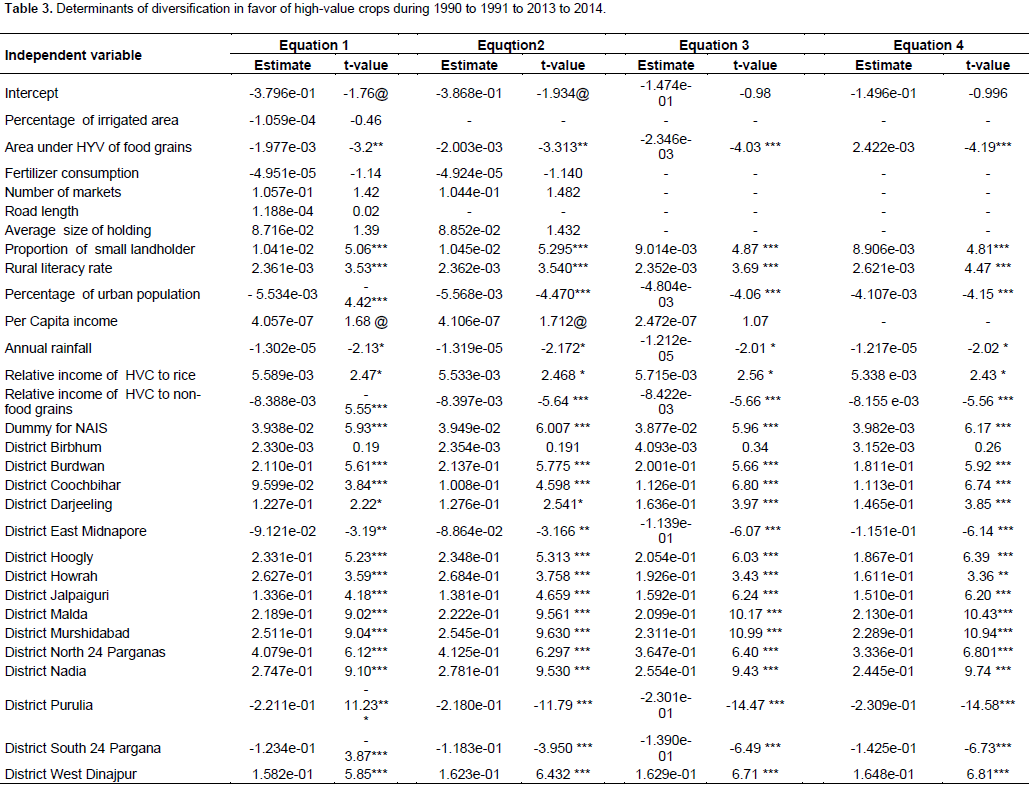
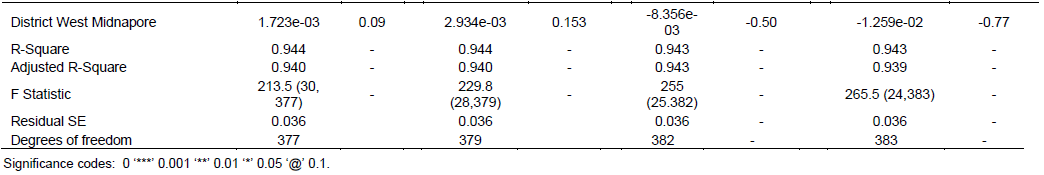
The technology is defined by the use of fertilizer, the percentage of irrigated area and proportionate area under HYV of food grains. The regression coefficient of these variables showed a negative relationship with crop diversification towards high-value crops in West Bengal. However, out of these three determinants, only the area under HYV for food grains is significant for diversification. This means if there is an increase in availability of HYV for foodgrains then the farmers concentrate on food crops production. This in other words, implies that crop diversification in favor of high-value non-food grain crops declines with the increasing in area under HYV of food crops. The resource and information related variables are average size of landholding, proportion of small landholder in total holdings and rural literacy rate. There is a positive and significant relationship between crop diversification and the proportion of small holders. This indicates that diversification in favor of high value crops has been practiced mostly by small holders. Such a move of small farm holders in favor of high-value crops is expected to enhance their income. High value crops are mostly labor intensive, which favour small farmers and generate regular flow of income and employment. Rural literacy also yielded a positive and significant influence on crop diversification in favor of high value crop. Education helps the farmers in taking conscientious decisions and enables them in accessing several facilities which are required for crop diversification. If farmers are more educated, their decision for sowing a particular crop would be governed by the sound economic estimates of costs and benefits of that crop.
The sign of regression coefficient of average size of holding is not statistically significant but positive. This means that the larger the operated area the higher will be the extent of crop diversification. Farmers operating on a bigger piece of land have a wider choice and options for cultivating diversified crops compared to the farmers having a small piece of land. To capture the effect of infrastructure development on diversification, two important variables, namely, the number of markets and road length has been included in the model. Both the variables yielded positive influence on diversification of high-value crop though they are not statistically significant. Obviously, better markets and road network induce diversification in favor of high-value crop like jute, potato, oilseeds, and vegetables. Improved market and road network means low marketing cost and easy and quick disposal of commodities. It also reduces the risk of post-harvest losses in case of perishable commodities (Joshi et al., 2004).Similarly, the demand-side factors such as the size of the urban population have shown a negative and significant impact on crop diversification towards HVCs. The crop diversification towards HVCs declines with the increase in urban population. When the process of urbanization begins farmers concentrate towards the production of wheat, rice, and other food crops to fulfill the basic needs of urban peoples. Another demand-side variable namely per-capita income has a positive impact on crop diversification towards high-value crops. With the rise in per capita income, people spend more on high-value crops like vegetables, potato, oilseeds, and jute etc., in addition to food crops. But this result is not statistically significant.
Rainfall is another variable considered in the model to assess the impact of climate on crop diversification. The variable is highly significant with a negative sign, indicating that the crop diversification is limited in areas with higher rainfall. The farmers in these areas naturally prefer cultivating rice, and it was only in the medium and low rainfall areas that farmers want to diversify to increase their income and minimize risk. The regression coefficient of relative income of high value crops with respect to rice (dominant crop in West Bengal) is positive and significant. This means that if farmers cultivate any other high-value crop instead of rice in the same piece of land they would earn the higher income. However, the coefficient of relative income of high-value crops with respect to other non-food grains shows the significantly negative effect on crop diversification. A dummy variable has been used for NAIS (National Agricultural Insurance Scheme) which has a positive and significant effect on crop diversification. The crop insurance can motivate a farmer to cultivate more diversified crops, including high-value crops for which profitability is very high. Crop Insurance mitigates the risk of crop failure to farmers. Among the coefficients of district dummy, Bankura, Purulia, South 24 Parganas and East Midnapore have shown significantly negative results. These results exhibit diversification against high-value crops. All the others districts have shown diversification towards high-value crops. However, for Birbhum and West Midnapore these results are statistically insignificant.
CONCLUSION AND RECOMMENDATIONS
The study revealed that the crop sector in the West Bengal, in general, has been diversifying towards high-value crops from the traditional ones. However, there are considerable variations in terms of intensity of the diversification across the districts. Few districts such as Purulia, South 24 Parganas, East Midnapore, Birbhum and West Midnapore show no tendency towards crop diversification. The rest of the state, however, moves strongly towards the cultivation of high value crops. The regression results have brought out the importance of area under HYV of food grains, rural literacy, the proportion of a small landholder, size of the urban population, crop insurance, and relative income of high value crops over rice as the significant determinants of crop diversification, besides the agro-climatic factor like rainfall.
(1) The high-value crops have a significant comparative advantage over staple food crops as they are prone to higher production. With the higher production of HVC the risks – both crop risk and price risk- increase. Therefore, the crop insurance for all farmers should be encouraged to
mitigate the crop risk. The promotion of agribusinesses holds the key for reducing the price risk.
(2) The present day agriculture is much more knowledge-intensive and skill-based. The adequately trained human resources is the need of the hour in agricultural sector. Therefore, the provision of training and skill-formation should be arranged on a larger scale for the agriculturalists.
(3) Infrastructural facilities like the markets and roads play a positive role in promoting diversification in agriculture. It calls for increased public investment in the development of infrastructure to accelerate the pace of diversification.
This is an original work and the authors have not received any grant from any institution to undertake this research.
REFERENCES
|
Acharya SP, Basavaraja H, Kumar LB, Mahajanashetti SB, Bhat Anil RS (2011). Crop diversification in Karnataka: An economic analysis. Agric. Econ. Res. Rev. 24:351-357.
|
|
|
|
Bhalla GS, Singh G (1997). Recent Development of Indian Agriculture: A State Level Analysis. Econ. Polit. Wkly. 32(13):A2-A18.
|
|
|
|
|
Chand Ramesh (1996). Diversification through High-Value Crops in Western Himalayan Region: Evidence from Himachal Pradesh. Indian Journal of Agricultural Economics, 41(4): 652-63.
|
|
|
|
|
Chand R, Raju SS, Pandey LM (2008). Progress and Potential of Horticulture in India. Indian J. Agric. Econ. 63:3.
|
|
|
|
|
Chatterjee S, Goswami R, Bandyopadhyay P (2015). Methodology of Identification and Characterization of Farming Systems in Irrigated Agriculture: Case Study in West Bengal State of India. J. Agric. Sci. Technol. 17:1127-1140.
|
|
|
|
|
De UK (2000). Diversification of Crop in West Bengal: A Spatio-Temporal Analysis. Artha Vijnana 42(2):170-182.
Crossref
|
|
|
|
|
De UK, Chattopadhyay M (2010). Crop diversification by poor peasants and role of infrastructure: Evidence from West Bengal. J. Dev. Agric. Econ. 2(10):340-350.
|
|
|
|
|
Government of India (GOI) (2007). West Bengal Development Report, Planning commission, Government of India.
View
|
|
|
|
|
Government of India (GOI) (2010). West Bengal Development Report. Planning Commission, Government of India, New Delhi, Published by Academic Foundation, New Delhi.
View
|
|
|
|
|
Government of India (GOI) (2015). Agricultural Census 2010-11. Department of Agriculture, Cooperation & Farmers Welfare, Ministry of Agriculture, Government of India.
View
|
|
|
|
|
Government of India (GOI) (2016a).State of Indian Agriculture 2015-2016. Ministry of Agriculture & Farmers Welfare, Government of India.
|
|
|
|
|
Government of India (GOI) (2016b). Horticulture: Statistical Year Book India 2016, Ministry of Statistical & Programme Implementations, Government of India.
|
|
|
|
|
Government of India (GOI) (2017). Stakeholders Consultation Meeting cum Exhibition on Technology & Innovation in Agricultural & Allied Sectors. ASSOCHAM India, Department of Science and technology, Government of India, MNIT, Jaipur, Rajasthan. India.
View.
|
|
|
|
|
Government of West Bengal (2014). Agricultural Census West Bengal 2010-11. Evaluation Wing, Directorate of Agriculture & Land and Land Reform Department, Government of West Bengal.
|
|
|
|
|
Govt. of West Bengal (2014a). District Statistical Hand Books. Bureau of Applied Economics and Statistics, Government of West Bengal, Various issues (1990-91 to 2013-14).
|
|
|
|
|
Govt. of West Bengal (2014b). Estimates of Area & Production of Principal Crops in West Bengal. Evaluation Wing, Directorate of Agriculture, Government of West Bengal, Various issues (1990-91 to 2013-14).
|
|
|
|
|
Haque T (1996). Diversification of small farms in India: Problems and Prospects. Ed: T. Haque. National Centre for Agriculture Economics and Policy Research, New Delhi.
|
|
|
|
|
Joshi PK, Ashok G, Bertha PS, Tiwari L (2004). Agricultural Diversification in South Asia: Patterns Determinants and Policy Implication. Econ. Polit. Wkly 39:24.
|
|
|
|
|
Pandey VK, Sharma KC (1996). Crop Diversification and Self Sufficiency in Food grains. Indian J. Agric. Econ. 51(4):644-651.
|
|
|
|
|
Shiyani RL, Pandya HR (1998). Diversification of Agriculture in Gujrat: A Spatio-Temporal Analysis. Indian J. Agric. Econ. 53(4):627-639.
|
|
|
|
|
Singh AJ, Jain KK, Sain I (1985). Diversification of Punjab Agriculture: An Econometric Analysis. Indian Journal of Agricultural Econ. 40(3):298-303.
|
|
|
|
|
Singh NP, Kumar R, Singh RP (2006). Diversification of Indian Agriculture: Composition, Determinants and Trade Implications. Agric. Econ. Res. Rev. 19:23-36.
|
|
|
|
|
Theil H (1967). Economics and Information Theory, North Holland.
|
|
|
|
|
Tress RC (1938). Unemployment and the diversification of industry. Manchester School 9 (2):140-152.
Crossref
|
|
|
|
|
Vyas VS (1996). Diversification in Agriculture: Concept, Rationale and Approaches, Indian J. Agric. Econ. 51(4):636-43
|
|


 crop to the total cropped area. This index was first used to measure the regional concentration of industries (Theil, 1967). The value of HI is bounded by 0 (perfect diversification) and 1 (complete specialization)
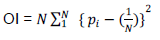


 is the proportionate area (or value) of


