ABSTRACT
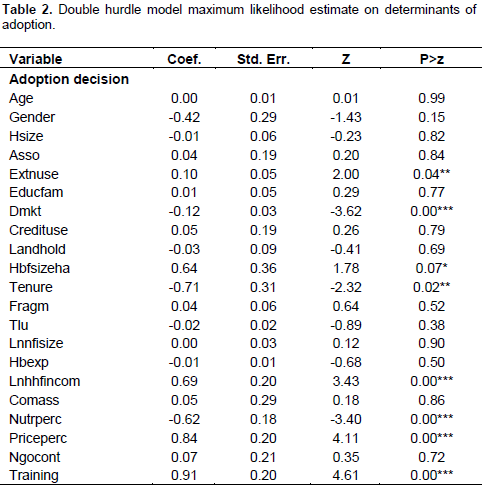
White haricot bean is a major source of food (protein) and income for the rural households of Ethiopia. Nationally, it is among the major pulse crops used for export. Despite its contribution, adoption of white haricot beans variety is very low. With this backdrop, this study analyzed the determinants of the decision to adopt and intensify the adoption of white haricot beans. A sample of 394 farm households were selected randomly proportional to their size in each sampled village. A double hurdle model is used to analyze the data. The findings reveal that the decision to adopt white haricot beans variety is influenced positively by frequency of extension visits, land size allocated to haricot beans, agricultural income, price perception, training obtained and perception on fertility enhancement benefit of the crop, and negatively by distant to market, ownership of haricot beans farm land (tenure) and nutritional perception of the crop. The intensity of adoption of white beans is affected negatively by the number of dependents in the household, ownership of haricot beans land (tenure) and positively by non-farm income and contact with non-governmental organisations (NGOs). The study recommends that appropriate measures should be taken to strengthen the extension services, provision of related trainings, improvement of existing infrastructures, family planning, more involvement of other NGOs (stakeholders) in the area, provision of the required inputs in time and quantity, and measures to reduce risks on output (loss) and market price in order to promote the adoption of white haricot beans in general.
Key words: White haricot beans, technology, decision to adopt, intensity of adoption, double hurdle model.
Pulse crops are the most important source of food in the national diet of Ethiopia next to cereals. Nationally, pulses occupied 14% of the cultivated land yielding 2.86 million metric tons (11.4% of the total grain crop production) in 2013/14 meher season (CSA, 2014). Over the years 2006 to 2012, dry beans export value for Ethiopia increased from 20 to 100 million US dollar (FAOSTAT, 2015). Among pulses (dry beans), common (haricot) bean ranks third contributing about 9.5% of the total export value from agriculture in Ethiopia (FAOSTAT, 2010). Despite its contribution, adoption of white haricot beans is very low. Apart from climbing haricot beans that grow in western Ethiopian highlands and Metekel zone, haricot bean crop particularly grows (concentrated) in south-western (Wolayita and Sidama), rift valley (north-eastern) region, western lowland areas and eastern Hararghe zone of Ethiopia in sole and intercropped (widely) with maize and sorghum. Oromia region, especially east Shewa zone in the rift valley area is the major producer of white haricot beans, followed by Southern Nations, Nationalities and Peoples’ Region (SNNPR) and Afar Region; the first two regions constituting nearly 85% of the total production (Setegn et al., 2010; Ferris and Kaganzi, 2008).
In Ethiopia, despite improvements over the past decade, about 46% of the population is undernourished, underscoring the importance of increasing domestic food productivity (WFP, 2013). The key constraints of agricultural productivity in Ethiopia include drought, a decline in soil fertility, poor linkage of input and output markets, low technology adoption rate (improved seeds, fertilizer, irrigation and modern agronomic practices), poor infrastructure (storage, processing, packaging and transportation) and market access, prevalence of pests and diseases, and low capacity and in-efficient governmental and private sector institutional services (Katungi et al., 2010; Dercon and Hill, 2009; Diao and Pratt, 2007; Odendo et al., 2004). In relation to haricot beans, constraints on access to high yielding variety (due to higher seed price, poor quality, older and degenerated varieties), drought, poor soil fertility, poor linkage of input-output markets, and loss due to pests and diseases are the key causes of low productivity (Katungi et al., 2010; Fekadu, 2007). A number of interventions have been identified and implemented to address some of the challenges that hamper haricot bean production in Ethiopia.
The interventions included investment in the dissemination and promotion of existing technologies, improvement of infrastructures, strengthening market information, and informal seed systems, development and promotion of drought resistant varieties, and integrated soil and fertility management practices. For instance, in the rift valley region of Ethiopia, between 2004 to 2010, access to seeds on market demanded varieties has been increased from less than 20 to 60% across major beans growing areas by different actors (Katungi et al., 2010). Although substantial amount of resources have been devoted to the development and provision of the required inputs over the past three decades, overall adoption rate of agricultural technologies has been lower for sub-Saharan countries, as compared to other parts of the world (World Development Report, 2008). In Ethiopia, evidences indicate that the adoption rate of modern farm technologies including improved seeds is low. For example, at national level, the proportion of farm land area under different technologies such as fertilizer use, improved seeds, pesticides and irrigation in the belg season (2014) is 42, 5, 10 and 8%, respectively (CSA, 2014). In light of this, this study was intended to analyze factors affecting the status and intensity of adoption of white haricot beans in the study area.
Study area
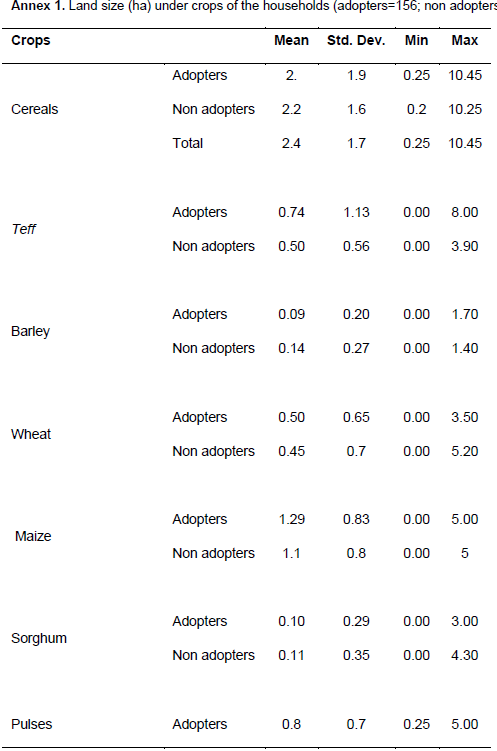
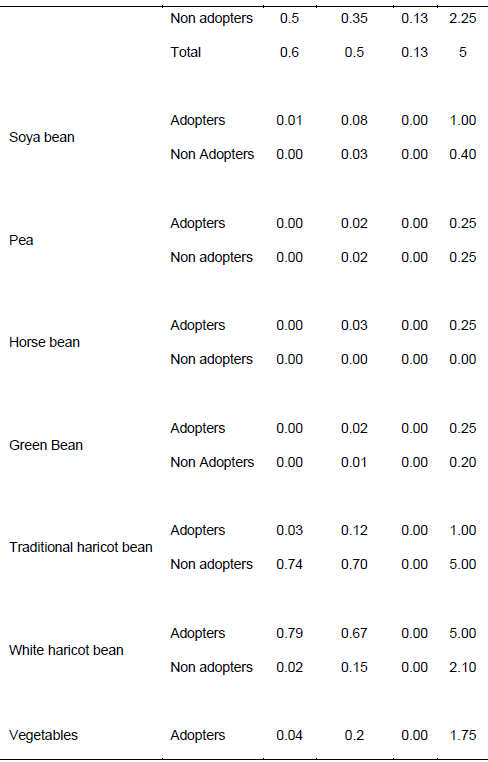
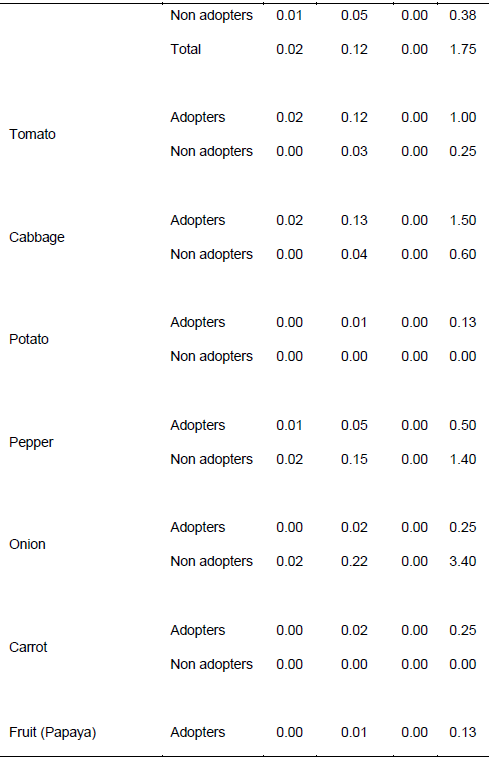
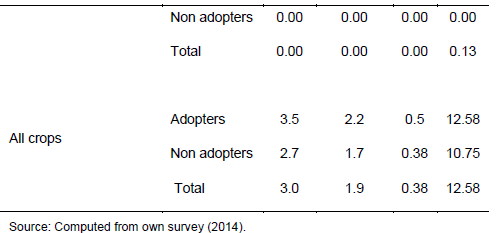
The study area (east Shewa zone) is one of the administrative zones of Oromia Regional State. It is located in the south eastern part of Ethiopia. It extends between 7033’50’’N-9008’56’’N and 38024’10’’E-400 05’34’’E. It has a total area of 10,241 square kilometer and population of 1,208,825 with population density of 118 persons per km square. The average farm land holding size of the zone is about 1.5 ha per household which is relatively larger compared to the regional average of 1.0 ha per household (CSA, 2014). The zone covers about 8% of the cultivated area in Oromia region (CSA, 2014). Major crops grown in the area include cereals (teff, barley, wheat, maize and sorghum), pulses (soya bean, pea, green bean, horse bean and haricot (white and non white) beans, and vegetables and fruits (tomato, cabbage, potato, pepper, onion, carrot and papaya). The sizes (average) of crop land under cereals, pulses (including haricot beans), fruits and vegetables are provided in Annex 1.
Sample design and data source
Multi-stage sampling technique was used in selecting the units at different stages. The first stage involved a random sampling of three districts (27%) from 11haricot beans producing districts of east Shewa zone. The second stage involved a random sampling of three haricot bean producer farmer associations (villages) from each districts (a total of nine villages). Following the selection of villages, a random selection of adopters and non-adopters using Probability Proportional to Size (PPS) is made from each farmer association. Accordingly, the number of sample adopter and non-adopter farm households was 156 (one hundred fifty six) and 238 (two hundred thirty eight), respectively. Primary data of both qualitative and quantitative information were collected using a pretested questionnaire.
Model specification
According to Rogers (2003), “a technology is a design for instrumental action that reduces the uncertainty in cause-effect relationships involved in achieving a desired outcome”. He goes on defining an innovation “as a thought, practice, or project that is perceived as new by an individual or other unit of adoption”. Further, innovation can be categorized into yield increasing, cost reducing, quality enhancing, risk reducing, environmental protection increasing, and shelf-life enhancing (Sunding and Zilberman, 2000). According to Feder et al. (1985), final adoption at the farmer’s level is defined as the long-run degree of use of new technology given that the farmer has full information pertaining to the technology and its’ potential uses. Technology adoption is a mental process through which an individual passes from first knowledge of an innovation to the decision to adopt or reject, and to confirm this decision (Ban and Hawkins, 1996).
Adoption refers to the decision to use a new technology, method, practice, etc. by a firm, a farmer or a consumer. Farm level (household) adoption reflects a farmer’s decision to incorporate a new technology into the production process. On the other hand, aggregate adoption is the process of spreading or diffusion of a new technology within a region or population. Therefore, a distinction exists between adoption at the individual farm level and aggregate adoption, within a targeted region or within a given geographical area (Feder et al., 1985) The rate of adoption is defined as the proportion of farmers who have adopted a new technology. The extent of adoption is the percentage of farmers using a technology at a specific point in time (for example, the percentage of farmers using high yielding varieties).
Based on Feder et al. (1985), definition of technology adoption (that is, for divisible technologies at farm household level), and the intensity of adoption of new high yielding variety is defined as the proportion (degree) of land allotted to the new technology (that is, from the total farm land size decided aprori) for this particular crop.
The concept of adopters is meant for those farm households that produce any of or at least one of the export type high yielding white haricot beans varieties during the survey year, and at least two years before. The time limit is based on a study by Reilly and
Schimmelpfennig (1999) that the adoption of a new variety of crop could take between 3 and 14 years. Intensity (degree) of adoption was measured in terms of the number of hectares covered by export type high yielding white haricot beans at farm household level. Farmers adopt a given new technology if the utility (satisfaction) they derive in any form is higher than the local technology at hand. In modeling the satisfaction or utility derived from using the new varieties, the economic values or benefits associated with the high yielding variety over the traditional varieties needs to be considered. When confronted with a choice between two alternative practices, the i
th farmer compares the expected utility of the modern technology E
mi (W) to the expected utility of the traditional technology E
ti (W).
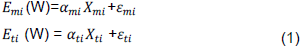
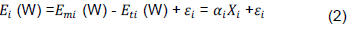
Since the direct measurement of farmers' perceptions and risk attitudes on this particular technology are not available, inferences can be made for variables that influence the distribution and expected utility of the technology under long-run equilibrium (when the households have full information). These variables are used as a vector ‘X’s (attributes) of the choices made by farmer 'i', and εi is a random disturbance that arises from unobserved variation in preferences, attributes of the alternatives, and errors in optimization. Given the usual discrete choice analysis and limiting the amount of non-linearity in the likelihood function, Emi (W) and Eti (W) may be written as:
The difference in expected utility may be written as:
Factors affecting the adoption of a farm technology has been widely analyzed using the Heckman (1979) and Tobin (1958) models. Heckman (1979) model is used with the assumption of selection bias in the process of adoption. Tobin (1958) model is the most widely used. The prime assumption for a Tobin (1958) specification is that farmers demanding modern technologies have unconstrained access to the technology. Studies show that underdeveloped input supply and marketing systems play on input choices and technology adoption in the case of smallholder agriculture (Asfawu et al., 2011; Shiferawu et al., 2008). In situations where the input supply systems are undeveloped, farmers often face input access constraints. Tobin (1958) model does not distinguish households with a constrained positive demand for new technology from those with unconstrained positive demand and hence, assumes that a non adopter household is a rational decision maker. As a result, the Tobin (1958) model yields inconsistent parameter estimates in the situations of access constraints to get inputs (Croppenstedt et al., 2003).
The double hurdle model originally proposed by Cragg (1971) in addition to its assumption that the two decision tiers are not necessarily affected by the same set of factors, is a remedy to the problem of corner solution arising in the Tobit model, and has been extensively in use in several studies (Mignouna et al., 2011; Yu and Ninpratt, 2014; Martínez-Espiñeira, 2006; Moffat, 2003; Newman et al., 2001; Burton et al., 1996). The first hurdle is to decide to be a potential adopter, while the second hurdle is how much (intensity) to adopt. The advantage with this approach is that it allows us to understand the characteristics of a class of households that adopted the technology, households wanting to adopt but reporting no positive use (due to access constraint) and households that have never adopted the technology (Yu and Nin-Pratt, 2014; Mignouna et al., 2011). However, it has not widely been used in the area of adoption of agricultural technologies with some exceptions (Yu and Nin-Pratt, 2014; Sosina et al., 2014; Asfawu et al., 2011; Berhanu and Siwnton, 2003).
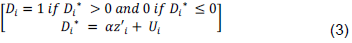
This study used a double hurdle model assuming that factors that affect farmers’ choice of adoption are not necessarily the same to the factors that affect the intensity of adoption. The adoption of export type white haricot beans variety is constrained by access to input (shortage and quality of the white High yielding variety, HYV) by the farm households (Katungi et al., 2010). The farm households need to cross two hurdles to adopt the white haricot beans high yielding variety. A double hurdle model consists of two separate stochastic processes that determine the decision to adopt, and the intensity (degree) of use of a technology. The first hurdle is an adoption decision equation with a probit model. The model has an adoption (D) decision with an equation:
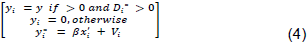
being a latent variable that takes the value 1 if a farmer adopts the improved haricot beans technology and zero otherwise, z is a vector of household characteristics and is a vector of parameters. The level of adoption ( ) has an equation of the following:
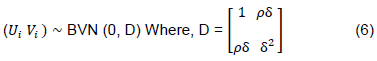
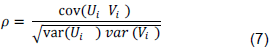
Where, is the observed level (proportion) of white high yielding haricot beans variety, x is a vector of individual household characteristics and is a vector of parameters. If the independence model works, the error terms and are distributed as follows:
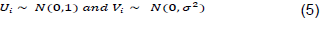
If both decisions are made jointly (the dependent double hurdle), the error term can be defined as:
The model is termed as a dependent model if there is a relationship between the decision to adopt and the intensity of adoption. This relationship can be expressed as follows:
If = 0 and there is dominance (the zeros are only associated to non-participation, not standard corner solutions) then the model decomposes into a probit for participation and standard ordinary least square (OLS) for intensity of adoption. Based on Craggs (1971) proposal, the following equation integrates the probit model to determine the probability of and the truncated normal model for given positive values of y.
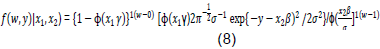
Where is a binary indicator equal to 1 if y is positive and 0, otherwise. In Cragg (1971) model, the probability of y >0 and the value of y, given y>0, are determined by different mechanisms (the vector γ and β, respectively). Furthermore, there are no restrictions on the elements of and , implying that each decision may even be determined by a different vector of explanatory variables altogether. Also, the Tobin (1958) model is nested within Cragg (1971) alternative because if = and , the models become identical (Wooldridge, 2002). Fitting Cragg (1971) alternative requires the additional assumption of conditional independence for the latent variable’s distribution, or:
Demographic characteristics of the farm households
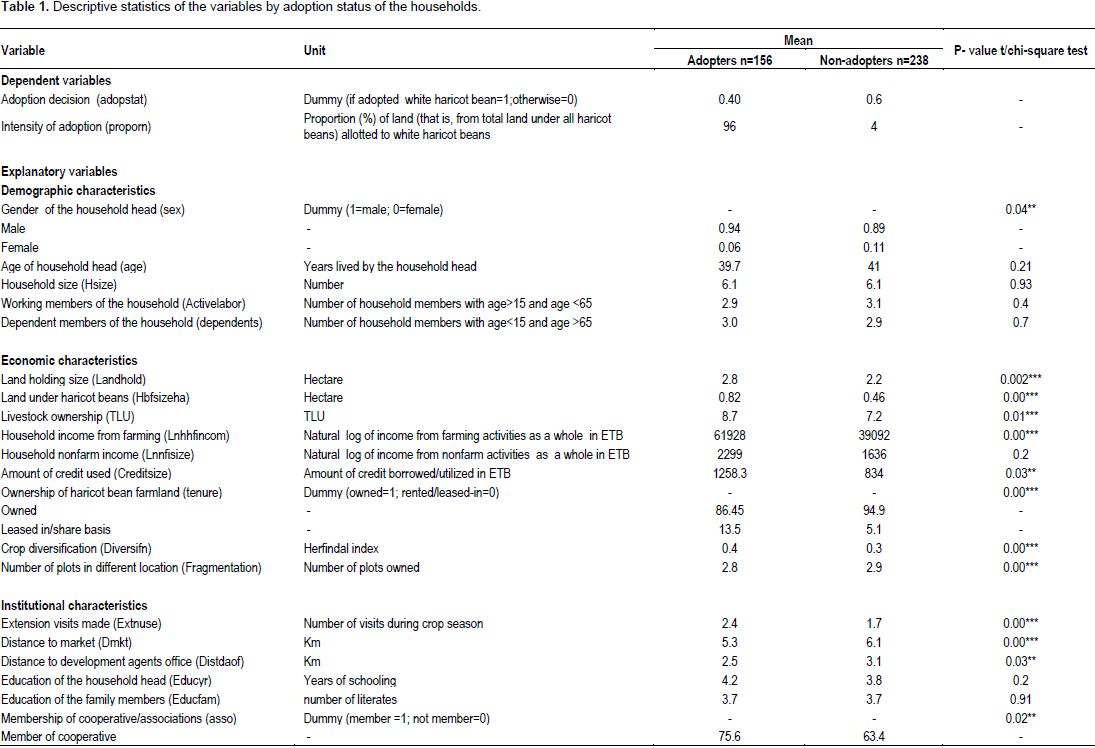
91% of the sampled households in the study area are male headed, while the remaining 9% are female headed. Of the total 394 sample farmers, 156 are (one hundred fifty six) white haricot bean variety adopter farmers, of which 94 and 6% are male and female headed farm households, respectively. Within the remaining 234 (two hundred thirty eight) non adopters of white haricot bean variety, male and female headed farm households constitute 89 and 11%, respectively. There is a significant (5% level of significance) difference between the two groups of adopters and non adopters in terms of sex of the households (Table 1). Average age of the farm households in the study area is 40 years with minimum age of 21 and maximum of 75 years. The average age of the adopter farm households is about 40 years, whereas, that of the non adopters is 41 years. The result depicts that the farm households are in active working age category on average. The t-test statistics showed that there is no significant difference in terms of ages between adopters and non adopter farm households. The farm households have six family members on average. The average household size is slightly greater than the zonal (East Shewa) average of 5.04, regional average of 5.36 and national average of 5.04 (CSA, 2014). As revealed by the t-test, the average family size did not show variation among the groups of adopters and non adopter farm households.
Economic characteristics of the farm households
The average land holding size of the farm households in the study area is 2.4 hectare with average of 2.79 ha for adopters, and 2.21 hectare for non adopter groups. The group test statistic shows that there is a significant (1% level of significance) difference in terms of land holding size between the two groups (Table 1). Similarly, the average farm size under haricot beans is 0.60 hectare with the average of 0.82 hectares for adopters, and 0.46 hectares for non adopter groups. Similarly, the test statistic between adopters and non adopters reveal a significant (1% level of significance) difference among the groups in terms of land allotted to haricot beans cultivation.
The farm households have earned an average gross income of 50,510 (fifty thousand five hundred ten) birr from farming (that is, from crop sector, livestock, horticulture and other sectors such as forestry and beekeeping) during the year under study. Adopter farm households and non adopter farmers have earned about 61,927.00 (sixty one thousand nine hundred twenty seven) and 39,092 (thirty nine thousand ninety two) birr from farming in the same year respectively. Similarly, gross farm income of adopters is significantly (1% level of significance) higher than that of the non adopter farmers.
The gross non farm income of the farmers is about 1,967.00 (one thousand nine hundred sixty seven) birr on average. Similarly, the adopter farm households has earned better nonfarm income of 2,299 (two thousand two hundred ninety nine) birr as compared to the non adopter farm household’s nonfarm income of 1,636.00 (one thousand six hundred thirty six) birr during the year, but not significant. Existing land tenure (that is, possession for haricot beans farm) system in the area could be categorized as owned, leased-in and share cropping system. About 91% of the crop farms were owned, while the remaining 9% were either leased in and/or cultivated on sharecropping basis. There is a significant difference among the group of adopters and non adopters in terms of proportion of land tenure (ownership) system. The average number of plots in different locations (fragmentation) for the farm households was three. There is a significant (1% level of significance) difference in mean fragmentation among the adopter and non adopter farm households (Table 1).
Major haricot beans varieties (types) widely cultivated in the study area include Awash-I, Awash Melkasa-II, red haricot beans, stripe color and black haricot beans. The frequency distribution of farmers by haricot bean types cultivated is given in Annex 4. Of the total farm households interviewed, about 30% of the famers cultivated Awash-I, 7% Awash-II, 57% red haricot beans, and 2% stripe (mixed) color haricot beans. When compared by adoption status, 30, 7 , 2 and 1% of the adopter farmers cultivated Awash-I variety, Awash Melkasa-II, mixture of Awash-I and Awash Melkasa-II, and Awash-I and red haricot beans respectively; while 58, 2 and 1% of the non adopter farmers cultivated the red haricot beans, mixed color; and red and awash-I varieties, respectively.
Institutional and infrastructural characteristics
The farm household heads had 4 years of education on average with a minimum of zero and maximum of 13 years of schooling. The group of white haricot beans variety adopter farm households has about 4.2 years of education (with minimum of zero and maximum of 13 years) whereas; it is 3.78 years of schooling for the non adopter farm households with minimum of zero and maximum of 15 years (Table 1). There is no significant difference in years of education between adopter and non adopter farm households. Similarly, in terms of the number of literates in their family, the farm households have about 4 literate family members on average with minimum of zero, and maximum of 16 members. The number of literate family members is nearly similar for adopter and non adopter farm households (that is, equal to 4) on average. The test statistic revealed that there is no significant difference in terms of number of literate family members between adopter and non adopter farm households.
The average extension visits (frequency) by the development agents to the farm household was 2 during the production year. The record is significantly (1% level of significance) higher for adopter farm households as compared to the non adopter farm households (Table 1). The average distance of the farm households from the market is 5.7 kilometers (km) with a minimum distance of 0.25km, and maximum of 18 kilometers. The average distance from the market is about 5.3 and 6.1km for adopter and non adopter farm households respectively. Similarly, the distance of the farm households’ residence from the development agents’ office is about 2.8 km on average with minimum distance of 0.01 km, and maximum of 16 km. It is 2.5 and 3.1 km for adopter and non adopter farm households respectively. Both distances from the market (at 1% level of significance) and distance from the development agent’s office (5% level of significance) of the farm households are significantly shorter for adopter farm households compared to the non adopter farm households.
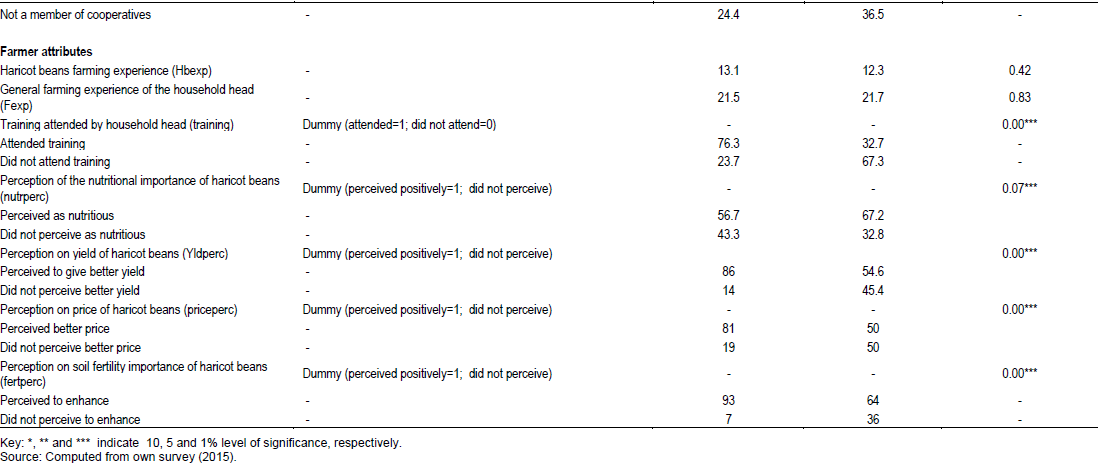
About 50% of the farm households have attended training on haricot beans production and related subjects on average; where the adopter farm households has the largest share (77%) compared to 33% for non adopter farm households. There is a significant (at 1% level of significance) difference among the two groups in terms of proportion of training attended. 68% of farm household heads were members of cooperative association; while the remaining 32% were non members. There is a significant (at 5% level of significance) difference in terms of proportion of membership in agricultural cooperatives among the group of adopters and non adopters.
Farm households’ attributes
The overall experience of the farm households in farming is about 22 years in general; while the average years of experience in haricot beans farming in particular was 13 years. The average number of years on haricot beans farming is higher for the adopter (13 years) than non adopter (12 years) farm households (Table 1). There is no significant difference between the two groups of adopters and non adopters of white haricot beans in terms of farming experience. The farm households also expressed their perception on the different attributes of haricot beans crop in relation to its nutritional importance, yield, market price (profit) and land fertility enhancement capacity of the crop (Table 1). About 62% of the farm households perceived that haricot beans is nutritious; the percentage being significantly (at 1% level of significance) higher for the non adopter (67%) farm households compared to the adopter (57%) farmers.
Similarly, about 66% of the farm households perceived better yield from the crop; the perception being significantly (at 1% level of significance) higher for the adopters (86%) compared to the non adopter (55%) farm households. In relation to the market price (profit) of the crop, about 61% of the farm households perceived better price (profit); with a higher percentage of (81%) by the adopter farmers compared to the non adopters (50%). Haricot beans belong to the leguminous crop category; well known for their nitrogen fixing capacity that in turn improves the soil fertility. As depicted in Table 1, of the total farmers interviewed, 74% of the farm households perceive that haricot beans have the capacity to enhance the fertility status of the land; the proportion being significantly (at 1% level of significance) higher for the adopter (93%) compared to the non adopter (64%) farm households.
Econometric
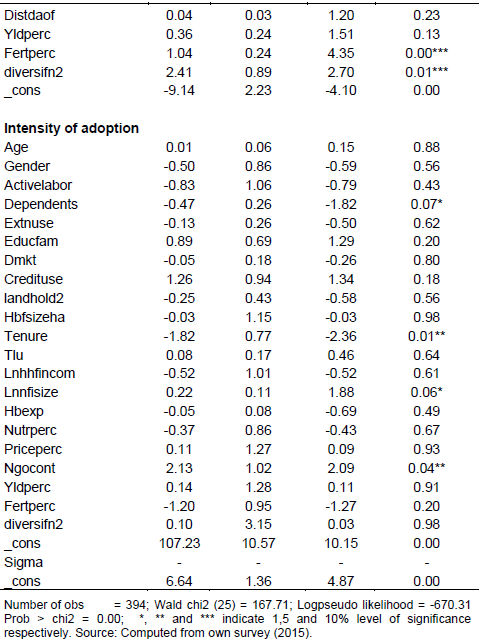
We have adopted Cragg (1971) tobit alternative model with the assumption of the independence of the two decision tiers (that is, the correlation between the decision to adopt and intensity of adoption is zero). The overall Wald chi2-test of the Cragg (1971) model is significant at 1% level of significance (Annex 2). The result of the multivariate model (Table 2) reveals that the two decisions are significantly independent at 1% level of significance (Cappellari and Jenkins, 2006; Roodman, 2009). The Average Partial Effect (APE) for the significant variable is depicted in Annex 3.
REFERENCES
|
Alemitu MA (2011). Factors Affecting Adoption of Improved Haricot Beans Varieties and Associated Agronomic Practices in Dale woreda,
|
|
|
|
Asfawu S, Bekele S, Simtowe F, Hagos M (2011). Agricultural Technology Adoption, Seed Access Constraints and Commercialization in Ethiopia. J. Dev. Agric. Econ. 3(9):436-447.
|
|
|
|
|
Awotide BB, Diagne A, Omonona BT (2012). Impact of Improved Agricultural Technology Adoption on Sustainable Rice Productivity and Rural Farmer'e welfare in Nigeria:A Local Average Treatment Technique (LATE). Presented at the African Economic Conference Oct 30-Nov2, 2012. Kigali, Ruwanda.
|
|
|
|
|
Ban AWV, Hawkins HS (1996). Agricultural Extension. Blackwell Science, Second edition. 294p.
|
|
|
|
|
Berhanu GM, Swinton SM (2003). Investment in Soil Conservation in Northern Ethiopia: The Role of Land Tenure Security and Public Programme. Agric. Econ. 29:69-84.
Crossref
|
|
|
|
|
Beshir H, Emana B, Kassa B, Haji J (2012). Determinants of chemical fertilizer technology adoption in North eastern highlands of Ethiopia: The double hurdle approach. J. Res. Econ. Int. Fin. 1(2):39-49.
|
|
|
|
|
Burton M, Dorsett R, Young T (1996). Changing Preferences for Meat: Evidence from UK Household Data. 1973-1993. Eur. Rev. Agric. Econ. 23(3):357-370.
Crossref
|
|
|
|
|
Cappellari L, Jenkins SP (2006). Calculation of multivariate normal probabilities by simulation, with applications to maximum simulated likelihood estimation. Stata J. 6(2):156-189.
|
|
|
|
|
CSA (Central Statistical Agency) (2014). Area and Production of Major Crops (Volume I). Addis Ababa, Ethiopia.
|
|
|
|
|
Cragg J (1971). Some Statistical Models for Limited Dependent Variables with Application to the Demand for Durable Goods. Econometrica 39:829-844.
Crossref
|
|
|
|
|
Croppenstedt A, Demeke M, Meschi M (2003). Technology adoption in the Presence of constraints: The case of fertilizer demand in Ethiopia. Rev. Dev. Econ. 7(1):58-70.
Crossref
|
|
|
|
|
Dercon S, Hill RV (2009). Growth from Agriculture in Ethiopia: Identifying key constraints [Background Paper]. Retrieved from
View.
|
|
|
|
|
Diao X, Pratt AN (2007). Growth Options and Poverty Reduction in Ethiopia: An Economy-wide Model Analysis. Food Policy 32:205-228.
Crossref
|
|
|
|
|
Diiro GM, Sam AG (2014). Semi-parametric Analysis of Agricultural technology Adoption in Uganda: The role of Nonfarm Earnings. Social Science Research Network. Ohio State University.
|
|
|
|
|
Food and Agriculture Organization Corporate Statistical (FAOSTAT) (2010). Food and Agriculture Organization at
View.
|
|
|
|
|
Food and Agricultural Organization Corporate Statistical (FAOSTAT). (2015). Food and Agriculture Organization at
View.
|
|
|
|
|
Feder G, Just RE, Zilberman D (1985). Adoption of Agricultural Innovation in Developing Countries. A Survey of Economic Development and Cultural Change. World Bank Working Paper No-542.Washington, U.S.A.
Crossref
|
|
|
|
|
Fekadu G (2007). Participatory Varietal Selection of Haricot Bean (Phaseolus vulgaris L.) Varieties in Umbullo Wacho and Beresa Watersheds in the Southern Region. In: Operational Research and Capacity Building for Food Security and Sustainable Livelihoods. Proceedings of Irish Aid Supported Operational Research Review Workshop 11-13 January 2007. Hawassa University, Awassa, Ethiopia.
|
|
|
|
|
Ferris S, Kaganzi E (2008). Evaluating Marketing Opportunities for Haricot Beans in Ethiopia. IPMS Working Paper 7. Nairobi (Kenya): ILRI.
|
|
|
|
|
Heckman J (1979). Sample Selection Bias as Specification Error. Econometrica 47:153-163.
Crossref
|
|
|
|
|
Katengeza S, Mangisoni JH, Kassie GT, Sutcleffe C, Langtintuo AS, La Rovere R, Mwangi WM (2012). Drivers of improved maize variety adoption in drought prone areas of Malawi. J. Dev. Agric. Econ. 4(14):393-403.
|
|
|
|
|
Katungi E, Farrow A, Mutouki T, Gebeyehu S, Karanja D, Alemayehu F, Sperling L, Beebe S, Rubguyo JC, Buruchara R (2010). Improving Common Bean Productivity: An Analysis of Socio-economic Factors in Ethiopia and Eastern Kenya. Baseline Report, Tropical Legumes II.Centro International de Agriculture, Tropical-CIAT, Cali, Columbia.
|
|
|
|
|
Letaa E, kabungo C, Katungi E, Ojara M, Ndunguru A (2009). Farm level adoption and spatial diffusion of improved common bean varieties in Southern highlands of Tanzania. Afr. Crop Sci. 23(3):261-277.
|
|
|
|
|
Martínez-Espi-eira R (2006). A Box-Cox Double Hurdle Model of Wildlife Valuation: The Citizen's Perspective. Ecol. Econ. 58(1):192-208.
Crossref
|
|
|
|
|
Mignouna DB, Manyong VM, Mutabazi KDS, Senkondo EM (2011). Determinants of Adopting imazaapyr resistant maize for Striga Control in Western Kenya: A double Hurdle Approach. J. Dev. Agric. Econ. 3(11):572-580.
|
|
|
|
|
Newman C, Henchion M, Matthews A (2001). Infrequency of Purchase and Double-Hurdle Models of Irish Households' Meat Expenditure. Eur. Rev. Agric. Econ. 28(4):393-419.
Crossref
|
|
|
|
|
Odendo M, David S, Otsuyla R, Buruchara R (2004). The Key Role of Beans in Poverty Alleviation: Lessons from the Impact of Improved Bean Varieites in Western Kenya. Occasional Publication Series. P 43.
|
|
|
|
|
Ogada MJ, Mwabu G, Muchai D (2014). Farm Technology Adoption in Kenya: a Simultaneous Estimation of Inorganic Fertilizer and Improved Maize Variety Adoption Decisions. J. Agric. Food Econ. 2:12
Crossref
|
|
|
|
|
Otiento Z (2011). The role of varieital traits in the adoption of improved dryland crop varieties: The case of Pegeon pea in Kenya. Afr. J. Agric. Res. 6:176-193.
|
|
|
|
|
Rahmeto N (2007). Determinants of Adoption of Improved Haricot Beans Production Package in Alaba Special Woreda. Unpublished M.Sc Thesis. Haramaya University, Ethiopia.
|
|
|
|
|
Reilly JM, Schimmelpfennig D (1999). Agricultural Impact Assessment, Vulnerability, and the Scope for Adaptation. Clim. Change 43:745-788.
Crossref
|
|
|
|
|
Rogers EM (2003). Diffusion of Innovations. 5th editions. The Free Press, Newyork.
|
|
|
|
|
Setegn G, Habtu A, Kimani PM (2010). Navy Bean Breeding for Smallholder Farmers in Eastern and Central Africa.
View
|
|
|
|
|
Shiferawu B, Kebede TA, You L (2008). Technology adoption under seed Access constraints and the economic impacts of improved Pigeonpea varieties in Tanzania. Agric. Econ. 39:309-323.
Crossref
|
|
|
|
|
Sosina B, Girma T, Bekele S, Ricker GJ (2014). Impact of Improved Maize Adoption on Welfare of Farm Households in Malawi: A Panel Data Analysis. J. World Dev.
Crossref
|
|
|
|
|
Sunding D, Zilberman D (2000). The Agricultural Innovation Process: Research and Technology Adoption in a Changing Agricultural Sector. University of California at Berkeley.
|
|
|
|
|
Tsegaye M, Bekele H (2012). Impacts of Adoption of Improved Maize Technologies on Households' Food Consumptionin South-Eastern Ethiopia. Ethiopian Economic Policy Research Institute. Presented at the International Association of Agricultural Economists (IAAE) Triennial Conference, Foz do Iguacu, Brazil, 18-24 August 2012.
|
|
|
|
|
Tobin J (1958). Estimation of Relationships for Limited Dependent Variables. Econometrica 26(1):24-36.
|
|
|
|
|
World Food Programme (WFP) (2013).
View, accessed on Sep 20, 2013.
|
|
|
|
|
World Development Report (2008). Agriculture for Development: Overview. Washington DC.
View
|
|
|
|
|
Wooldridge J (2002). Inverse Probability Weighted Maximum Likelihood Estimators for Sample Selection, Attrition and Stratification. Portuguese Econ. J. 1:117-139.
Crossref
|
|
|
|
|
Yu B, Nin-Pratt A (2014). Fertilizer Adoption in Ethiopia Cereal Production. J. Dev. Agric. Econ. 6(7):318-337.
Crossref
|
|