ABSTRACT
Food insecurity is an integral part of poverty in Ethiopia owing to agricultural production to be less able to adapt to climate change. The main objective of the study is to evaluate the status of food availability in the face of climate change and variability in Choke Mountain Watersheds, Central Ethiopia. For this purpose structured household questionnaire, Key Informant Interview, Group discussion and field observation were used to generate both qualitative and quantitative data. Both purposive and non-purposive sampling techniques were employed to select each agro ecosystem and sample households. Household Food Balance Model (HFBM) was used to analyze the status of food availability. Other quantitative data was analyzed, tabulated and summarized by utilizing Statistical Package for Social Science (SPSS 20). The result of HFBM revealed majority of sample households are food insecured in terms of daily calorie availability per adult equivalent and due to climate variability availability of food is not equal across all Agro Ecology System (AES). Even if the magnitude of productivity problems differ in each Agro Ecology System. Weed infestation, land degradation, dependency on single harvest, lack of farm implements are the cause of reduction of agricultural activities and productivities.
Key words: Food availability, climate change and variability, choke mountain watersheds, household food balance model (HFBM).
Roughly a billion people around the world live their lives in chronic hunger, and humanity’s inability to offer them sustained livelihood improvements has been one of its most obdurate shortcomings. Although rapid improvements in agricultural productivity and economic growth over the second half of the twentieth century brought food security to broad swaths of the developing world, other regions did not share in that success and remain no better off today and in some cases worse off than they were decades ago (Burke and Lobell, 2009). Climate change posed the greatest threat to agriculture and food security in the 21st century, particularly in many of the poor, agriculture-based countries of sub-Saharan Africa (SSA) with their low capacity to effectively cope (Maxwell and Smith, 1992; WFP, 2009).
The Fourth Assessment Report of the IPCC has made a critical assessment of the possible impacts of climate change on agriculture, livestock and fishing, particularly in the countries of the tropics and sub-tropics (IPCC, 2007). The Food and Agriculture Organization of the United Nations (FAO) also warns about the negative consequences, in particular for smallholder subsistence farmers in what are in any case marginalized regions of Africa. This is largely because of high poverty rates, high vulnerability levels, dependency on fragile environment and low adaptation capacities. Furthermore, the rural populations of Africa for whom agricultural production is the primary source of direct and indirect employment and income are most affected because of agriculture’s direct exposure to climate change (IPCC, 2007). From a food security viewpoint, sub-Saharan Africa (SSA) is doubtfully the most vulnerable region to many adversative effects of climate change due to a very high dependence on rain fed agriculture for basic food security and economic growth, and entrenched poverty (IPCC, 2007).
Though it is endowed with varieties of natural resources suitable to produce wide varieties of crops, Ethiopia has been challenged by lack of food security and become one of food aid dependent sub-Saharan African countries (Markos, 1997). At present agriculture dominates the Ethiopian economy, accounting for 47% of GDP and 85% of employment, dominated by small scale farmers who employ largely rain-fed and traditional practices (MARD, 2009). Almost 80% of the population lives in rural areas and depending on crop production and/or keeping livestock as means of livelihood (WB, 2008; USAID, 2010). Climate change has become topical because of its effects on human lives and the future of the world. Interestingly, it affects all the dimensions of food security (FAO, 2003). Ethiopia is the most vulnerable countries and the vulnerability of Ethiopia to climate change impact is a function of several biophysical and socioeconomic factors (Belay, 2011). Therefore, climate change will have a far reaching implication on food security. For example, the increasing year-to-year variability and increases in both droughts and heavy precipitation events lowers agricultural production including frequent drought (1965, 1974, 1983, 1984, 1987, 1990, 1991, 1999, 2000 and 2002) and recent flooding (1997 and 2006) leads to negative effects on food security (Marius, 2009; Markos, 1997). Since 1959, the domestic production of food has never been sufficient to meet the food requirements of the national population. Indeed, since the 1960s, the number of food insecure households has been increasing, whilst per capita food availability has been decreasing (Markos, 1997). The per capita food availability was, on average, 128.08 kg for the period 1961to 1974, and it declined to 119.99 kg in 1975 to 1991. Though average per capita food availability was 125.41kg during 1992 to 2001, still it remained far below the recommended average per capita daily requirement set by the Ethiopian government 2,100 kcal, which is equivalent to about 225kg) of grain per annum (Markos, 1997).
Empirical evidence of food security in Ethiopia indicates the prevalence of a high level of food insecurity, with significant distinctive and spatial characteristics. The specific food security studies conducted by Abebawet al. (2011), Hadleyaet al. (2011), and Hailu (2012) shows that the depth and intensity of food insecurity are high, influenced by poor functioning of marketing systems and other household and socioeconomic factors. Fragile natural resources base, inadequate and variable rain fall in terms of intensity and distribution pattern, improper farming practice, inaccessibility to productive resources, diminishing land holdings and tenure insecurity, poor development of human resources, poor storage technologies that leads to high post-harvest losses, inaccessibility to transport infrastructure, lower productivity of livestock are different human and natural induced factor that made Ethiopia a food insecure country over last few decades (Woldeamlak, 2009; Deveruex, 2010). Due to these reasons, food insecurity is an integral part of poverty in Ethiopia owing to agricultural production is to be less able to adapt to climate change.
Choke mountain have considerable ecological and socioeconomic significance at the local, regional, and national levels. However, land degradation has impaired the capacity of the land to contribute to food security. It has also undermined local access to water supply and woody biomass, negatively impacting social stability. Erratic rain fall, increase in temperature, drought, flood, annual runoff and water availability are also exacerbate deterioration of basic services such as drinking water, sanitation, housing and health facilities which causes food insecurity in poor farm household (Belay, 2011). Both food security and climate change are multidimensional, dynamic and broad concept and climate change have effect on food security: On food availability, accessibility, utilization and stability (FAO, 2008). Even though there are some studies that have been conducted about effects climate change (Tsegaye, 2009; UNDP, 2007; Hamza and Iyela, 2012), there is no study regarding the status of food availability in relation to climate change in Ethiopia in general and Choke Mountain Watershed in particular. Mesay (2001) and Debebe (1995), briefed the necessity to conduct situations food security at household’s or individual level. To this end food availability is the main emphasis of the study which can further determine the rest pillars of food security. All the determinants of these pillars like exchange and distribution were not also covered in the study because itis more reliable at regional and national level. Thus, food production was given priority from determinants of food availability in the face of climate change and variability in the study area.
Description of the study area
The Choke Mountains is a large block of highland found in central Gojjam, Amhara Regional State, Ethiopia. It is located on plateaus that rises from a block of meadows and valleys and have elevation ranging from approximately 800 to 4200 m above sea level. The central peak is located at 100 42' N and 370 50' E (Figure 1). The mountains were formed by volcanic activity about 30 million years ago in the middle of late tertiary. The prevailing climate can be described as “tropical highland monsoon”. Seasonal precipitation is tightly correlated with the movement of the Inter-tropical Convergence Zone (ITCZ), with most rain falling during the May-October Kiremt (rainy season in Ethiopia). The distribution of precipitation within the Choke is far from uniform; average annual precipitation ranges from 600 to 2000 mm year-1, and exhibits strong local variability associated with topographic gradients. Precipitation events are convective in nature, and are characterized by short, sometimes intense erosive bursts with notably large raindrops (Belay, 2011). Type of soil dominate in the watersheds are Leptosols, Cambisols, Vertisols, Nitosols, Alisols, Luvisols, Andosols and Phaozems which support range of agricultural uses. More specifically, sorghum, maize and teff, durum wheat, barley,chickpea, range of pulses and potato grown according to their agro ecological system. The dominant distribution of vegetation types according to their agro-ecosystem are the Juniperus procera, Erica arborea, Hagenia abyssinica, Hypericum revolutum, Oleaeuropae, Oxytenathera abysnica, Accacia spp., Prunus africana, Hagenia abyssinica, Erythrin abrucei and Arundinaria alpina and Eucalyptus globulus.

According to Belay et al. (2013), based on the overlay of three inputs, that is, precipitation and temperature, a soil and terrain analysis, and a map of the distribution of farming systems, the agro ecosystem (AES) of Choke Mountain watersheds is classified in to six. These are as follows.
Lowland and valley fragmented agro ecosystems (AES 1)
This Agro ecosystem includes the lowlandsin the eastern part of
the Choke Mountain watersheds and fragmented valleys along the Blue Nile gorge, with an altitude range of 800 to 1400 m. it is characterized by relatively unfavorable agro-ecologic conditions: rugged terrain, lower and more sporadic rainfall than the other AES, and extensive land degradation.
Midland plains with black soil(AES 2)
It is found on the eastern toe of Choke Mountain, extending from the town of Dejen to the town of Mota. This agro ecosystem represents midland plains with black soil within elevation ranging from 1400 to 2300 m. it is more suitable for agriculture and is potential for input-intensive teff, durum wheat and chickpea production, provided appropriate Vertisols management practice is in place.
Midland plains with brown soils (AES 3)
It is found on the western and southern toe of Choke Mountain toe. the elevation varies between 1400 and 2400 m. The annual temperature varies between 16 and 21°C, and the growing period is between 121 and 180 days. It is also a potential area for pulses and oil crops. This system is potentially suitable for input-intensive, mechanized agriculture and irrigation that could contribute to rapid increases in productivity.
Midland sloping lands (AES 4)
This agro ecology system is located at the foot-slope of Choke Mountain with elevation ranging from 2400 to 2800 m. The annual temperature varies between 11 and 15°C and the growing period between120 and 180 days. It is constrained by low natural fertility due to leaching of base ions and high level of soil acidity. Sloping terrain is more difficult to cultivate than flat land, and is subject to higher rates of water runoff and soil erosion. The main crop types produced are wheat, maize, teff, and a range of pulses. The highly rugged landform, associated land degradation and soil acidity present major constraints for crop production. It has potential for more intensive production system, but soil and water conservation measures are critical.
Hilly and mountainous highlands (AES 5)
These hilly and mountainous highlands are found on the back-slope of Choke Mountain. The major constraints on production in this area are low temperature, soil erosion and deforestation leading to water management problems. Rangeland (grazing or pasture land) degradation is also common due to overstocking. It is not appropriate for high intensity agriculture, but it does have high potential for traditional forestry, including bamboos and potato and barley production with appropriate mountain agricultural land management.
Afro Alpine (AES 6)
The Afro Alpine is the Choke Mountain summit. Elevation ranges from 3800 to 4200 Given the important functions of Afro Alpine as a reservoir for biodiversity and a soil and water retention zone, combined with the area’s relatively low agricultural potential due to low temperatures, the most appropriate use of the area is as a protected bio -reserve (Belay et al., 2013).
Socio economic and demographic characteristics of the study area
East Gojjam zone has considerable ecological and socioeconomic significance at the local, national, and regional levels in its contribution to food security in Ethiopia. This highland zone has the most favourable climate with land resources suitable to grow large variety of crop and livestock species, it stands as the most intensively cultivated and is considered as one of the bread basket areas of the country. The mountain range is densely populated, with an average of 260 to 270 people per km2. Settlements are fairly common up to 3600m asl. The livelihoods of the farming communities are facing severe constraints related to intensive cultivation, overgrazing and deforestation, soil erosion and soil fertility decline, water scarcity, livestock feed, and fuel wood crisis. While traditional land management, including appropriate agricultural practices as well as good forestry practices have extensively protected the Choke from accelerated erosion in the past, today's land abandonment as well as forest mismanagement has dramatically increased the frequency of intensive soil erosion events. The livelihoods of the communities on the Choke Mountain Range are primarily dependent on biomass-based subsistence economy. Communities depend on biomass for their fundamental needs like food, fuels, construction materials, and raw materials for various traditional crafts, most of which are collected freely from the immediate environment.
Research design
This research has attempted to integrate the use of quantitative and qualitative data. The qualitative approach of this study was comprised by key informant interview, focus group discussions, direct observation, whereas the quantitative approach was employed through household survey. Both primary and secondary data was used in this study. Primary data was collected through household survey, key informant interviews, focus group discussion and direct observation. The study also include secondary data from published and unpublished materials like, reports, books, maps, national and regional manuals and guide lines related to the topic to be studied.
Sampling techniques and procedures
There are six agro-ecosystems in the Choke Mountain Watershed. The researchers used both probability and non-probability (purposive) sampling methods. For the purpose of this study, the researchers select five agro-ecosystems and one
Kebele[1] purposively by considering their proximity to road. Simple random sampling from probability sampling is used to select five kebeles-one from each agro-ecosystem and sample household, by which households as people living in one village is near homogenous in terms of economic activity, technological development and other socio economic conditions. The selected villages have a total household population of 1000. Because of too many household in the study area, it is difficult to administer questionnaire and conduct interview to all of them. Thus, 10% of the total households from those villages were selected. Accordingly, probability proportion to sample size technique (Table 1) was used to distribute questionnaire to the sample households for each sample villages. In addition to this, Key Informant Interview was conducted with 10 individuals (2 from each village) with different background and has deep understanding about the issue (one agricultural expert and one religious leader). Focus group discussion was also conducted with an average of 8 to 10 from different groups with total five focus group discussion in each of the selected agro-ecosystems. Finally, field observation was used to supplement and triangulate information collected in survey questionnaire, focus group discussion and data from secondary sources.
[1] Lowest administrative unit which comprises of villages
Method of data analysis and presentation
Data which were collected from both primary and secondary sources were analyzed, summarized and presented via quantitative and qualitative method of data analysis. Questionnaire which is gathered from respondents is quantitatively analyzed, summarized and presented in table, graph, and percentage. For the purpose of measuring household food security situation, Household Food Balance Model (HFBM) was used.
The net available food for the households was computed using a modified form of a simple equation known as Household Food Balance Model, originally adapted by Degefa (1996) from FAO Regional Food Balance Model and then used by different researchers (Eshetu, 2000; Mesay, 2010; Seyoum, 2012). The quantity of food was calculated and converted into dietary calorie equivalent based on Ethiopian Health and Nutrition Research Institute food composition table. Then the food supply at a household level was calculated by dividing a total number of days per year (365) and adult equivalent value for each sampled households was used to calculate calories available per adult equivalent per day for each household.
According to FDRE FSS (1996), 2100 kilo calories per person per day was used as a measure of minimum calories required per adult equivalent per day (that is, demand) to enable an adult to live a healthy and moderately active life. Then a comparison between the available (supply) and required (that is, demand) grain food was made. Finally, the output of the HFBM, comparison between calories available and calories demanded by a household was made to determine the food security status of a household. A household whose daily per capita caloric available (supply) is less than his/her demand was regarded as food insecure and household who did not experience a calorie deficit during the year under study was regarded as food secure.
NGAi = (GPi + GBi + GRi + GPSi) - (HLi+ GSi + MOi +GGi+NSi)
Where, NGAi = Net grain available/year/household; GPi = Total grain produced/year/household; GPi = Total grain bought/year/household; GRi = Total Grain obtained from remittance /year/household; GPSi = Total grain obtained through previous stock/year/household; HLi = Post harvest losses/year household; GSi = Quantity of grain reserved for seed/year/household; MOi = Amount of marketed output /year/household; GGi = Grain given to others as a gift within a year/household, and NSi = grain planned to be left by a household for next season/year/household
In this model, the index i run from 1, 2………….100. Except postharvest losses, all the data needed for HFBM were collected from the primary data from household survey with the period between November 2013 to October 2014. However, the rest postharvest losses data was obtained from secondary data. According to East
Gojjam Zone[2] of agricultural office and from previous study made using HFBM an average post-harvest crop loss during the year under investigation was estimated at an average value of 10% of the total production of each crop.
The researchers have also used descriptive statistics to analyze household’s perception of food security and utilization of food in face of climate change. After the necessary information and data were collected and generated, the researcher has employed different statistical methods and tools to analyze and present the data collected side by side with qualitative summarization and discussion. The quantitative data was analyzed by the using (Statistical Package for Social Science) SPSS and Microsoft excel.
The information obtained from key informant interview, focus group discussion and direct observation were analyzed through qualitatively by narrative descriptive.
[2] Zone is the major administrative division next to region in Ethiopia
Household’s perception about food security in the study area
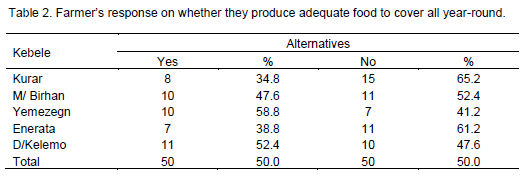
Farmers who operate land which is inherently more susceptible to food insecurity are thought to have a greater propensity to increase their agricultural production and perceiving the problem provides stimulus to stop the problem. All households in the sample areas were asked about their perception regarding to their food security status. Some 52 and 3% of total sample households replied that they face transitory and chronically food insecure respectively. Other 45% said that, there is no food shortage at all to their family. Specifically among sample kebeles, Kurar (56.5%) and D/Kelemo (52.4%) are more vulnerable to transitory food insecurity. Whereas, Yemezegn (58.8%) andEnerta (50%) are food secured. According to farmers perception from Enerta and D/Kelemo are not affected by chronically food insecurity (Figure 2).
According to households perception, half of the respondents (50%) reported to regularly produce sufficient food from their own crop production and animal production to cover all year round demand. Majority of households who do not produce their own food were found in Kurar and Enerata (Table 2).
In addition to this, number of months of the year that sample households of different AES failed with food shortage were also examined in this study. From the total sample households, about 38.3% of respondents replied that they faced food shortage for about 1 to 2 month/s per annum and 46.8 and 14.9% of household from the total are faced food shortage 2 to 3 and above 3 moths per annum respectively. Furthermore, Sample households were also asked about food preferences they eat. According to their response, 81.0% of respondents do not eat the food that they preferred. Even though they produce food for the year-round for their consumption, majority of households do not eat the food they prefer and only 19.0% of households eat food they preferred. This can tell us even though the majority eats what they prefer, yet still they are food insecured.
Food security and food availability
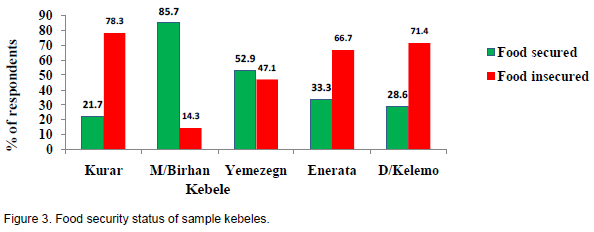
The result of the HFBM reveals that from the total sample households, 44% households are food secured who fulfill the minimum recommended daily calorie (2100 Kcal/adul.equ) demanded for their households. While 56%ofthemfailedto supply this dailyminimum requirements.
Majority of food insecured households are from lowland and valley fragmented (Kurar) which constitute 78.3% followed by hilly and mountainous highlands (D/Kelemo- 71.4%) and Enerta (66.7%). On the contrary majority of food secured households are from mid land plain with black soil (M/Birhan-85.7%) and from mid land plain with brown soil (Yemezegn-52.9%) were food secured (Figure 3). From this figure one can easily view AES midland plain with black and brown soil are the contributing factor behind good agricultural production which in turn perceived to contribute food security in the study area.
Household Food Balance Model (HFBM) balance sheet result
The balance sheet of HFBM reveals that the mean per adult equivalent kilo calorie (kcal/daily/adul.equ) of the sampled household is 3244 kcal/daily/adul.equ., which is above the minimum daily requirement set by the national standard of 2100 kcal/daily/adul.equ. But the distribution of this average energy available in each of sampled household is further expose out that it is highly dispersed among the sampled households with a large amount of standard deviation (Std. Dev =2709). These conditions create groups of household that one could achieve in fulfilling the minimum energy requirement in their household while the second groups failed to do so (food insecured). One could also see that the extent of food security situation among the sample households in line of food availability stretches along at a range of 241 to 19716.7 kcal/daily/adul.equ. These minimum (241kcal/daily/ad.equ) and maximum (19716.7kcal/d/ad.equ) is found in Enerata and M/Birhan respectively (Table 3).
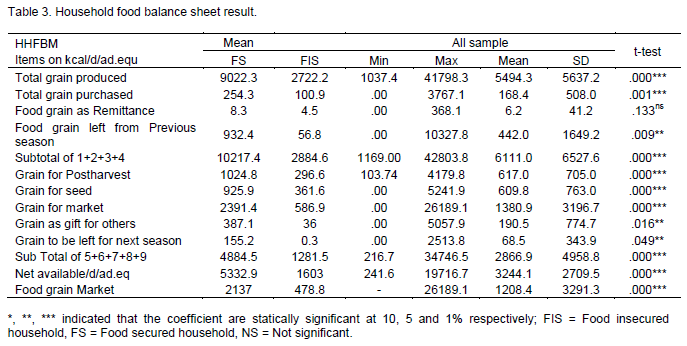
The result of the food balance sheet of HFBM in Table 2 also illustrate that food secured households have greater capacity to produce their own production, a better stock that was left from previous production and have greater capacity to take a food reserve for coming season.
Food grain market balance for the household show that food secured household have statistically greater average net energy supply for the market in terms of grain energy than the food insecured groups. Even though mean for the samples household show they are net food sellers for the market and both food secured and insecure groups have a net food grain sellers. The data output of the HFBM also reveals that there are household that are supplying their household energy as a net food grain buyers. Furthermore, from the result of the key-informant interview and group discussion confirmed that the current food market price increase trends reward the net food grain sellers, while net food grain buyers are suffered with the price and make their household food security more vulnerable with external price factors for grain market.
Food availability, agricultural production and status of land productivity
Agricultural production and food availability are just one part of the food security. Agriculture in Ethiopia is important for food security in two ways: it produces the food people eat; and (perhaps even more important) it provides the primary source of livelihood for the majority of the working population. The level of agricultural productivity of a household determines the food security status of a household. This is due to the fact that the greater share of household food energy available is derived from household’s own agricultural production. In fact small holder farmers in the study area and all over country at large produce for their own consumption and very insignificant part of the household food economy is exchanged. Agriculture in the choke mountain is predominantly crop-livestock mixed systems and also subsistence with very low inputs and outputs. However, mixed farming system in Choke Mountain is highly affected by climate change.
Food production varies spatially and temporally owing to climatic condition. The major agricultural production kebeles’ are characterized by relatively stable climatic conditions with dry or at least cold weather condition during harvest time, but food insecure kebeles’ from the study area have highly vulnerable climates. Climate change determine the type of crops produced that farmers face problems to make decisions about the type of crops produced in the coming season and the amount of production in different ways.
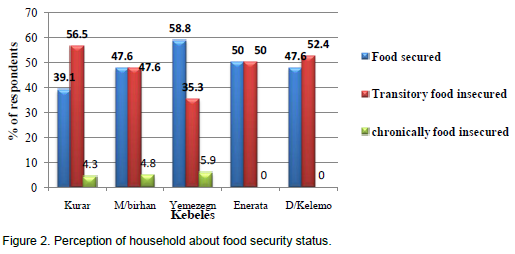
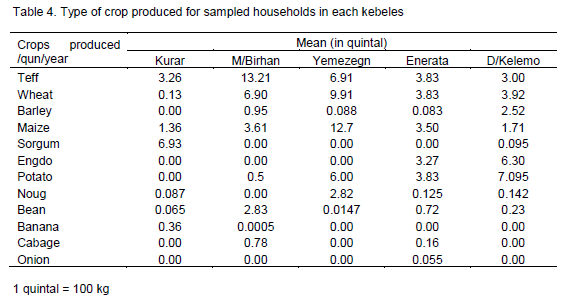
Types of crop produced are different from one AES to the other due to climatic condition and altitudinal difference. Kurar kebele is suitable for producing Sorghum (sorghum bicolar) (M=6.93), Teff (eragrotis teff) (M=3.26) and maize (zea mays) (M=1.36) (Table 3) where this kebele is characterized by rugged and sloping terrain, low and sporadic rain fall, extensive land degradation and low soil fertility. Although average temperature decrease and annual rain fall increase from 1981-2008, as explained above, production in Kurar is low. This is due to the fact that, production is highly dependent on variability and seasonality of rain fall. On the contrary, mid land plains with black soil zone is productive by Teff (eragrotis teff) (M=13.2), Wheat (Triticum spp.) (M=6.9) and cheak pea (Cicer arientinum) (M=2.83). According to the survey result the topography of this kebele is extensive level plain with high fertility status of soil.
Food security in M/Birhan was achieved since agricultural productivity is high and has a capacity to do more in this zone even if temperature increase (Figure 7) and rain fall decrease (Figure 8). Even though average temperature increase in Yemezegn (Figure 7). This AES have high productivity capacity with irrigation and good chemical fertilizer. This zone is known by the productivity of Wheat (Triticum spp.), Teff (Eragrotis teff) and Noug (Guizotia abyssinica) with a mean value of 9.91, 6.91 and 2.82 respectively. As compared to other crops Wheat (Triticum spp.), Teff and potato with the same mean value (3.83) are main crops for Enerata with moderate sloping terrain and low natural fertility. The last AES (D/Kelemo) like lowland and valley fragmented is highly vulnerable to soil erosion, land degradation and erratic rainfall. Owing to this Potato, Engdo and Barley (Hordeum vulgare) are the main crops in the area with no chemical fertilizer and low level of soil fertility. Especially, Engdo is the main stable food crop which substitute previously grown crops –Barley (Hordeum vulgare) and wheat (Triticum spp.) in D/Kelemo (Table 4).
Moreover, change in size of farm land, slope of farm land and their productivity with fertility status of land determine the type and amount of crops produced in the study area owing to climate change and extreme weather events like drought and flood. More than 75% of the total sample households (77%) revealed that, the productivity of land decrease while the remaining 17 and 6% of them give as land productivity increase and remain the same respectively.
According to the survey result, 61% of total sample respondents especially those from Kurar (93.1%) and D/Kelemo (80%) put that, land productivity decrease due to land degradation (Figure 4). Because these two study areas are highly vulnerable to extreme weather events since the topography is sloppy and is more sensitive for flooding. Land degradation, therefore depressing land productivity per unit area and availability of food from domestic harvest and was a major factor affecting household food security. The result from Focus Group Discussion, Key Informant Interview and Personal also confirmed that the reason for decrement of land productivity is the vulnerability of sloppyareas to soil erosion and absence of well-developed soil and water conservation techniques.
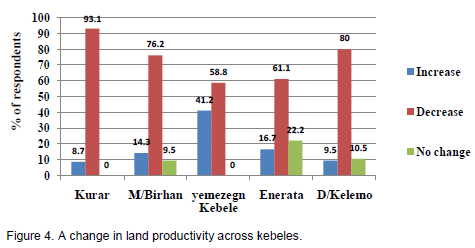
The second and third reasons for decrement of land productivity following land degradation are drought and low and variable rain fall patterns. The fourth reason for decrease of land productivity is insect pest and weeds. The farmers felt that insect pest and weeds negatively affected agricultural production and were most important problem that lowered the productive potential of production and affected household food security. The result from Focus Group Discussion and Key Informant Interview revealed that the reason for increment of land productivity is increasing fertility of soil. Strong extension service and suitable weather condition are also reason for the increment of productivity of land (41.2%) from M/ Birhan.
Size of households’ farm land and status of fertility
Regarding changes that occurred to the farmers' size of land holdings, majority of sample households reported about a decrease in size of land holding starting from the time that they produce in their land. Especially in D/Kelemo, Kurar and M/Birhan, majority of respondents reported about decline of land holding, that is, 95.8, 95.7 and 87.2% respectively (Figure 5). Thus, majority of household’s land is decreased in the study area under investigation. Some of the households also reveal about increment and no change of farm size.
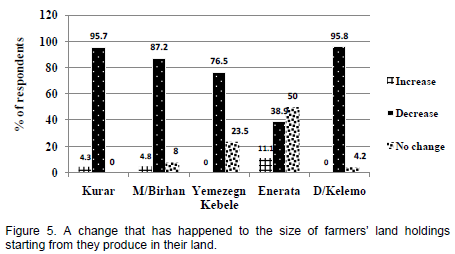
All respondents were asked about reason for increment, decrement and about no change. The reported reasons for the decline of land holding size includes: Land degradation and increase of grazing land (75%) and loss of land to others by redistribution (50%) from the entire sample households. Land degradation in Choke Mountain is the main constraint to agricultural productivity. Lowland and valley fragmented (Kurar) and hilly and mountainous highlands (D/Kelemo) are the victim kebeles by land degradation that reduce agricultural productivity andin turn affectfood security. Belay et al. (2013) also shows that land degradation is the main constraint for production in the same area. According to key informant interviewees and focus group discussants from D/kelemo, land degradation before this time occur during June, July and August; where these months are highly rainy and flood occur and leads to soil erosion. However now a day, it continues up to October and December which is a harvest time and reduce crop productivity. This is due to climate variability and extreme weather events like flooding. Population growth has also led to a high level of fragmentation of land in the study area. Hence, acquiring a relatively large tract or tracts of land for farming is a difficult task thereby size of land degraded. When farm land is fragmented to their family, then piece of land will be more vulnerable to other extreme weather events like flooding. The result from Focus Group Discussion, Key Informant Interview and Field observation also strengthen the change happened to land holding size across sampled kebeles, which are very prone to land degradation inveterate by fragmentation.
On the other hand, those who got additional land mainly benefited from farming mountainous and hill lands (83.3%) and clearing land for farming or deforestation (33.3%). Recent land reallocation by government and a few households from purchasing land as well as from renting land through share cropping arrangements are also means of increasing land size according to focus group discussants. 15% of total sample households reveal, the size of land holding is constant. This may be partly explained by the fact that the size of the holdings is small and already below the optimal. This fact holds true for Enerata, Yemezegn and D/kelemo respectively even if the percentage is very small.
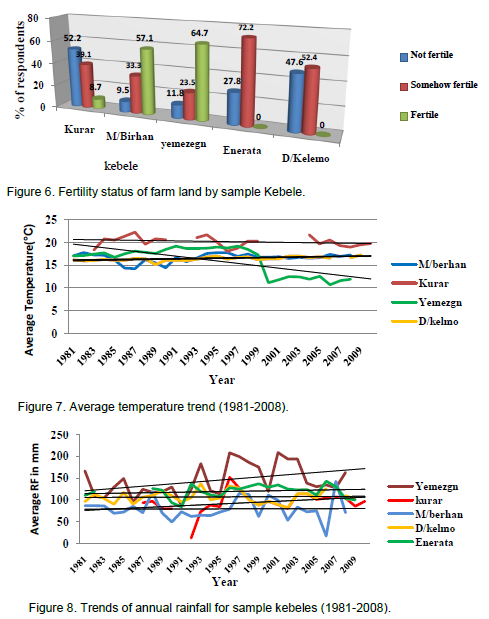
The farmers were also asked to identify the general topography and fertility status of their farm plots. Because, topography and fertility status of farm plot are determining factor of agricultural productivity and food security status of households. Households from lowland and valley fragmented (Kurar) and hilly and mountainous highland (D/Kelemo) reveal that topography of their cultivated land is hilly and sloppy with mountainous land and not fertile and somewhat fertile with regard to soil fertility status (Table 5). This type of topography and low fertility status of soil is not suitable for agricultural activity and then cause for food in security. Plain level of cultivated land and fertile soil with minimal soil erosion and other degradation problem characterize M/Birhan and Yemezegn Enerata is prone to moderate soil erosion and associated degradation.
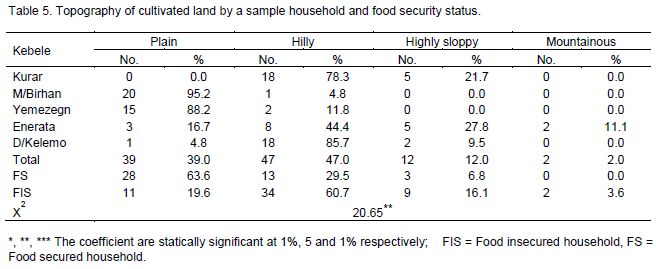
As the result show, there is a statistical systematic difference between food security status and topography of cultivated land. Food secured households have more of plain land with small proportion of hilly, highly sloppy and mountainous whereas sloppy hilly mountainous slop of land dominate food insecured kebeles. Eshetu’s (2000) work also shows that food has a negative and significant impact on per capita food kilocalorie availability and farmers residing in mid altitude areas are a better position than those residing in high altitude areas regarding per capita food kilocalorie availability.
Food security status of sample household is also determined by fertility status of cultivated land and there is s statistical difference between fertility status of cultivated land and food security status of sample households (X2=6.889, P<0.05).
Analysis of climate change
To see the long term temperature and rainfall change, data were collected from National Meteorological Service Agency for sample kebele. However, the problem in Ethiopia is that, all stations do not have data as required by the study. But the researcher has tried to take data from the nearby distance of the study area. The temperature data of Enerata and D/Kelemo was taken from Debre Markos whereas both the temperature and rainfall data of M/Birhan was taken from Debre Work.
There is a change in average temperature in all sample kebeles (Figure 6). Except Kurar, temperature trend in all kebeles from 1981 to 2008 shows increases. Above all, temperature in Yemezegn shows an increasing trend as compared to other kebeles. However, in Kurar the graph shows decrease in temperature by 0.78°C. This is due to the fact that, Kurar is located in Abay Gorge and the temperature condition of the area could be determined by other factors.
On the other hand, annual rainfall trend shows, there is a variability and in some cases increase from 1981 to 2008 in all areas (except M/Birhan) even if increase by small amount. However, as the study shows, crop productivity decreases especially in lowland and hilly and mountainous areas. This is because; crop productivity does not only depend on amount of rain fall rained but also on seasonality and variability of rain fall.
According to focus group discussants, the cropping and harvesting time was extended due to rain fall variability. For example in the previous time, cropping time for maize was starting from at the end of April and beginning of May and October as a harvesting time. Whereas now a day cropping time is extended up to June and during harvesting time rain failed which damage crop productivity.
Cause of seasonal food shortage
The designing of the main instrument for the inquiry on why farm households were unable to produce adequate food at home was largely based on household survey and focus group discussion. There are different constraints that hinder agricultural productivity and then induce food insecurity. Not all constraints have equal magnitude of influence on each household and in each AES. Hence, in order to identify the impact of the main perceived cause of food shortage, sample households were asked to respond to each constraint according to their severity to identify and prioritize agricultural problems, which had back the production and the growth of productivity.
The household’s rated erratic rainfall, dependency on single harvest, drought and land degradation as most influential of all study area. From the household survey of total sample households, 98% of respondents reveal that erratic rainfall is both severe and more severe leading reducing productivity and then shortage of food. One key informant interviewee from Enerata stated that, ‘rain does not come as it formerly used to, rains these days do not fall at the appropriate time; previously started at the end of February and March at all but now it goes up to June; and the weather is now hotter than in the past’. Woldeamlak (2009) also stated that, virtually all food crop agriculture in Ethiopia depends on rainfall that is frequently erratic and unpredictable.
Dependency on only a single harvest affects production in the study area. 44 and 34% of sample households were responding that dependency on single harvest affect food production severely and more severely respectively.
From the entire households 77% of households’ response that land degradation is more severe (30%) and sever (47%) impact on food production through hindering agricultural productivity. At a kebele level, Kurar and D/Kelemo are highly affected by land degradation which leads to soil erosion and then leaching of soil fertility which is not productive. None of the respondents from these two kebele responded the effect of land degradation as nil rather all of them are included in more severe, severe and moderately. Although land degradation is also a problem for producing food in M/Birhan, Yemezegn and Enerata, the degree of their severity is much differs from Kurar and D/Kelemo (Appendix A).
About 71% of total sample households reflected that, drought is a major cause for food shortage severely and more severely. For more than three decades, Ethiopia has experienced recurrently deadly droughts including those of the 1972/3, 1984% and 2002/03. Drought has a long term effects in reducing the economic base of households, thereby leading to chronic and acute food insecurity. Household’s vulnerability to food insecurity increase during protracted drought through progressive depletion of food stocks and capital assets (Markos,
1997).
The farmers felt that insect pests and weeds negatively affected agricultural production and were rated as the most important problem following erratic rain fall, dependency on a single harvest, drought and land degradation. Insect pest and weeds were perceived as a major cause of household food security because they lowered the productive potential of domestic production. 68% of the total sample households explained that pest and weeds infestation as more severely and severely. As compared to the other kebeles’, Yemezegn is highly affected by insect pests and weed infestation. As it is shown in Appendix A, sample households from this kebele were 17 and all respondents were failed with severe (n=9) and more sever (8%). According to focus group discussants, this insect pest and weed infestation occur due to climate change particularly drought and they reflect that before this time the temperature was normal but now a day temperature increase from time to time and become cause for insect pest and weed infestation which leads to degradation of productivity.
The opportunity to diversify cash income through employment in off farm or non- farm activities appear very limited in Choke Mountain Agroecosystem. Lack of cash impacts not only farmer’s livelihoods, but also directly reflects a lack of capacity to modernize agricultural systems which in turn impact negatively on households food security. The lack of cash among farmers results in the inability to purchase farm inputs and a limited scope to innovate outdated and overused farm implements. Consequently, both labor and land productivity was low. Some of sample households attributed poor productivity and food shortage to the inability to purchase and properly apply modern farm inputs and to unproductive traditional practices.
Access to farm credit could compensate for small farmer’s cash deficiencies. However, some of the respondents indicated that no such support was provided by the government or government partners. Agricultural extension services were weak due to low resources and poor commitment by the ministry of agriculture towards strengthening the extension services. Shortage of labor was also indicated as a constraint affecting agricultural production and food security. Postharvest grain loss due to poor storage structures were indicated as one of the constraint to household food security. Considering the already low production, the poor postharvest handling further affected household food security through diminishing the amount of available food from domestic production.
In addition to household survey, different constraints for household food security were explained households during focus group discussion in each kebele. Health problems were as one important cause of food shortage through constraining agricultural production. Malaria was identified as the main diseases affecting production especially in Kurar through loss of labor for farm operation. The outbreak of an epidemic during critical agricultural operations such as cultivation, weeding and harvesting adversely affected agricultural productivity. Lack of draught animals greatly affects livelihoods presented by group of households during focus group discussion. Farmers with no draught animals cannot prepare their farmlands in a proper manner. They had either to rent out their land to others farmers with adequate draught power or rent draught animals. This is in both circumstances, farmers’ loss some of their produce through shares or income, which diversely affects household food security. Other studies such as Tilaye (2004) in Gera Keya woreda in Amhara region also shows the same result for cause of food shortage. Thus, it is possible to conclude that food security will depend not only on climate and socio-economic impacts on food production, but also (and critically so) on economic growth, changes to trade flows, stocks, and food aid policy.
The study revealed that the majority households living in different agro ecological system perceived they are food insecured. The study result also shows that the majority faced food shortage for above 2 months per annum and they do not had food they preferred. The study confirmed that Food security status of sample household is determined by fertility status of cultivated land and there is statistical difference between fertility status of cultivated land and food security status of sample households. The result of Household Food Balance Model (HFBM) also shown that households failed to supply their daily minimum requirement according to national standard which is 2100 Kcal/adul.equ. Additionally, Food Grain Market balance for the household shown that food secured household has statistically greater average net energy supply for the market in terms of grain energy than the food insecured groups. The study result shows that there is a statistical systematic difference between food security status and topography of cultivated land. Food secured households have more of plain land with small proportion of hilly, highly sloppy and mountainous whereas sloppy hilly mountainous slop of land dominate food insecured kebeles. Additionally, the study confirmed that change in size of farm land, slope of farm land and their productivity with fertility status of land determine the type and amount of crops produced in the study area owing to climate change and extreme weather events like drought and flood. The trends of average temperature and rainfall in sampled agro ecosystem shows that there is clear change which affected cropping and harvesting time as well as amount of crop produced. Climate change determine the type of crops produced that farmers face problems to make decisions about the type of crops produced in the coming season and the amount of production in different ways. The study result shows that climate change determined decision of sample households about crops produced. The study also revealed that land degradation, dependency on single harvest, drought, low and variable rain fall pattern (erratic rainfall), lack of access to farm credit, opportunity to diversify cash income and insect pest were responsible for decrement of their farm land productivity which in turn leads household food insecurity.
The authors have not declared any conflict of interest.
The authors sincere thanks goes to Addis Ababa University Climate Change Thematic Project for financial support and East Gojjam Zone Agricultural and Rural Development office staff for their cooperation in providing relevant data. Enumerators and development agents in each Agro ecology system are also acknowledged for their efforts to get reliable information in time of interviewing and group discussion from and with farmers. The authora also would like to extend their appreciation to all interviewed farmers for their precious time and commitment in group discussion.
REFERENCES
|
Abebaw S, Janekarnkij P, Wangwacharakul V (2011). Dimensions of food insecurity and adoption of soil conservation technology in rural areas of Gursum District, Eastern Ethiopia. Kasetsart J. Soc. Sci. 32:308-318. |
|
|
|
Belay S (2011). Building Resilience to Climate Change and Green Economy in the Mountain Ecosystems of Ethiopia: Integrating Research Capacity Building and Sustainable Development Activities; A case study of the Choke Mountains, Addis Ababa University. |
|
|
Belay S, Zaitchik BF, Mutlu O (2013). Agroecosystem analysis of the Choke Mountain Watershades, Ethiopia. Sustainability 5(2):592-616.
Crossref |
|
|
Burke M,LobellD (2009). Climate effects on food security, an Overview: Adv. Glob. Change Res. 37:13-30.
Crossref |
|
|
|
Debebe HW (1995). Food Security: A brief review of concepts and indicators. In MulatDemeke et al., (Eds.) (1995), Food Security, Nutrition and Poverty Alleviation in Ethiopia: Problem and Prospects. Proceeding of Inaugural and First Annual Conference of the Agricultural Economics Society of Ethiopia, Addis Ababa. |
|
|
|
Degefa T (1996). Belg Crop Production as a Strategy of Households' Food Security: A Comparative Study of Belg Grower and Non-Belg Farmers in MunessaWereda, Arsi Zone. MA. Thesis, Addis Ababa University. |
|
|
|
Devereux S (2010). Food Security in Ethiopia, Discussion Paper for Department for International Development (DFID), Sussex University. |
|
|
|
Eshetu B (2000). The UnderlyingCauses of Household Food Insecurity and Coping Strategies. The Case of LigamboWereda, South Wollo Zone, Amhara Region, Northern Ethiopia.MA Thesis, Addis Ababa University. |
|
|
|
FAO (2008). Climate Change and Food Security: A Framework Document. Food and Agriculture Organization of the United Nations, Rome, Italy. |
|
|
|
FAO (2003) Agricultural Extension, Rural Development and the Food Security Challenge: Extension, Education and Communication Service Research Extension and Training Division. Sustainable Development Department, Rome. |
|
|
|
FDRE FSS (1996). Federal Democratic Republic of Ethiopia: Food Security Strategy Document. Addis Ababa, Ethiopia. |
|
|
Hadleya C, Linzerb DA, Tefera B, Abebe G, Fasil T, Lindstrome D (2011). Household capacities, vulnerabilities and food insecurity: Shifts in food insecurity in urban and rural Ethiopia during the 2008 food crisis. J. Soc. Sci. Med. 73(10):1534–1542.
Crossref |
|
|
|
Hailu M (2012). Causes of household food insecurity in rural BosetWoreda: Causes, extent and coping mechanisms to food insecurity. Germany: Lap Lambert Academic Publishing. |
|
|
|
Hamza I, Iyela A (2012). Land Use Pattern, Climate Change, and its Implication for Food Security in Ethiopia, A review. Ethiop. J. Environ. Stud. Manage. 5(1):26:31. |
|
|
|
IPCC (2007). Climate Change: Impacts, Adaptation and Vulnerability, Contribution of Working Group II to the Third Assessment Report of the Inter governmental Panel on Climate Change (Cambridge University of Press, Cambridge, UK). |
|
|
|
Marius K (2009). Climate Risks and Development Projects Assessment Report for a Community-Level Project in Guduru, Oromiya, Ethiopia. |
|
|
|
Markos E (1997). Demographic Responses to Ecological Degradation and Food insecurity: Drought Prone areas in Northern Ethiopia. Amsterdam. Thesis Publishers Ph.D. Dissertation. |
|
|
|
Maxwell D, Smith M (1992). Household Food Security: a Conceptual Review. In: Maxwell S, Frankenberger, T. Household Food Security: Concepts, Indicators, Measurements. IFAD and UNICEF, Rome and New York. |
|
|
|
Mesay M (2001). A study on Rural Households's Food Security Status: The case of RuyuuWoredaOromiya State. MA. Thesis in Addis Ababa University. |
|
|
|
Mesay M (2010). Food Security Attainment Role of Urban Agriculture: a Case Study fromAdama Town, Central Ethiopia. J. Sustain. Dev. Afr. 12(3):223-250 |
|
|
|
Ministry of Agriculture and Rural Development (MARD) (2009) Agricultural Investment Potential of Ethiopia. FDRE, Ministry of Agriculture and Rural Development. |
|
|
|
Seyoum M (2012). The contribution of Maize Technology Towards Household Food Security: The case of AsosaWoreda, Benshangulgumz, Ethiopia. Msc.Thesis, Addis Ababa University. |
|
|
|
Tilaye TW (2004). Food Insecurity: Extent, Determinants and Household Copping Mechanisms in Gera Keya Woreda, Amhara Region. MA. Thesis, Addis Ababa University. |
|
|
|
Tsegaye GH (2009). Determinants of Food Security in Rural Household of Tigray Region,Master Thesis, Addis Ababa University, Ethiopia. |
|
|
|
UNDP (2007). Fighting Climate Change. Human Development Report 2007/2008. |
|
|
|
USAID (2010). Ethiopia: Fiscal Year Implementation Plan Report. Feed the World Initiative. Washington, USA. |
|
|
|
World Bank (WB) (2008). Ethiopia Agriculture and Rural Development Public Expenditure Review 1997/98-2005/6 Report no 41902-Et Washington Dc, World Bank. |
|
|
|
WFP (2009). World Food Program: Division of Communication, Public Policy and Private Partnerships viacesareGivlioviola, 68/70-00148, Rome, Italy. |
|
|
|
Woldeamlak B (2009). Rainwater Harvesting as a Livelihood Strategy in the Drought-Prone Areas of the Amhara Regions of Ethiopia, OSSEREA Publications. |
APPENDIX