ABSTRACT
Increasing productivity through enhancing efficiency in cereal production in general and in wheat production in particular could be an important pace towards achieving food security. However, the strategic conceptual and empirical analysis in the context of the efficiency, which would guide policy makers and development practitioners in their efforts to revamp cereal productivity, is sparse. This study was undertaken to assess the technical efficiency and factors affecting efficiency of wheat production in Welmera district of Oromia region, Ethiopia. The primary data pertaining to farm production, input usage, and socioeconomic and institutional factors were collected during 2012/13 cropping year through a structured questionnaire from randomly selected 180 wheat farmers. The stochastic frontier and translog functional form with a one-step approach were employed to assess efficiency and factors affecting efficiency in wheat production. The maximum likelihood estimates for the inefficiency parameter depicted that most farmers in the study area were not efficient. The mean technical efficiency was found to be 57%. Factors such as sex, age and education level of the household head, livestock holding, group membership, farm size, fragmentation, tenure status and investment in inorganic fertilizers affect efficiency positively and distance to all weather roads negatively. The finding implies that there is an opportunity to improve technical efficiency among the farmers by 43% through gender-sensitive agricultural intervention, group approach extension, and attention to farmers’ education, scaling out of best farm practices.
Key words: Smallholder wheat farms, translog production function, technical efficiency.
In Ethiopia, agriculture is the major option for stimulating growth, overcoming poverty, enhancing food security and improving distribution of income among the poor households. It contributes about 42% to the total gross domestic product (GDP), provides 85% of employment opportunities, constitutes more than 80% of the nation’s total exports, and provides most of the foreign exchange earnings to the economy (EPA, 2012). It also plays an important role in providing raw materials for domestic industries. Thus, Ethiopia’s Growth and Transformation Plan (GTP I) set higher growth and investment targets in agricultural sector in general and in wheat production in particular than any of earlier Ethiopia’s national plan and will receive a special attention in the next five year plan (GTP II) (MoFED, 2010). Cereal production and marketing are the means of livelihood for millions of smallholder households and making it the single largest sub-sector in Ethiopian economy. Cereal accounts for roughly 60% of rural employment, 80% of total cultivated land, more than 40% of a typical household’s food expenditure, and more than 60% of total caloric intake, represents about 30% of GDP (World Bank, 2007). Following maize, wheat is the second most important and productive cereal crop and its productivity shows increasing pattern (for example increased from 18.39 to 2.1 tons per hectare in 2010/2011 and 2012/2013 cropping season, respectively (CSA, 2010, 2013).
Following South Africa, Ethiopia is the second largest producer of wheat in sub-Saharan Africa. At a national level about 1.63 million ha wheat was distributed with about 4.84 million smallholder farmers (CSA, 2013). Wheat is cultivated in the highlands of Ethiopia, mainly in Oromia, Amhara, Southern Nations and Nationalities Peoples (SNNP) and Tigray regions (CSA, 2013) and it is the first most important staple crop in Welmera district. Currently, wheat is among a few crops which have received special attention from the Government of Ethiopia and NGOs operating in the country. In this regard, the government has paid attention to research and extension of wheat technologies. Moreover, Ethiopia has become a center of diversity in Eastern Africa for its wheat crop (EAAPP, 2009).
Despite the importance of wheat as a food and industrial crop and the efforts made so far to generate and disseminate improved production technologies, its productivity remains below its potential. The average wheat yield was about 2.1 tons per hectare, in 2012/2013 cropping season (CSA, 2013). Ethiopia’s current annual wheat production of approximately 3.18 million tons is insufficient to meet domestic needs, forcing the country to import 30 to 50% of the annual wheat grain required. Therefore, these facts show that Ethiopia is the net importer of wheat to feed its growing population. Moreover, the yield gap of over 3 tons per hectare suggests that there is a potential for increasing production and productivity of smallholder wheat farmers.
Some previous studies have indicated that farm production and productivity can possibly be raised (1) by allocating more area for production, (2) by developing and adopting of new wheat technologies, and/or (3) by utilizing the available resources more efficiently (Ahmed et al., 2013; Kamruzzaman and Mohammad, 2008; Haji, 2006). Opting for the first method would mean trying to boost output at the cost of bringing marginal areas into cultivation. Some other authors also argued that with limited available suitable land especially in the highlands for cultivated area expansion, increased cereal production and productivity will need to come from yield upgrading (Bezabeh et al., 2014; Taffesse et al., 2012). On the other hand, creation and introduction of new technologies is a long term option and requires a lot of capital for research and extension. Rather, efficient utilization of available resources is the best way of increasing production especially in the short run.
According to previous researches in Ethiopia, there also exists a wide cereal yield gap among the farmers that might be attributed to many factors such as lack of knowledge and information on how to use new crop technologies, poor management, biotic, climate factors and more others (Debebe et al., 2015; Ahmed et al., 2013; Yami et al., 2013).
Because of the scanty resources that are on ground, recently it is getting importance to use these resources at the optimum level which can be determined by efficiency searches (Gebregziabher et al., 2012; Asefa, 2012; Alene et al., 2006). Thus, increasing wheat production and productivity among smallholder producers requires a good knowledge of the current efficiency or inefficiency level inherent in the sector as well as factors responsible for this level of efficiency or inefficiency. However, previous studies in the area of wheat production efficiency are not extensive and crop specific, and are also area specific (Wassie, 2014; Yami et al., 2013; Mussa et al., 2012; Kebede and Adenew, 2011; Alene and Zeller, 2005). These studies have been at the household level ignoring the possible differences in bio-physical conditions at the plot level, and also their findings are not consistent with one another due to various reasons like agro ecological and methodological variations. Moreover, based on these literature reviews and to the best of the information we have, no studies have estimated technical efficiency of wheat farmers in Welmera district. That is, information on the levels of farm household technical efficiency and its determinant factors is lacking in the study area.
Therefore, the present study is an attempt towards assessing the technical efficiency of the farmers in the study area and aims to bridge the prevailing information gap on the contextual factors contributing to efficiency differentials in the production of wheat. The objective of the study is to measure technical efficiency of wheat production and to identify variables affecting technical efficiency of wheat producing farmers.
Study area
The study was conducted in Welmera district of Addis Ababa Zuria Special zone of Oromia, Regional State in Ethiopia. Welmera district is one of the eight administrative units of the Addis Ababa Zuria Special zone of Oromia Regional State. Geographically, the district is located between 8°50'-9°15'N latitude and 38°25'-38°45'E longitude and has area coverage of 66,247 ha (WORLA, 2011). Most of its areas are high lands (Dega) and mid highlands (Weyna Dega) with an altitude ranging from 2060 to 3380 m above sea level. Majority of the soil is reddish-brown clayey type similar to some other highland areas of Ethiopia (Asefa, 2012). The district is sub-divided in to 23 rural kebele (Kebele is the lowest administrative unit under Ethiopian condition) administrations and one town, excluding the capital town of the district. The area is characterized by mixed crop-livestock farming systems like other central highlands of Ethiopia where both crop and livestock production play a central role in the lives of the farming community. Wheat is the first major staple crop followed by barley, tef, pulses, oilseed, potato and other crops, respectively in the area. In 2011/2012 cropping season, about 33% of the crop land was covered by wheat (WOA, 2012).
Sampling procedure
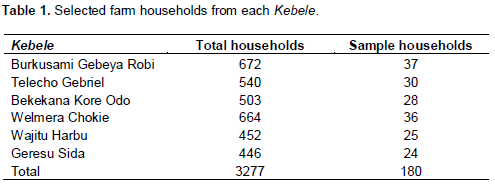
In order to select sample farm households, a three-stage sampling technique was employed. In the first stage, study district was purposively selected based on the extent of wheat production. In the second stage, six kebeles were selected from the selected district based on the discussion with district level agricultural extension experts. Finally, from up-to-date list of sampling frame (wheat growers) obtained from extension offices at each Kebele level, 180 sample households were selected using systematic random sampling. The sample size was determined by adopting a sample size determination formula provided by Statistics Canada (2010).
Data source and collection
This study used the data collected from primary sources for 2012/2013 production season. To supplement the primary data, secondary data were collected from concerned district offices (like Agricultural Office, Holetta Agricultural Research Center (HARC) and Cooperative Offices) and from published and unpublished sources. The data is cross-sectional and quantitative in nature. Primary data contained detailed information on households’ socioeconomic and demographic characteristics, farm charac-teristics, inputs utilization, output produced, institutional, policy related variables and production problems encountered were collected from the selected farm households using structured questionnaires filled by trained enumerators who are fluent in the local language. Close supervision and day to day check up was done by the researcher. The survey was conducted from July to August, 2013.
Data analysis
To achieve the study’s objectives, both descriptive and inferential statistics were used. Descriptive statistics like means, standard deviations, percentages and frequency counts were used in describing socioeconomic characteristics of households, inputs, output variables, frequency distribution efficiency levels and responses on the constraints of wheat production. The stochastic frontier production function and the inefficiency model are simultaneously estimated with the maximum likelihood method using the econometric software, FRONTIER 4.1 computer programme.
Analytical framework
In this study, the stochastic frontier analysis approach was adopted to measure the technical efficiency of wheat farms. The model was independently proposed by Aigner et al. (1977) and Meeusen and Broeck (1977). The merits for this approach over Data Envelopment Analysis (DEA) (non-parametric) is that it accounts for a composite error term (one for statistical noise and another for technical inefficiency effects) in the specification and estimation of the frontier production function. For a number of reasons, the stochastic frontier analysis (econometric) approach has generally been preferred in the empirical application of stochastic production function model in the developing countries’ agriculture like Ethiopia. This might be due to first the assumption that all deviations from the frontier arise from inefficiency as postulated by DEA is hard to accept, given the inherent variability of smallholder agricultural production due to external factors like pests and weather conditions. Second, most farms are very small and operated by family labor and hence farm records kept rarely. The available data on wheat production are most likely subject to measurement errors. Therefore, the stochastic frontier production required for estimating plot level efficiency is specified as:

where Y
i denotes the output for the i
th sample farm, X
i represents a (1 × K) vector whose values are functions of inputs and explanatory variables for the i
th farm, β is a (K × 1) vector of unknown production parameters to be estimated, V
is are assumed to be independent and identically distributed random errors which have normal distribution with mean zero and unknown variables,
and U
is are non-negative unobservable associated with the technical inefficiency of production such that for a given technology and levels of inputs, the observed output falls short of its potential output

or it is a one-sided error term (U ≥ 0) efficiency component that represents the technical inefficiency of the farm. In short, U
i estimates the shortfall in output Y
i of wheat from its maximum value given by the stochastic frontier function.
In other words, the basis of a frontier function can be illustrated with a farm using n inputs for wheat (X1,X2,….., Xn) to produce output Y of wheat. Efficient transformation of inputs into output is characterized by the production function f(Xi), which shows the maximum output obtainable from various input vectors. The stochastic frontier production function assumes the presence of technical inefficiency of production. Hence, the function is defined as:
Where

is the error term that is composed of two elements, and plot level data was collected from a total of n=252 wheat plots.
The stochastic frontier analysis has been used in many studies like by Yami et al. (2013), Beshir et al. (2012), Jaime and Salazar (2011), Tan et al. (2010), and Daniel et al. (2008) and the approach specifies technical efficiency as the ratio of the observed output to the frontier output, that means the technical efficiency of an individual farmer or farm is defined as the ratio of observed output and the corresponding frontier output, given the state of available technology, and presented as follows:
where F (X
i;β).exp(v
i-u
i) is the observed output (Y) and F (X
i;β).exp(v
i) is the frontier output(Y
*). Pursuing Battese and Coelli (1995), the error term (v
i) permits random variations in output due to factors outside the control of the farmer like weather and diseases as well as measurement error in the output variable, and is assumed to be identically, independently and normally distributed with mean zero and constant variance
The u
i is the inefficiency component of the error term and a one-sided non-negative (u>0) random variable, is assumed to be independently distributed as truncations at µ of the normal distribution and variance
but if u
i = 0, the assumed distribution is half-normal. The technical inefficiency model suggested by Battese and Coelli (1995) is illustrated by:
where Zi is a (1 × M) vector of exogenous explanatory variables associated with the technical inefficiency effects in the ith time period, δi is an (M × 1) vector of unknown parameter to be estimated.
As mentioned earlier in the literature review, this study employed the single stage maximum likelihood estimation method used in estimating the technical efficiency levels and its determinants simultaneously. This estimation procedure guarantees that the assumption of independent distribution of the inefficiency error term is not violated. The maximum likelihood estimation of the stochastic frontier model yields the estimate for beta (β), sigma squared (σ
2) and gamma (γ), and are variance parameters; γ measures the total variation of observed output from its frontier output. The study used the parameterization following Battese and Coelli (1995) and is given as,
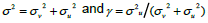
where the gamma lies between zero and one (0 ≤ γ ≤ 1). If the value is very close to zero, then the deviations are as a result of random factors and/or if the value is very close to 1, then the deviations are as a result of inefficiency factors from the frontier.
Model specification
Following Aigner et al. (1977), the translog production function has been used recently by many studies to estimate technical inefficiency (Geta et al., 2013; Yami et al., 2013; Beshir et al., 2012). Therefore, the translog production function stated in Equation 6 is used for the study for its flexibility for which it places no restriction unlike the Cobb-Douglas production function.
where i=1,2,- - - n=252, and X= vector of five input variables.
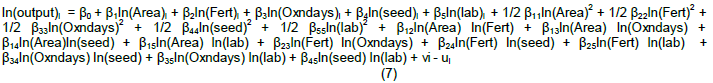
Based on the aforementioned model, a stochastic frontier model for wheat farmers is given by:
where output represents total yield of the ith plot in kilo gram (kg); Area represents operational area of wheat of the ith plot in hectare (ha); Fert represents the total amount of inorganic fertilizers used per plot in kg; Oxndays represents the amount of oxen days used for plowing from land preparation to planting, Seed represents the amount of seed used per plot in kg; Lab represents the total cost of labour per day estimated at market price, and in Ethiopia farmers use herbicides instead of hand weeding, therefore, it is included that the cost of herbicide per liter estimated at market price in the total cost of labour for different farm activities, and ln represents Natural logarithm.
The specification of inefficiency model for the target commodity of individual producer is given as:


where Sex is 1 if the household head is male, 0 otherwise; Age represents the age of the household in years; Educ stands for the education level of the household in years of formal education completed; Fsize stands for the size of the family, is converted into the same unit (Labour Force); Proxwroad is the distance from the household residence to the nearest all weather road in walking minutes; Acredit is the amount of agricultural credit received in Ethiopian Birr (ETB; Birr is the Ethiopian currency); Livestock represents the number of livestock owned in TLU; Offrmy is cash income earned from off-farm activities in ETB; Gpmemship is a dummy variable with a value =1 if the household participate in more than one farmers group, 0 otherwise; Ext stands for the number of extension contact (made with DAs and experts); Train stands for the number of trainings (on new varieties, diseases and pests, crop management) taken; Farm size stands for the total area of farm land under operation (own land + rented in + share in) in hectare; Frgmnt stands for land fragmentation, the number of wheat plots; Tenurstatus is a dummy variable, with a value of 1 if the ith farmer used his own farm plot, 0 otherwise, and Costfert stands for the proportional cost of chemical fertilizer to its variable costs incurred by the ith farmer per plot measured in ETB during 2012 cropping season.
Hypotheses testing
In spite of the magnitude and significance of the variable parameter, γ, it is also important to explain the various null hypotheses employed in this work. Three hypotheses were tested to scrutinize the adequacy of the specified model used in this study, the presence of inefficiency and exogenous variables to explain inefficiency among smallholder wheat producers. The generalized likelihood ratio statistics was used to test the hypotheses. It is specified as:
where L(H0) and L(H1) are the values of the likelihood functions derived from restricted (null) and unrestricted (alternative) hypothesis. This has a chi-square distribution with degree of freedom equal to the difference between the numbers of estimated parameters under H1 and H0. Yet, where the test involves a γ, then the mixed chi-square distribution is used. The H0 is rejected when the estimated chi-square is greater than the critical.
Descriptive statistics
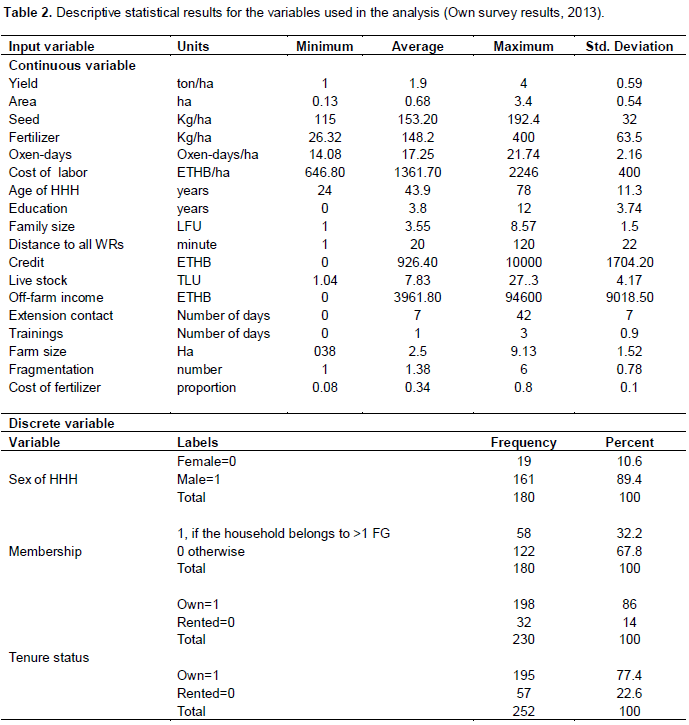
The results of descriptive statistics for the entire variables considered are presented in Table 2 for their mean, minimum, maximum and standard deviation values for continuous variables and frequencies and percents for discrete variables. The result shows that the average wheat productivity was 1.9 ton/ha and relatively lower than the national average of 2.11 ton/ha for the same cropping season (CSA, 2013). The yield was obtained by using 153.2 kg/ha of seed, 134.46 kg/ha of fertilizers (DAP + Urea), 17.25 oxen days/ha and 1282.9 ETB/ha of cost of labor incurred including the cost of herbicides (substituted for labor weed). The average size of farm allocated for wheat was 0.68 ha from a total average of 2.5 ha. This indicates that an average household allocated more than 27% of the farm land for wheat.
The average size of the household in labor force unit (LFU; is a conversion factor estimated by categorizing the age groups into nine and identifying six major farm activities (herding and domestic chores, land preparation, planting, weeding, harvesting and threshing, and transporting) with key informants through FGDs, then the key informants asked to give weight (0 to 4) to each activity for each age group, the weight was aggregated and divided by four times six = “1” is set equal to an able-bodied adult equivalent) was 3.55. The conversion factor used in estimating family members into LFU varies according to circumstances. In the developed countries, family size, labor power and dependency ratio has been estimated simply by counting the number of individuals whose age fall in defined “working-age group” or ‘dependent” ranges using the standard method. Sharp (2003) felt the standard method inadequate and used an innovative approach to estimating the actual labor capacity of family members based on his fieldwork (survey) in the study of measuring destitution. This study also felt the work of Sharp is inadequate to the context of the study area, because it ignores the supply of labor by elderly people who are over 60 years old and did not consider gender differential in labor supply for the different agricultural activities. Therefore, the study used a (LFU) conversion factor obtained from own informal qualitative survey through conducting six focal group discussions at each Kebele (Appendix).
The average livestock holding for sample households was 7.83 TLU, earned an average off-farm income of 3961.60 ETB, the average amount of credit received by households was 926.40 ETB, the average number of wheat plot was one ranging from 1 to 6, and about 34% of production expenditure was incurred for applying fertilizers compared to its variable costs. The average number of contact made by extension staffs with wheat household for crop related information was 7, and wheat growers received a one day crop specific trainings. Membership in a farmers’ group (MFG) indexes social group. All of the households (100%) reported that they are organized in one to five farmer groups and 32% of the households reported that they belonging to more than one farmer’s group either in crop production and/or in dairy cooperatives. On average the sample households spend about 20 min walk to reach the nearest all weather roads.
Estimation of stochastic frontier production
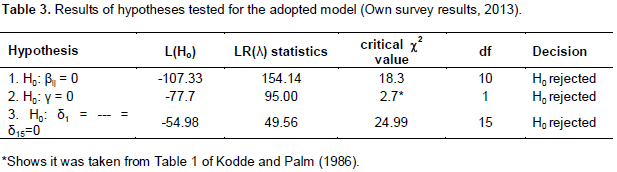
Before proceeding to the analyses of technical efficiency and its determinants, it was necessary to select the appropriate functional form and detect the presence of inefficiency in the production of wheat for the sample households. In a one step modeling approach, both Cobb-Douglas and translog frontier model can be used. Various restrictions were imposed on the model defined by 4 and 6. To check whether these restrictions were valid or not, the generalized likelihood ratio tests were used. The results of these tests of hypothesis for parameters of the stochastic frontier and inefficiency effects model for wheat farms in Welmera district are presented in Table 3. The first null hypothesis tested was that the coefficients of the interaction terms of input variables are zero favoring the Cobb-Douglas functional form (H0: βij = 0). The values of the logarithm of likelihood function for Cobb-Douglas and translog frontier model were -107.33 and 30.25, respectively. Therefore, the generalized likelihood ratio test is used to decide the functional form as follows:

The value of the likelihood ratio statistics was found to be 154.16 and greater than the critical χ2 value of 18.3 with 10 degree of freedom at 5% level of significance. the null hypothesis was rejected and thus the translog functional form is preferred to Cobb-Douglas functional form for the data and more precise and consistent results. The second null hypothesis which specifies technical inefficiency effects are absent in the model (H0: γ = δ0 = δ1 = --- =δ15 =0), or all wheat farmers/farms efficient in the study area were tested against the alternative (H1: γ > 0 and δi ≠ 0 where i = 0,1, ---, 15) rejected with generalized likelihood ratio test statistic of 95 which was larger than 2.7 critical values at 5% significance level with 1 degree of freedom (Table 1) (Kodde and Palm, 1986) implying that the stochastic production function had a better fit to the data than the average production functions. In short, H0: γ = 0, all wheat producers/farms are 100% efficient and is strongly rejected. This indicates that the ex-planatory variables specified in the model make a significant contribution in explaining the inefficiency effect associated with wheat production in the study sites. The third null hypothesis, H0: δ1 = --- δ15=0, which specifies that the coefficients of the explanatory variables in the efficiency model are simultaneously zero and is strongly rejected with generalized likelihood ratio test statistics of 49.56 which was greater than 24.99 critical values with 15 degree of freedom and at 5% level of significance. This implies that there were firm-specific factors which influence upon the level of technical inefficiencies among the sampled households or farms. Similar results have been obtained by Geta et al. (2013), Yami et al. (2013) and Beshir et al. (2012).


Estimates of parameters
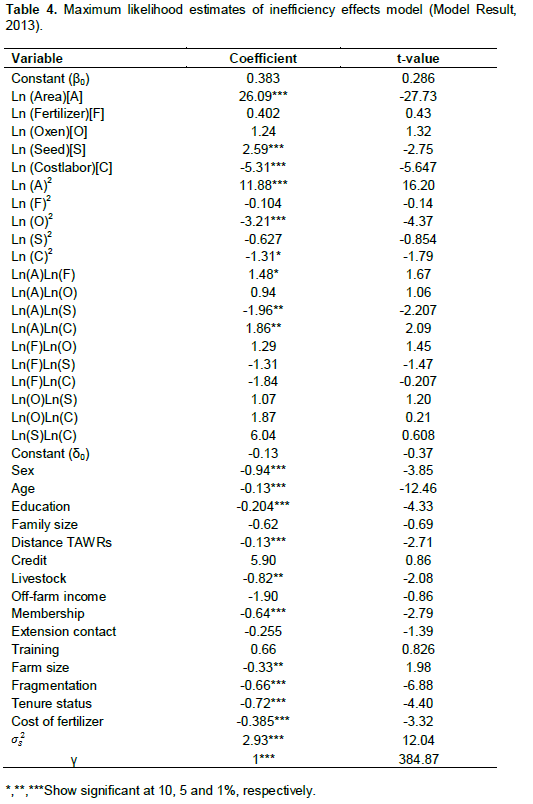
The maximum likelihood estimates of the parameters of the stochastic frontier production function (SFPF) and inefficiency model for wheat farms in Welmera district defined by Equations 4 and 6 are presented in Table 4. In the frontier model, the coefficients of wheat land and seed used were positive and significant implying that an increase to some optimum level in these inputs would increase wheat output. The coefficients of labor cost including herbicide was negative and significant in wheat cultivation implying that an increase in labor cost for wheat production would likely to reduce wheat productivity. The coefficients of interaction between wheat area and fertilizer, and area and cost of labor (the variable used to capture labor) were positive and significant implying that an increase in these inputs would increase wheat yield.
The maximum likelihood estimates for the parameter γ was nearly 1 at 1% level of significance. This indicates that 100% of the variation in output of wheat is probably due to the inefficiency effects of farmer’s specific attributes. Thus, farm productivity differentials mainly related to the variation in wheat farms management at farmers condition. The mean technical efficiency level of wheat farms in the study site was 0.57, and ranged from 0.23 to 0.99 indicating that farmers are only producing on average 57% percent of their maximum possible output level, given the state of technology at their hand. This demonstrates there is an opportunity to improve technical efficiency among the farmers or farms and then increase wheat productivity by 43% from existing practice, input use and state of technology.
Determinants of technical efficiency
With regard to the sources of technical efficiency differentials among sample farmers, the estimates of technical inefficiency effects model provide some important insights. Out of the fifteen variables used, ten variables (gender which is replaced by sex, age, education, and distance to all weather roads, livestock holding, group membership, farm size, farm fragmentation, tenure status and investment on fertilizers) were found to affect significantly the inefficiency of wheat farmers.
The sex of the household head is significantly negative at 1% level of significance as was expected, indicating that male headed households operating more efficiently than their female counterparts. This result is in line with the study by Daniel et al. (2008) and Kibaara and Kavoi (2012), and it is in contrast with the study by Yami et al. (2013) in selected waterlogged areas of Ethiopia.
The age coefficient in the inefficiency model is negative and statistically significant at 1% as was expected. This shows that older farmers tend to be more efficient than younger ones. Older farmers may take benefit of their experiences to use inputs more efficiently to wheat production. Hence, age of farmers is an important factor in improving the efficiency of farms. This result is in line with the study by Chiona et al. (2014), Mazumder and Gupta (2013), Dlamini et al. (2012), and Asogwa et al. (2012) and in contrast with many other studies (Yami et al., 2013; Simonyan et al., 2011; Jaime and Salazar, 2011).
The coefficient of education in years of schooling is negative in wheat cultivation as a priori expectation. The level of education is statistically significant at 1% in affecting the technical inefficiency in wheat production. Education improves the ability of the household to make informed decision about production inputs. Educated farmers more often have better access to agricultural information and higher tendency to adopt and utilize improved inputs (like fertilizers and crop varieties) more optimally and efficiently. This result is in line with the study by Geta et al. (2013), Yami et al. (2013) and Asogwa et al. (2012).
The coefficients of distance to all weather roads is negative and significant at 1% significance level which was not in the priori expectation, indicating that farmers living with distant areas from all weather roads operate more farm activities efficiently than the nearby farmers. This might be related to the availability of more off-farm activities near to all weather roads and farmers more likely spent more times outside their farm. In the study area, there are a number of flower farms and other cement factories as a reason for farmers participating in off-farm activities and operating with less efficiency for their wheat production.
The coefficient of livestock in tropical livestock unit is negative and significant at 5% significance level in wheat production. This might be because livestock provides manure as fertilizer, cash to finance input expenses and draught power. This result is similar with the study by Beshir et al. (2012) and Mohammed et al. (2000).
The coefficient of group membership in the inefficiency effect model is negative and statistically significant at 1% significance level as it was expected, indicating that farmers involved in more than one farmers’ group manage their wheat plots efficiently than farmers involved only in one farmers’ group. This indicates that farmers who belong to a more technical group are most likely to benefit from better access to information on improved inputs and practices. This result is in line with the study by Daniel et al. (2008) and Kariuki et al. (2008).
Farm size is mainly justified on the view that those farmers with large farm size can better diversify their crops and the better chance for wheat to be planted on fertile soils. In this study, there was a negative and statistically significant relationship between farm size and technical inefficiency. This result is in line with the study by Geta et al. (2013) and Beshir et al. (2012) found that farm size had a significant negative effect on farmers’ inefficiency in maize production.
The variable land fragmentation represents the number of parcels of land on which farmers allocated for their wheat production. It was hypothesized that a farmer with more number of plots is more efficient than their counterparts who had less number of plots. The reason for this might be they are able to distribute family labor for different farm activities and there will be a chance to allocate farms with good soil fertility status for wheat cultivation. The coefficient of fragmentation in the inefficiency effect model is negative and significant at 1% level of significance, suggesting having more plots in the crops under consideration improves the level of technical efficiency of farmers. This finding is consistent with the findings by Yami et al. (2013) and Tan et al. (2010).
Tenure status or land tenancy variable is included in the model to estimate the effects of tenancy status on the level of wheat growers’ technical inefficiencies. The estimated coefficient for tenure status (own dummy = 1, 0 otherwise) has a negative sign as it was in priori expectation. The result is statistically significant at 1% level of significance indicating that own operated farms are more efficient than tenants operated farms. The results is consistent with the findings of Kariuki et al. (2008) who found that a strong relationship between tenure security and technical efficiency.
Cost of fertilizers or investment on fertilizers is the variable mainly justified on the view that the more investment on the fertilizers by farmers can improve wheat productivity. The results of this study revealed that there was a negative and statistically significant (at 1% level of significance) relationship between investment on inorganic fertilizers and technical inefficiency. The result is in line with the study by Giannakas et al. (2001) identified a positive relationship between the level of technical efficiency and the use of inputs.
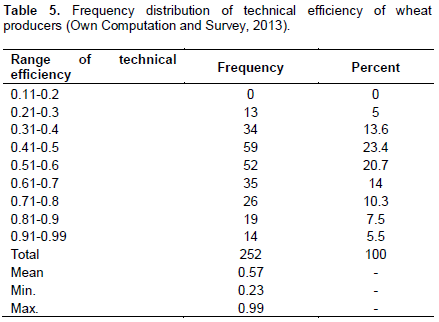
Distribution of technical efficiencies
The estimated mean technical efficiencies of wheat farms was found to be 0.57, indicating that farmers were only producing 57% of their maximum possible output level given the state of the technology at their disposal. This also suggests that there exist more potential for increasing wheat production by adopting best practices of best wheat producer. The frequency distribution of technical efficiency levels is presented in Table 5. The frequency distribution of technical efficiency levels was not fairly distributed. The mean predicted technical efficiency ranges from 0.23 to 0.99. Out of 100 farms, 42% of wheat farms were being operated below 51% level of technical efficiency. This implies that a large number of wheat farms in the sample faced inefficiency problems. Out of 100 farms, about 35% of the farms are being operated between the efficiency level of 51 and 70% and only about 23% of wheat farms are being operated at a higher efficiency level between 71 and 99%, respectively (Table 5).
Major constraints to agriculture in the study area
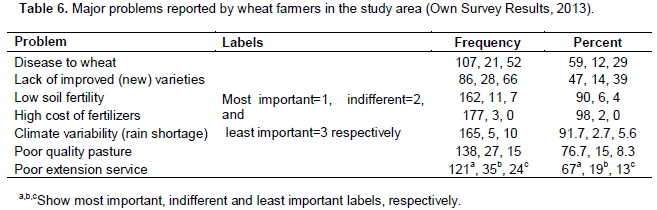
As shown in Table 6, about 90% of the household reported that soil fertility decline is the most serious problem for wheat production in the study area. This problem is aggravated by a sky rocketing fertilizer prices (98% households). About 91.7% of the households reported that climate variability (expressed in terms of shortage and untimely raining (late coming and early stop)). About 76.7% of the respondents reported that shortage of grazing land and low quality pasture for livestock are serious problems. About 47% of the households reported that there was lack of new improved varieties and quality seeds, 59% of the households reported that disease is the serious problem for wheat. These are major productivity problems that may result in higher yield gaps (Schneider and Anderson, 2010).
CONCLUSION AND POLICY IMPLICATIONS
The main objective dealt with in this study was to assess the technical efficiency of wheat smallholder producers and its determinant factors in Welmera district of Oromia region, highland of Ethiopia. The study used the farm-level data collected from a total of 180 households and 252 plots and estimated the stochastic frontier production function by incorporating inefficiency effects using a one-step approach.
It is found that smallholder wheat farmers are inefficient in resources used in the production of wheat in the study area. The results of efficiency analysis show that the mean technical efficiencies were 57% ranging between 23 and 99%. This suggests that farmers are not operating at the possibility production frontier and there is a considerable potential to increase the productivity of wheat with the present technologies and inputs available to smallholder wheat farmers. The distribution of farm level measures of technical efficiency shows that about 42% of wheat farms are operating below 51% level of technical efficiency, 35% of farms are found between the efficiency level of 51 and 70% technical efficiency and about 23% of farms are well operating between 71 and 99% level of technical efficiency.
The analysis of the relationships between technical efficiency and socioeconomic variables expected to have effect on wheat farm efficiency were inspected. The identified determinants of technical efficiency were gender, age, education, and distance to all weather roads, livestock holding, group membership, farm size, fragmentation, tenure status and investment on inorganic fertilizers.
Farmers reported that soil fertility decline, climate variability, rising prices of fertilizers, lack of new improved crop varieties and quality seed, crop disease and shortage of grazing land together with low quality pasture were the most important problems to the study area which needs appropriate policy intervention to address these problems.
Therefore, the results of this study give information to policy makers on how to improve the technical efficiency and optimal use of resources in the study area. The following policy recommendations have been drawn based on the results of the study.
First, using best practices of the efficient farmers as a point of reference would help setting targets in improving efficiency levels and finding the feebleness of the present farm practices. The relatively efficient farms can also improve their efficiency more through learning the best resource allocation decision from others. This can be achieved by arranging field days, cross-visits, creating forum for experience sharing with elder households, on job trainings and demonstration on the efficient farms.
Second, it is important to give due attention for farmers education through establishing and strengthening informal education and short term trainings by using the available human and infrastructural facilities like extension agents and Farmers Training Centers (FTCs). Third, initiate and support gender-sensitive agricultural intervention to improve female headed farm inefficiency. Fourth, strengthening the existing farmers groups be it formal or informal and promoting the formation of other farmers groups.
Fifth, policy initiatives that improve the livestock holding of farmers through improved livestock breeds, forage and nutrition and health services have to be put in place. Sixth, as farm size and fragmentation have a positive relationship with technical efficiency, support programs that can absorb an exploited farm labor through off-activities in urban and peri-urban areas. Seventh, encourage farmers to invest on soil fertility enhancement activities by reducing the cost of production.
Finally, the study recommends further empirical work to be conducted on the effects of infrastructures like roads on technical efficiency using a large number observation.
The authors have not declared any conflict of interests.
The authors are very grateful to East African Agriculture Productivity Project of the Ethiopian Institute of Agricultural Research for covering all the necessary study costs.
REFERENCES
|
Aigner D, Lovell CAK, Schmidt P (1977). Formulation and estimation of stochastic production function models. J. Econom. 6(1):21-37.
Crossref
|
|
|
|
Ahmed B, Haji J, Geta E (2013). Analysis of Farm Households' Technical Efficiency in Production of Smallholder Farmers: The Case of Girawa District, Ethiopia. Am.-Eur. J. Agric. Environ. Sci. 13(12): 1615-1621.
|
|
|
|
|
Alene DA, Manyong MV, Gockowski J (2006). The production efficiency of intercropping annual and perennial crops in Southern Ethiopia: A comparison of distance functions and production frontier. ELSVIER J. Agric. Syst. 91:57-70.
Crossref
|
|
|
|
|
Alene DA, Zeller M (2005). Technology adoption and farmer efficiency in multiple crops production in eastern Ethiopia: A comparison of parametric and non-parametric distance functions. Agric. Econ. Rev. 6(1):5-17.
|
|
|
|
|
Asefa S (2012). Who is technically efficient in Crop Production in Tigray Region, Ethiopia? Stochastic Frontier Approach. Glob. Adv. Res. J. Agric. Sci. 1(7):191-200.
|
|
|
|
|
Asogwa BC, Umeh J, Penda ST (2012). Technical efficiency analysis of smallholder farmers in rural and periurban areas of Nigeria. J. Hum. Ecol. 37(1):57-66.
|
|
|
|
|
Battese GE, Coelli TJ (1995). A model for technical inefficiency effect in stochastic frontier production for panel data. Empir. Econ. 20:325-332.
Crossref
|
|
|
|
|
Beshir H, Emana B, Kassa B, Haji J (2012). Economic efficiency of mixed crop-livestock production system in the North eastern highlands of Ethiopia: the stochastic frontier approach. J. Agric. Econ. Dev. 1(1):10-20.
|
|
|
|
|
Bezabeh E, Haregewoin T, Hailegiorgis D, Daniel F, Belay B (2014). Change And Growth Rate Analysis In Area, Yield And Production Of Wheat In Ethiopia. Int. J. Dev. Res. 4(10):1994-1995.
|
|
|
|
|
Chiona S, Kalinda Th, Tembo G (2014). Stochastic Frontier Analysis of the Technical Efficiency of Smallholder Maize Farmers in Central Province, Zambia. J. Agric. Sci. 6(10):108-118.
Crossref
|
|
|
|
|
CSA (Central Statistical Agency) (2013). Area and Production of major crops: Statistical Bulletin, No. 532.
|
|
|
|
|
CSA (Central Statistical Agency) (2010). Area and Production of major crops: Statistical Bulletin, Vol. 1.
|
|
|
|
|
Daniel S, Bravo –Ureta BE, Quiroga RE (2008). Technical efficiency among peasant farmers participating in natural resource management in Central America. J. Agric. Econ. 60(1):202-219.
|
|
|
|
|
Debebe S, Haji J, Goshu D, Edriss KA (2015). Technical, allocative, and economic efficiency among smallholder maize farmers in Southwestern Ethiopia: Parametric approach. J. Dev. Agric. Econ. 7(8):282-291.
Crossref
|
|
|
|
|
Dlamini IS, Masuku BM, Rugambisa IS (2012). Technical efficiency of maize production in Swaziland: A stochastic frontier approach. Afr. J. Agric. Res. 7(42):5628-5636.
Crossref
|
|
|
|
|
EAAPP (East Africa Agricultural Productivity Program) (2009). A report on Integrated safeguards Datasheet Appraisal Stage. No. 47820. Retrieved from
View
|
|
|
|
|
Gebregziabher G, Namara RE, Holden S (2012). Technical Efficiency of Irrigated and Rain-Fed Smallholder Agriculture in Tigray, Ethiopia: A Comparative Stochastic Frontier Production Function Analysis. Quart. J. Int. Agric. 51(3):203-226.
|
|
|
|
|
Geta E, Bogale A, Kassa B, Elias E (2013). Productivity and efficiency analysis of smallholder maize producers in Southern Ethiopia. J. Hum. Ecol. 41(1):67-75.
|
|
|
|
|
Giannakas K, Sctoney R, Tzouvelkas V (2001). Technical efficiency, technological change and output growth of wheat farms in saskatchwan. Can. J. Agric. Econ. 49:135-152.
Crossref
|
|
|
|
|
Haji J (2006). Production Efficiency of Smallholders' Vegetable-dominated Mixed Farming System in Eastern Ethiopia: A Non-Parametric Approach. J. Afr. Econ. 16(1):1-27.
Crossref
|
|
|
|
|
Jaime M, Salazar A (2011). Participation in organization, technical efficiency and territorial differences, a study of small wheat farmers in Chile. J. Agric. 71(1):104-113.
Crossref
|
|
|
|
|
Kamruzzaman M, Mohammad HI (2008). Technical efficiency of wheat growers in some selected sites of Dinajpur district of Bangladesh. Bang. J. Agric. Res. 33(3):363-373.
Crossref
|
|
|
|
|
Kariuk DK, Ritho CN, Munei K (2008). Analysis of the effect of land on technical efficiency of smallholder crop production in Kenya. A paper presented on International Research on Food Security, Tropentag.
|
|
|
|
|
Kebede K, Adenew B (2011). Analysis of Technical Efficiency: Lessons and Implications for Wheat Producing Commercial Farms in Ethiopia. J. Econ. Sustain. Dev. 2(8):39-47.
|
|
|
|
|
Kibaara BW, Kavoi MM (2012). Application of stochastic frontier approach model to assess technical efficiency in Kenya's maize production. JAGST 14(1).
|
|
|
|
|
Kodde DA, Palm CF (1986). Wald criteria for jointly testing equality and inequality restrictions. Econometrica 54(5):1243-1248.
Crossref
|
|
|
|
|
Mazumder R, Gupta M (2013). Technical efficiency and its determinants in backward agriculture: The case of paddy farmers of Hailakandi district of Assam. J. Reg. Dev. Plan. 2(1):35-53.
|
|
|
|
|
Meeusen W, Broeck JV (1977). Efficiency estimation from Cobb-Douglas production functions with composed error. Int. Econ. Rev. 18:435-444.
Crossref
|
|
|
|
|
MoFED (Ministry of Finance and Economic Development) (2010). Growth and Transformation Plan (GTP) 2010/11-2014/15 Draft
|
|
|
|
|
Mohammed H, Hassan F, Mwangi W, Belay K (2000). Factors influencing technical efficiencies of barley production in Assasa district of south-eastern Ethiopia. Ethiop. J. Agric. Econ. 4(1):1-21.
|
|
|
|
|
Mussa CE, Obare AD, Bogale A, Simtowe PF (2012). Analysis of Resource Use Efficiency in Smallholder Mixed Crop-Livestock Agricultural Systems: Empirical Evidence from the Central Highlands of Ethiopia. Dev. Ctry. Stud. 2(9):30-40.
|
|
|
|
|
Schneider K, Anderson L (2010). Yield gap and productivity potential in Ethiopian Agriculture: Staple grains and pulses. EPAR Brief No. 98.
|
|
|
|
|
Sharp K (2003). Measuring destitution: Integrated qualitative and quantitative approaches in the analysis of survey data. IDS working paper 217.
|
|
|
|
|
Simonyan JB, Umoren BD, Okeye BC (2011). Gender differentials in technical efficiency among maize farmers in Essien Odimolocal government area, Nigeria. Int. J. Econ. Manage. Sci. 1(2):17-23.
|
|
|
|
|
Statistics Canada (2010). Survey methods and practices. 12-587-X. Retrieved from
View
|
|
|
|
|
Taffesse AS, Dorosh P, Gemessa AS (2012). Food and Agriculture in Ethiopia:Progress and Policy Challenges, University of Pennsylvania Press: Philadelphia, chap. Crop Production in Ethiopia: Regional Patterns and Trends. pp. 53-83.
|
|
|
|
|
Tan S, Kuyvenhove A, Qu F (2010). Impact of land fragmentation on rice producer's technical efficiency in South east china. NJAS-Wageningen. J. Life Sci. 57:117-123.
|
|
|
|
|
Wassie SB (2014). Technical efficiency of major crops in Ethiopia: Stochastic frontier model. Acad. J. Agric. Res. 2(6):147-153.
|
|
|
|
|
World Bank (2007). World development report: Agriculture for development. Washington DC.
|
|
|
|
|
WoRLA (Welmera Woreda Office of Rural Land Administration) (2011). Land use and distribution document (unpublished).
|
|
|
|
|
WoA (Welmera Woreda Office of agriculture) (2012). Socio-economic profile of Welmera Woreda and crop assessment report (unpublished).
|
|
|
|
|
Yami M, Solomon T, Begna B, Fufa F, Alemu T, Alemu D (2013). Sources of technical inefficiency of smallholder wheat farmers in selected water-logged areas of Ethiopia: A translog production function approach. Afr. J. Agric. Res. 8(29):3930-3940.
|
|


 and Uis are non-negative unobservable associated with the technical inefficiency of production such that for a given technology and levels of inputs, the observed output falls short of its potential output
  or it is a one-sided error term (U ≥ 0) efficiency component that represents the technical inefficiency of the farm. In short, Ui estimates the shortfall in output Yi of wheat from its maximum value given by the stochastic frontier function.
 is the error term that is composed of two elements, and plot level data was collected from a total of n=252 wheat plots.
 but if ui = 0, the assumed distribution is half-normal. The technical inefficiency model suggested by Battese and Coelli (1995) is illustrated by:
 where the gamma lies between zero and one (0 ≤ γ ≤ 1). If the value is very close to zero, then the deviations are as a result of random factors and/or if the value is very close to 1, then the deviations are as a result of inefficiency factors from the frontier.