ABSTRACT
This paper analysed the determinants of Malawi’s cotton exports, given the challenges faced by main traditional export crop which has rekindled interest in the development of cotton as a key export crop. The gravity model of trade was estimated following the Helpman, Melitz and Rubinsten (2008) framework. Using a balanced panel data, with the set of 36 countries that Malawi has exported cotton to for 13 years (2001 to 2013), the model was estimated to find the determinants of the extensive and intensive margins of Malawi’s cotton exports. It was found that Malawi’s GDP per capita, price, exchange rate, production index, similarity in continent and eligibility for African Growth Opportunity Act (AGOA) significantly affected the extensive margin of Malawi’s cotton trade. It was also found that the per capita GDP, distance with trading partners and the exchange rate affected intensive margins of Malawi’s cotton exports.
Key words: Agricultural trade, gravity model, cotton, panel data, Malawi.
Malawi just like any economy, engages in trade to benefit from its gains. This is due to the widely accepted view that countries differ in their resource endowments, preferences, technological advancements, social and economic institutions and their capacity for growth and development. In this view, Malawi exports a range of commodities but her exports are highly concentrated. The major export commodities for the economy are agricultural since the economy is largely agrarian. The major export commodity for Malawi is tobacco; as such, the agriculture sector is dominated by the production of tobacco. However, tobacco has been facing a number of challenges in recent times. This has led to the need for Malawi to diversify to other crops which can generate export revenues; one of such crop is cotton (Ministry of Agriculture and Food Security, 2006).
In the study period, the cotton sector ranked fourth as a foreign exchange earner for Malawi after tobacco, tea and sugarcane (Reserve Bank of Malawi, 2012). It has high potential for growth and increased investment in the cotton sector would lead to an increase in the amount of cotton produced hence exports from the country. There are also many potential export markets for cotton and textiles within the region because of international agreements in the textiles and garment sub-sector and opportunities presented by the African Growth Opportunity Act (AGOA) of the United States of America (USA) (Chatima, 2007; Government of Malawi, 2006). As such, the government of Malawi set up the cotton production up-scaling initiative which has led to an increase in cotton production in some years (Reserve Bank of Malawi, 2012).
Malawi’s economy is heavily dependent on commodity export such as cotton for foreign exchange earnings. As such, it is vulnerable to external shocks which in turn affect the volumes exported. In the local market, these shocks translate into low and unstable prices; which is one of the major challenges faced in the cotton industry. According to Gillson (2005), this scenario is caused by unpredictable fluctuations in the volumes of cotton produced and exported by major producing countries; and reductions in the costs of production of synthetic fibres. This has been worsened by the downsizing of the textile industry in Malawi since the early 1990’s which has resulted in weak linkages between the cotton sub-sector, textile and garment production and domestic textile demand (RATES, 2003; International Monetary Fund, 2007). Hence, a large proportion of cotton produced in Malawi is exported as lint despite unstable world market prices. Moreover, one of the potential markets for Malawi’s cotton exports was within the region and it has been adversely affected by the end of the multifibre agreement (Coxhead, 2007). The end of the multifibre agreement has resulted in 39% decline in exports from African countries that wanted to utilise the opportunities presented by AGOA (Chatima, 2007).
The objective of this study is to analyse the determinants of Malawi’s cotton exports. Specifically, the study aims to determine if different factors such as the national income, price of cotton, exchange rate, remoteness, distance, production index, similarity in continent and eligibility for AGOA have significant effects on the export volumes of cotton from Malawi. To the best of the authors’ knowledge, no study has been done to empirically assess the factors that affect the exports of Malawi’s cotton. The paper applies the gravity model to the disaggregated trade flows of Malawi cotton to find the determinants of the cotton exports (Dascal et al., 2002; Sarker and Jayasinghe, 2007; Yang and Woo, 2006).
The Helpman, Melitz and Rubinstein (HMR) (2008) framework was used. Unlike other previous studies that disregard zero trade flows which are very common in disaggregated trade data, our work incorporates the zero observations modelled as the decision to export or not (Anderson, 2011). Zero trade flows across countries are explained by heterogeneous firms which differ in terms of their productivity and there are fixed costs of exporting. In this set up, variable trade costs reduce the amount that exporting firms export, while fixed entry costs reduce the probability that a firm has decided to export. Thus, the model accounts for the self-selection of heterogeneous producers in a particular country exporting to international markets and zero trade flows are associated with high bilateral fixed costs of trade (Kandilov and Zheng, 2011; Helpman et al., 2008).
Background reviews
In a Historical Perspective of Cotton Trade in Malawi- Cotton is grown mainly by smallholder farmers and is a relatively important cash crop. Nearly 50% of cotton produced in Malawi is traditionally produced in drought prone areas of the country where cotton can provide a valuable source of cash when other crops fail (Kumwenda and Madola, 2005). The cotton industry has experienced a reduction in domestic demand for cotton lint as a result of a shrinking domestic textile industry especially since the 1990s. This has contributed to low cotton production volumes (Ministry of Agriculture and Food Security, 2006). Apart from the textile industry shrinkage of the 1990s, historical evidence shows that the sector has not grown very much. The growth in the cotton sub-sector has been static as evidenced by the insignificant difference in the area planted and production volumes before and after the structural adjustments programs in Malawi (Kenamu and Phiri, 2014).
In the period from 2001 to 2013, there were 11 major companies involved in marketing of seed cotton who were at the same time ginners. The structure of the seed cotton market was not competitive in nature and the market had a number of barriers that hindered entry into the business of buying seed cotton from the smallholder farmers. These included difficulties to access information markets and price fluctuations, legal and institutional hindrances and poor recognition of private traders (Mwatuwa, 2009). The ginning companies combined had a ginning capacity of 200,000 metric tonnes per annum which was underutilized due to low cotton production. Historically, a major proportion of ginned cotton used to be utilised within the country. However, since the shrinking of the domestic textile industry in the 1990’s, the majority of ginned cotton is exported and sold on the international market with less than 5% used for domestic textile processing. The main international markets for cotton were the United Kingdom, Zimbabwe, Zambia, Republic of South Africa, Tanzania and Mozambique (Chatima, 2007).
The methodology segment elaborates on the theoretical and empirical models, as well as, the data used in the analysis.
The gravity model of trade
This section outlines the theoretical model that was used to estimate the determinants of export performance of Malawi’s cotton. The gravity model was originally founded on Newton’s physical theory which states that two bodies attract each other in proportion to their masses and inversely by the square of the distance between them. In international trade theory, the gravity model aims at explaining the trade flows and patterns between two economies by regarding each of them as an organic body that attracts each other in proportion to their economic size (GDP) and inversely to their distance (Chan-Hyun, 2001).
To incorporate the zero trade flows in the study, the Helpman-Melitz-Rubinstein (HMR) framework was used. It provides a model with heterogeneous firms, where firms differ in terms of their productivity and there are fixed costs of exporting. In this set up, variable trade costs reduce the amount that exporting firms export, while fixed entry costs reduce the probability that a firm has decided to export (Helpman et al., 2008). Thus, the model accounts for the self-selection of heterogeneous producers in a particular country exporting to international markets and zero trade flows are associated with high bilateral fixed costs of trade as below:
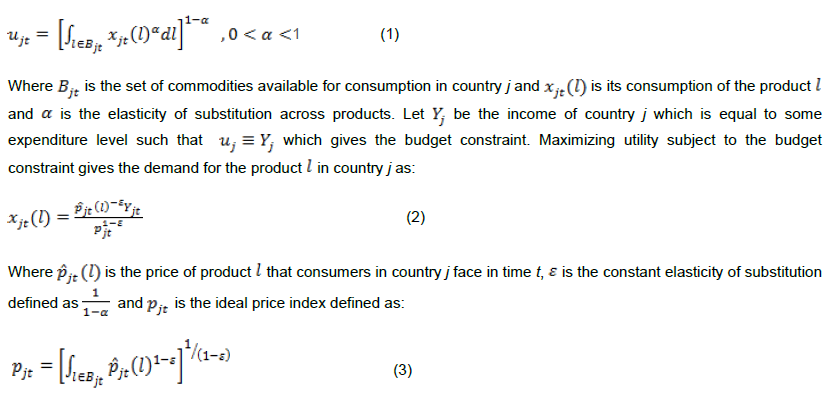
Let there be a set of countries J, where j=1, 2,...J and j’s utility function in time t be:
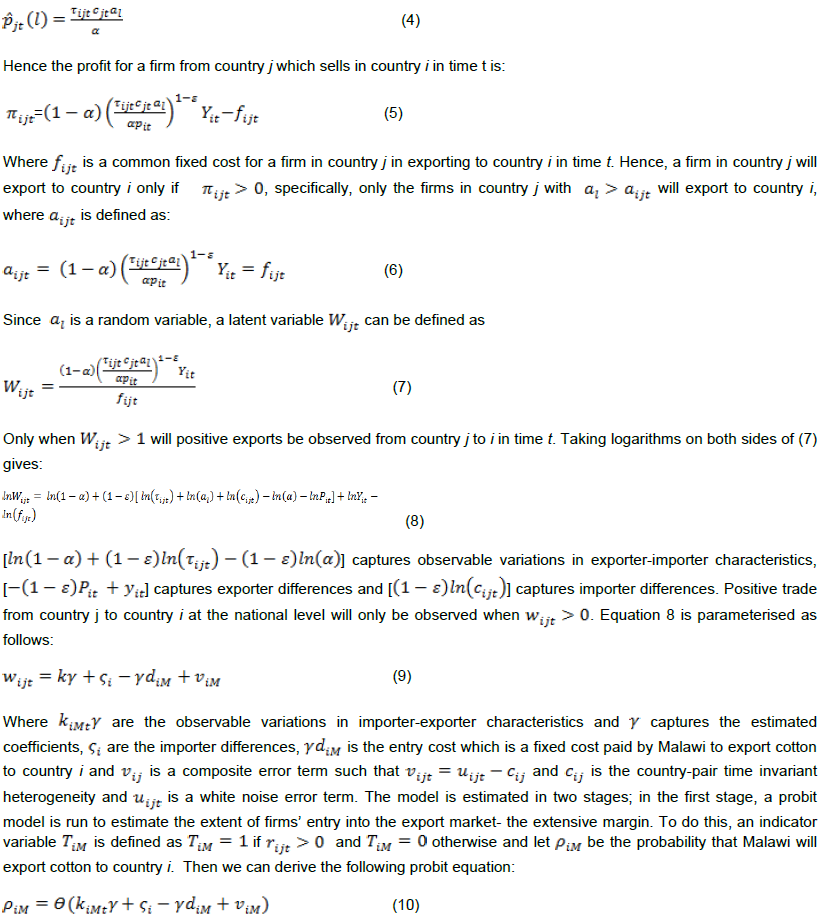
The assumptions on the supply side are that in the world each firm produces a distinct product and so giving a monopolistic competition market structure and that the marginal cost for a firm in country j in year t selling in country i is: ,where >1 is the variable cost resulting from different barriers of trade, is the marginal cost of production for a firm in country j in time t and is a firm specific productivity measure hence different across firms in the same country. It is further assumed that is random variable with distribution on where and this distribution function is the same for all countries. The profit maximising price for the monopolistic competition industry structure is:

Where includes the log of importers’ and Malawi’s per capita GDP in time t ( and respectively), the spot exchange rate of the Malawi kwacha to the USA dollar in time t ( ), the production index of cotton in Malawi in time t ( ), a dummy variable representing eligibility for AGOA ( ) which is equal to 1 if both Malawi and country i are eligible for AGOA, a remoteness variable , the distance between Malawi and the trading partners ( ) and a similarity in continent dummy variable ( ) which is equal to 1 if both Malawi and the trading partner are in Africa, a variable for the farm gate price of cotton in Malawi in time t ( ) and the production index of cotton in Malawi ( ).
Income is the most used variable in gravity models. The GDP provides a proxy for the size of the economy (Ghazalian et al., 2009; Huchet-Bourdona and Cheptea, 2011). It represents the income of the exporting and importing countries. The income of the exporting country (Malawi) represents its production capacity and the income of importing country represents the country’s purchasing power. Both are expected to be positively related to trade flows (Dascal et al., 2002).
Remoteness of Malawi with respect to any trading partner j was measured by the weighted average distance between Malawi and all trading partners other than j, where the weights are the GDP of the trading partners. It provided a resistance factor and is expected to have a negative sign (Gomez-Herrera, 2010). The exchange rate shows the profitability of trade to exporters. It was expected to have either a positive or negative sign depending on the exchange rate movement (Dascal et al., 2002).
The production index measures the change in the production capacity. It was applied in the study on the basis that firms select themselves into export activities, and whether a firm elects to export to a market depends on its productivity level and the fixed costs of exporting to that particular market (Greenaway et al., 2009). The Laspyres index calculation method was used in the study. The production index was calculated as a ratio of the product of the volume and price to the base year’s product of volume and price. It was expected that an increase in production would be positively related to exports.
In the second stage, a generalised least squares model was estimated to determine the intensive margin of the exports. The positive trade values results of the first stage were used to estimate the unobserved share of firms selecting into the export market is run as:
Where are the individual importer effects and is an error term satisfying . The part of the equation in the braces is the estimator for the share of firms that export to i. The probit fitted in the first stage gives the value for the latent variable and the inverse Mill’s ratio .
Data type and sources
A balanced panel, with the set of 36 countries that have been Malawi’s export destinations for cotton from 2001 to 2013 which was composed of 36 trading partners, was used for the estimation of the gravity model. This study was primarily based on secondary data sourced from the Ministry of Agriculture and Food Security, United Nations Conference on Trade and Development (UNCTAD) statistics, FAOSTAT and United Nations Commodity Trade (COMTRADE) statistics. The data collected included: volumes of cotton produced, domestic cotton prices, distance between Malawi’s and trading partners’ and GDPs and exchange rates of Malawi, cotton export values to particular destinations and destinations. Secondary data was opted for because the study required panel data for a period of 13 years which would not have been possible to collect during the period the study was conducted.
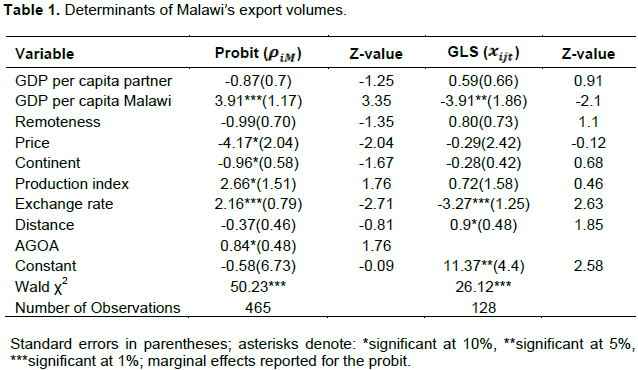
This section presents the results of the gravity model which was applied in the study to find the determinants of the export performance of Malawi’s cotton exports. The results of the gravity model estimation are presented in Table 1. The coefficients of the estimated probit model gave the expected change in the likelihood of Malawi exporting cotton to a particular county in a particular year between the years 2001 and 2013. To have more meaningful interpretations, the marginal effects of the probit estimation are reported in Table 1. The model had a Wald Chi-square value of 50.23 which was significant at 1%. This showed a joint significance of the variables in the model in explaining the factors affecting the selection of countries to which Malawi exports cotton.

The variables that were found to significantly affect the probabilities of exporting cotton to a particular destination were Malawi’s per capita GDP, eligibility for AGOA, exchange rate, price, similarity in continent and production index. Eligibility for AGOA was used as the exclusion variable in the first level and it was found to significantly affect the probability of Malawi exporting cotton to a particular destination, suggesting that AGOA has opened up markets for Malawi’s cotton within the region. It was also found that there was no correlation between AGOA and the residues of the second level estimation with a correlation coefficient of 0.06 which satisfies the exclusion restriction (Behar and Nelson, 2012; Ergul, 2010).
In the second level, a generalised least square random effects model was used to estimate the factors that determine the volume of exports cotton from Malawi to a particular country between the year 2001 to 2013 (Mitze, 2010). A Bruesch Pagan Lagrangian Multiplier test for random effects was used to test the appropriateness of the random effects model. The results had a Chi-square value of 21.38 which was significant at 1% in favour of the random effects model.
The coefficient of Malawi’s GDP per capita was expected to have a positive sign which would imply that an increase in income stimulates an increase in production which in turn stimulates increase in exports (Dascal et al., 2002; Pascal et al., 2009). The coefficient was significant and had the expected sign in the selection model. A similar effect was also observed in the marginal effect for the production index which was found to be significant and had the expected sign in the selection model. This implies that the probability of exporting cotton to a particular destination increases with an increase in the per capita GDP and production of cotton. The effect of Malawi’s per capita GDP and the cotton production index on cotton exports is evidenced by the increase in the number of trading partners in cotton over the years for instance from 6 countries in 2001 to 18 countries in 2013.
The coefficient of the per capita GDP was however not as expected in second level estimation. It was negative, implying a decrease in the volume of exports per unit increase in the per capita GDP. Fratianni and Hoon-Oh (2008) also found a negative sign for the gross national product per capita in their assessment of the relationship between the size of regional trade agreements and openness. The effect of the GDP on the export volumes could be attributed to the opposite movements of Malawi’s per capita GDP and cotton export volumes. While there has been positive growth in the per capita GDP, there has also been an overall reduction in the growth of cotton exports in the past 20 years due to reduction in the domestic cotton industry and unstable prices which lead to negative adjustment in production. This is also evidenced by Lea and Hanmer (2009) who found that GDP growth does not lead to higher export incomes (hence volumes) due to the significance of exogenous prices on Malawi’s exports.
The coefficient of price of cotton was significant in the selection model but it did not have the expected sign. It showed that the probability of Malawi exporting cotton to a particular destination decreased with a unit increase in price. This could be attributed to the influence of location on cotton prices since it costs money to move a bale of cotton, which increases if the bale is being moved from a landlocked country like Malawi to a different continent (International Trade Centre, 2007). Hence, it is more expensive to source cotton from countries like Malawi especially when the prices increase. Notably, the price had no significant effect on the export volumes. This is attributed to Malawi’s small share of cotton exports in the world market which makes it a price taker. This may also be a result of the monopolist competition character of world cotton market. This is according to Gillson et al. (2004), who described the world cotton market as having particular spinners who value cotton from particular origins and have evolved blends to incorporate them. As such, small changes in prices will not induce changes in trade flows.
The coefficient of the distance was insignificant in the selection model. It is however significant in the second level and does not have the expected sign. This was also the case with the coefficient of the similarity of the continent in the selection model. It was significant and negative. This effect of the distance and continent can be explained by the nature of the world cotton industry. The largest consumers of cotton in the world are China, India, Pakistan, Turkey, USA and Brazil which are far from Malawi and outside of Africa (International Trade Centre, 2007). There have been increased proportions of volumes of cotton exports from Malawi to some of these destinations such as China, India and Bangladesh over the study period. Another attributing factor to the effect of the distance could also be the significant expansion of cotton trading companies (merchants) who have increased the number of countries from which they source cotton (Gillson et al., 2004).
The coefficient of the exchange rate was expected to be either positive or negative. It was found to be significant in influencing both the probability and volumes of cotton exports. It was found to increase the probability of exporting cotton to a particular destination. This is in line with the notion that a depreciation of a currency leads to an improvement in the competitive position of the economy, thereby increasing exports destinations. On the other hand, it was found that there was a decrease in the volumes of cotton exported to a particular destination with depreciation in the exchange rate. Klein and Shambaugh (2006) also found a similar effect of an indirectly pegged exchange rate on the volumes.
The effect of the exchange rate on the volumes of cotton exports shows that Malawi’s cotton sector has failed to utilise the terms of trade gain, if there have been any gain caused by the currency devaluation which was experienced during the study period (Dossani and Kaya, 2012; Kwalingana et al., 2012). This is attributed to agricultural composition of Malawi’s GDP and the impact of external prices on Malawi’s exports. The implications for the cotton sub-sector is that although devaluation has made Malawi’s cotton exports relatively desirable for particular destinations, it has not trickled down to the supply side to induce an increase in production.
CONCLUSION AND RECOMMENDATIONS
The study analysed the determinants of export performance of Malawi’s cotton. The HMR (2008) framework of estimating the gravity model of trade was used to find the determinants of export performance of Malawi’s cotton. The model was estimated in two levels. In the first level, a probit model was estimated which was used to model the decision by firms to enter the export market. In the second stage, a generalised least squares model was estimated where positive trade value results of the first stage were used to estimate the unobserved share of firms selecting into the export market. The factors that were found to significantly affect the probability of Malawi to export cotton to a particular destination were Malawi’s GDP per capita, price of cotton, exchange rate, production index, similarity in continent and eligibility for AGOA. The factors that affected export volumes of Malawi’s cotton to a particular destination in the study were Malawi’s per capita GDP, distance with trading partners and the exchange rate.
It is recommended that there is need to address supply side constraints affecting the cotton industry such as improving productivity and infrastructure which will help to address the effects of the exchange rate on the volumes of exports by enabling the cotton sector to utilise terms of trade gains created by exchange rate movements. In the long-run, it is recommended that a vibrant cotton industry should be developed so that most of the cotton that is produced is processed within the country and exports should largely be composed of textiles and woven cloth. A vibrant cotton industry would help to increase the prices that farmers get since it would reduce the impact of location on cotton prices as well as the impact of exogenous prices on the cotton prices and the national income.
The authors have not declared any conflict of interests.
REFERENCES
|
Anderson J (2011). The gravity model. Ann. Rev. Econ. 3:133-60.
Crossref
|
|
|
|
Behar A, Nelson B (2012). Trade Flows, Multilateral Resistance and Firm Heterogeneity. International Monetary Fund, Working Paper No. WP/12/297.
Crossref
|
|
|
|
|
Chatima C (2007). An Analysis of Malawi's Trade Performance under the African Growth and Opportunity Act. Ministry of Industry and Trade, Lilongwe.
View
|
|
|
|
|
Coxhead I (2007). A New Resource Curse? Impacts of China's Boom on Comparative Advantage and Resource Dependence in Southeast Asia. World Dev. 35(7):1099-1119.
Crossref
|
|
|
|
|
Dascal D, Mattas K, Tzouvelekas V (2002). An analysis of EU wine trade: A Gravity model approach. International Adv. Econ. Res. 8(2):135-174.
Crossref
|
|
|
|
|
Dossani S, Kaya I (2012). Does Currency Devaluation Induce Trade in Malawi?
View
|
|
|
|
|
Ergul E (2010). Firm Heterogeneity and Political Economy of International Trade. Graduate Dissertation and Theses at Illinois.
View
|
|
|
|
|
Fratianni M, Hoon-Oh C (2008). Expanding RTAs, Trade Flows, and the Multinational Enterprise. Kelley School of Business -Indiana University, Working Paper no 13.
Crossref
|
|
|
|
|
Ghazalian P, Larue B, Gervais J (2009). Exporting to new destinations and the effects of tariffs: The case of meat commodities. Agric. Econ. 40(2009):701-714.
Crossref
|
|
|
|
|
Gillson I (2005). Trade: How cotton subsidies harm Africa. Overseas development Institute, London.
View
|
|
|
|
|
Gillson I, Poulton C, Balcombe K, Page S (2004). Understanding the Impact of Cotton Subsidies on Developing Countries. MPRA Paper No. 15373.
|
|
|
|
|
Gomez-Herrera E (2010). Comparing alternative methods to estimate Gravity Models of bilateral trade.
View
|
|
|
|
|
Greenaway D, Gullstrand J, Kneller R (2009). Firm Heterogeneity and the Geography of International Trade. AgriFood Economics Centre, Working Paper No. 2009:2.
|
|
|
|
|
Helpman E, Melitz M, Rubinstein Y (2008). Estimating Trade Flows: Trading Partners and Trading Volumes. Q. J. Econ. 123(2):441-487.
Crossref
|
|
|
|
|
Huchet-Bourdona M, Cheptea A (2011). Informal Barriers and Agricultural Trade: Does Monetary Integration Matter? Agric. Econ. 42(2011):519-530.
Crossref
|
|
|
|
|
International Monetary Fund (2007). Malawi Poverty Reduction Strategy Paper- Growth and Development Strategy. International Monetary Fund, Washington D.C.
|
|
|
|
|
Kandilov I, Zheng X (2011). The Impact of Entry Costs on Export Market Participation in Agriculture. Agric. Econ. 42(2011):531-546.
Crossref
|
|
|
|
|
Kenamu E, Phiri M (2014). Performance of Cotton Production in Malawi. Sch. J. Agric. Sci. 4(3):157-165.
|
|
|
|
|
Klein M, Shambaugh J (2006). Fixed Exchange Rates and Trade. J. Int. Econ. 70(2):359-383.
Crossref
|
|
|
|
|
Kumwenda I, Madola M (2005). The Status of Contract Farming in Malawi. Food, Agriculture and Natural Resources Network.
View
|
|
|
|
|
Kwalingana S, Simwaka K, Munthali T, Chiumia A (2012). The Short-run and Long-run Trade Balance Response to Exchange Rate Changes in Malawi. Journal of Development and Agricultural Economics, Vol. 4(8): 221-232.
Crossref
|
|
|
|
|
Lea N, Hanmer L (2009). Constraints to Growth in Malawi. The World Bank Policy Research Working Papers, No. 5097.
Crossref
|
|
|
|
|
Ministry of Agriculture and Food Security (2006). Cotton Production in Malawi. Country report presented at the 65th International Cotton Advisory Committee Plenary Meeting.
View
|
|
|
|
|
Mitze T (2010). Estimating Gravity Models of International Trade with Correlated Time-Fixed Regressors: To IV or not IV? MPRA Paper No. 23540.
|
|
|
|
|
Mwatuwa H (2009). An Evaluation of Smallholder Cotton Marketing in Malawi: A Case of Salima and Balaka Rural Development Projects, Malawi. Egerton University, unpublished MSc thesis, Kenya.
|
|
|
|
|
Pascal G, Larueb B, Gervais J (2009). Exporting to New Destinations and the Effects of Tariffs: The Case of Meat Commodities. Agric. Econ. 40:701-714.
Crossref
|
|
|
|
|
RATES (Regional Agriculture and Trade Expansion Support) Programme Centre (2003). Cotton-Textile-Apparel Value Chain Report for Malawi. RATES Programs Centre, Nairobi.
|
|
|
|
|
Reserve Bank of Malawi (2012). Financial and Economic Review. 44(1).Reserve Bank of Malawi, Lilongwe.
View
|
|
|
|
|
Sarker R, Jayasinghe S (2007). Regional Trade Agreements and Trade in Agri-food Products: Evidence for the European Union from gravity Modelling Using Disaggregated Data. Agric. Econ. 37:93-104.
Crossref
|
|
|
|
|
Yang C, Woo R (2006). Do Stronger Intellectual Property Rights Induce More Agricultural Trade? A dynamic Panel Data Model Applied to Seed Trade. Agric. Econ. 35:91-101.
Crossref
|
|