ABSTRACT
In Nigeria, cultivation of Industrial Sugarcane has suffered a serious setback due to poor performance of government established and owned sugar companies. Arising from over-dependence on sugar importation, development in the Nigerian sugar industry has been very slow for the past three decades while the domestic supply of sugar had lagged behind the demand for the product, inspite of the country’s comparative advantages for sugarcane production. This study is therefore necessary to examine profitability and competitiveness of sugarcane enterprises for attracting private investment and employment generation in the country. The study employed financial and economic indicators and the value chain approach in analyzing primary data collected in a sample survey of various actors across the sugarcane value chain. Results of the study revealed that every stage of the commodity chain is profitable. Domestic Resource Cost (DRC) Indices ranged from 1.8 for medium scale and 2.3for small scale operators. Thus sugarcane production is not internationally competitive. To develop the industry, investment in infrastructure and new innovative processing technology is required for the modernization and the expansion of local processing industries.
Key words: Agro-processing, investment, employment, income.
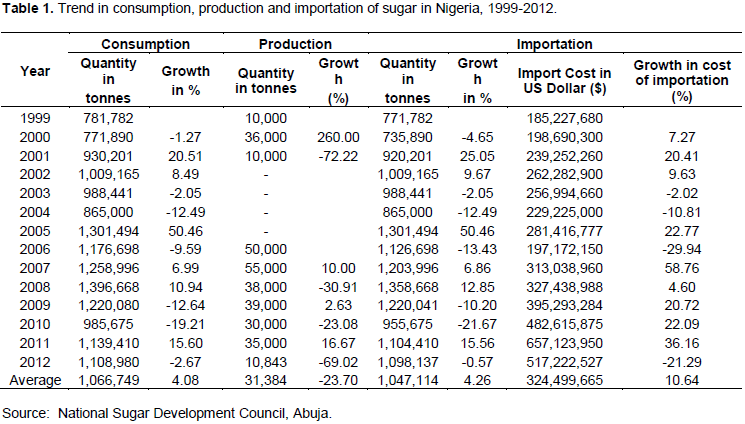
Greater integration of rural economies into the world economy has intensified the need for Nigerian agriculture to change and be globally competitive. This imperative necessitates policies favouring greater competition, support for small and medium scale enterprises broadly, better resource allocation and stable production of raw materials. A stable production of raw materials provides a competitive and stable supply chain from which other competitive agro-processing industries can emerge. For decades, however, this has been problematic due to recurring failure of government programmes of agrarian reform and the resulting marginalisation of the rural economies. Nigeria was once a leading agricultural producer. In the 1960s, Nigeria produced over 60, 30, 20 and 15% of global exports in palm oil, groundnut, groundnut oil and cocoa, respectively. By the 2000s, Nigeria had lost her dominant position in exports of these key crops and the share of exports of each of these crops now reduced to 5% or less (CBN, 2011, 2015). Today, Nigeria is a net importer of agricultural produce, with total food import bill of USD4.2 billion annually out of which sugar, a final product of sugarcane, constitutes average amount of USD324.5 million annually for the period between 1999 and 2012 (Table 1).

Among 92 countries that belong to the international sugar organization, Nigeria is the only one that belongs to the category of sugar importers and it ranked fourth in 2009. Evidence showed that when compared to some selected West African Sugar producing countries, Nigeria is the least food secured in terms of sugar (National Sugar Development Council, 2012). Arising from the overdependence on sugar importation, cultivation of industrial sugarcane has suffered a serious setback due to poor performance of government established and owned sugar companies in Nigeria. Development in the Nigerian sugar industry has been very slow for the past three decades while the domestic supply of sugar had lagged behind the demand for the product, inspite of the country’s comparative advantages for sugarcane produc-tion. The desired productivity improvements and competitiveness in Nigerian Sugracane enterprises have been difficult to achieve over the years due to weaknesses in the commodity marketing system and the lack of attention to develop the commodity chain, produce value added products and enhance market access. The food and agricultural markets are extremely fragmented along sub-national levels, resulting in segmented markets of sub-optimal size which does not ensure profitability of sizeable private investment in the different stages of the sugarcane value chain. The resulting supply-demand gaps in sugar which is one of the final products of sugarcane is increasingly being filled by imports; thus further dampening the prospects for transformation of sugarcane enterprises, revenue generation and poverty reduction.
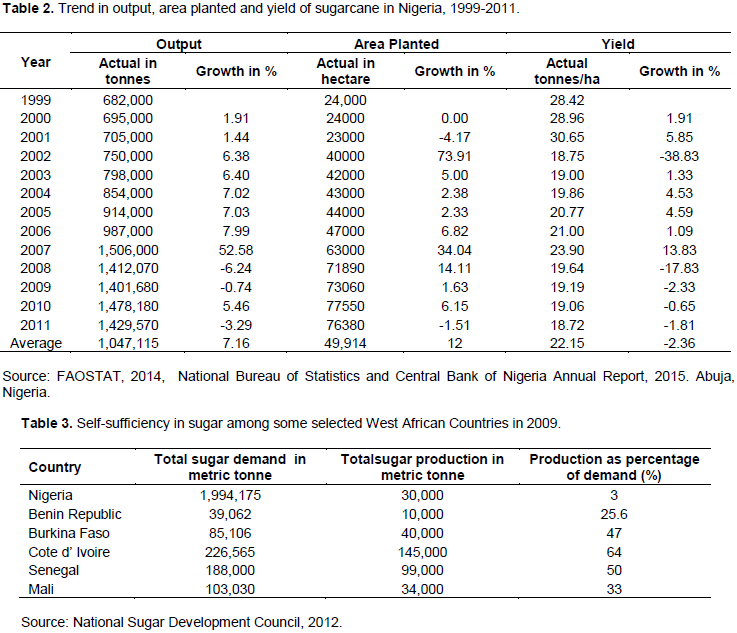
In the recent time, sugarcane output has demonstrated unsteadiness and irregularity in its trend as indicated by Table 2. Growth in output of sugarcane declined from 52.58% in 2007 to negative 3.29% in 2011. Impressive trend in the output growth that was recorded for the years between 1999 and 2007 has not been recovered. The depressing growth in output of the commodity was strongly correlated with the trends in area planted and the yield realized. Growth in area planted to cassava had declined substantially from 34.04% in 2007 to negative 1.51% in 2011. Similarly, the yield of the crop declined consistently between 2007 and 2011 (faostat, 2015). Sugar industries in Nigeria rely more on cultivars brought in from overseas rather than those developed in Nigerian Research Institutes, for reason usually not beyond inadequate information about the performance of the cultivars that were bred in the country. The country’s sugar industry only supplies about 3% of the nation’s requirement as shown by Table 3. Most of the African neighbours produced substantial proportions of their sugar requirements while Nigeria can only meet insignificant proportion of domestic demand though domestic production. This had led to rising expenditure on imports of sugar.
Admitedly, in the context of the current global decline in oil price, it is now imperative for the county to aspire to attain and maintain high productivity and product quality for her agriculture to compete in the world market place and maintain a high standard of living for her citizens.
The country must therefore get her agricultural policies and strategies right in order to move her economy into high-value sectors that will generate jobs for the future. The fall in the prices of oil and rising unemployment in the country has prompted the need to diversify the economy in general and the agricultural sector in particular. Again, the recession currently being experienced in the the economy indicates the advisability to reposition Nigerian agriculture in an increasingly globalized world. This is to ensure that supply and demand in the sector can take place in such a way as to provide optimum benefits to the economic agents involved, as opposed to the current situation in which Nigeria is serving as suppliers of raw materials to foreign consumers who have considerable influence over the prices of such commodities through a plethora of institutional arrangements. If the agricultural commodity value chains are well developed in Nigeria, substantial part of the rising food demand can be satisfied with domestic production rather than with imports and this could generate considerable gains in income for smallholder producers. In this regard, the paper aimed at providing answers to the following questions. How can productivity and marketing be improved in sugarcane enterprises so as to encourage private investment in the sector? How can competiveness be improved in the sector? How can the nation ensure a considerable change in the market value of what local producers have to sell? What are the constraints to competitiveness and profitability of the enterprise at the different nodes of the sugarcane value chain? How can the constraints be removed? These are the major challenges the paper attempted to address.
THEORETICAL FRAMEWORK AND REVIEW OF LITERATURE
Concept of competitiveness is difficult to deal with. This difficulty can be tackled by adopting a definition in line with the focus of the paper. In Harvard University, competitiveness is defined as the ability of a nation to produce, distribute goods and services that compete in the international economy with goods and services produced in other countries that brings about a rising standard of living. This definition assumes a national goal of improving the well-being of the population. This paper adopts the definition of competitiveness as the sustained ability to profitably gain and maintain market share in domestic and export markets. Although the meaning is not straightforward at the industry level, competitiveness implies the ability of a group of like firms to compete with another group in another sector or the same sector in another country (Gourichon, 2013; Coffin et al., 1993). An important advantage of this definition is that it provides some measurable dimensions. For the purpose of this paper, the same definition that “ability to sustain market share and profitability” will be adopted, particularly at the microeconomic level analysis. Thus, this paper, at the microeconomic level, considered the capacity of the economic actors along the value chain of sugarcane, to compete, grow and be profitable. Any firm will be expected to meet these requirements if it is to remain in business, and the more competitive a firm relative to its rivals, the greater will be its ability to gain market share.
Conversely, uncompetitive firms will find their market share decline, and they ultimately remain uncompetitive unless furnished with some artificial support or protection and will go out of business. At the macro level, the term competitiveness has been criticised and considered meaningless by Krugman (1994), who states that it could be misleading and incorrect to make an analogy between a nation and a firm; for example, whereas an unsuccessful firm will ultimately go out of business, there is no equivalent “bottom-line” for a nation. He states further that whereas firms can be seen to compete for market share and one firm’s success will be at the expense of another, the success of one country or region creates rather than destroys opportunities for others and trade between nations is considered a ‘zero-sum game’. This view is supported by the general consensus which seems to recognise that improvements in one nation's economic performance need not be at the expense of another. It is not necessarily in a win or lose situation, and productivity is one of the central concerns of competitiveness. For instance, “an economy is competitive if its population can enjoy high and rising standards of living and high employment on a sustainable basis. More precisely, the level of economic activity should not cause an unsustainable external balance of the economy nor should it compromise the welfare of future generations”. Some of the underlying factors that will influence competitiveness are technology, attributes of purchased inputs, product differentiation, production economies, and external factors (Schnepf et al., 2003).
In the light of the foregoing, competitiveness is an indicator of the ability to supply goods and services in the location and form and at the time they are sought by buyers, at prices that are as good as or better than those of other potential suppliers, while earning at least the opportunity cost of returns on resources employed. Two types of competition are included in this definition. First, the competition on domestic and international product markets and thus the ability to gain and maintain market shares, and second, the competition in factors markets, where those factors employed in producing the goods have to earn at least the opportunity costs (Klaus and Monika, 1997). Although pointing to different aspects, both types are indicative of the fact that competitiveness is a relative measure. One always has to make the comparison with a base value. In the case of a market share, it is with regard to market size. If one assesses competitiveness in factor markets, the relation is to the value a factor would have in another production process. To maintain a standard of living, higher productivity and product quality have become essential (Smit, 2010). The ability of a nation to produce a high and rising standard of living for its citizens depends on the productivity with which a nation’s labour and capital are employed. Productivity is the value of the output produced by a unit of labour or capital. Productivity depends on both the quality and features of products which determine the prices that they can command and the efficiency with which they are produced. Productivity is the prime determinant of a nation’s long-run standard of living. It is the root cause of national per capita income (Porter, 1990).
Nature and sources of data
Both primary and secondary data were used. Primary data derived mainly from producers (farmers), processors, marketers including wholesalers and retailers through a survey conducted in 2014. This was done with the use of well-structured questionnaires. Data collected from relevant actors at every level in the chain included size of operations, farm size, costs of equipment for production, storage and processing, fixed assets, revenues, labour (family and hired), input and output prices, wage rate, and interest rate. Secondary data were collected from government publications and organizations such as National Sugar Development Council of Nigeria (NSDCN), Agricultural Development Programmes (ADPs), National Bureau of Statistics office in Abuja, Central Bank of Nigeria, National Agricultural Extension and Research Liaison Services (NAERLS), and Federal Ministry of Agriculture and Rural Development. FAOSTAT and other internet sources provided information on consumption, domestic production and importation of sugar, output figures, yield of sugarcane and land area cultivated to the crop.
Sampling procedure and data collection
The entry point for the study is the farm. In selecting the farm, emphasis was placed on the agro-ecological zones with the greatest comparative advantage in the production of sugarcane. In effect therefore, selected geo-political and agro-ecological zones of the country in which sugarcane is predominantly cultivated and where sugar is marketed were covered. Selected zones for producers, processors, and wholesalers are north west, northeast, north central and Federal Capital Territory, Abuja. Selected state in the north west is Kano, northeast is Adamawa while the selected state in the north-central is Niger. For urban retailers, Lagos state in the Southwestern zone was also selected. From the farm, the actors responsible for pre and post-harvest activities up to the final destination in sugarcane value chain were traced. In Numan, Adamawa State, 100 farmers cultivating sugarcane were randomly selected from the list of farmers participating in the out-grower’s scheme of the Savannah Sugar Company. Relevant data were collected from the selected farmers using structured questionnaire. Similarly Savannah Sugar Company in Numan, Adamawa Sate was visited and relevant data were collected from the company.
Method of analysis
An important technique of measuring competitiveness which was adopted in the study is accounting method which entails use of indicators such as production costs and gross margins. It is used to compare farms to indicate which enterprise has a competitive advantage. Gross margins are obtained by substracting costs of variable inputs from gross revenue. Since these calculations can be carried out only for a single commodity, such analyses are done at the product level. To allow for easier comparison, it is common to normalize gross margins, for example, with the value of sales or labour costs. This indicator can provide rather detailed insights into the reasons why enterprises across regions are not competitive in a particular good. This is due to the fact that the index is based on a rather detailed breakdown of the various cost items of production and, hence, offers a comparison at this level.
Moreover, descriptive and inferential statistics such as means and percentages were used in the analysis of data. Profitability of the chain was measured by the relative earnings of each agent. Economic analysis provides insights into the key economic indicators such as the gross revenue of the various actors in the chain, the gross margin at each level and the profitability (net profit) at each level. The economic analysis is important to developing a growth strategy for upgrading the chain. For the analysis household consumption, family labour, and paid out cost were valued. The analysis involved estimations of the following indicators:
i. Gross Revenue = Value of Output = Quantity of output multiplied by unit price represented by VQi = PiQi
ii. TVC = Total variable costs = Costs of all variable inputs used.
iii. Total Costs = The addition of all variable costs and fixed costs incurred by each actor in the chain.
iv. Gross margin is gross profit which expresses the economic gain or loss to the agent once all current production cost are met. It is estimated by Gross Revenue minus Total Variable Cost.
v. Net Profit: Gross Revenue minus Total Cost. The net profit measures the increase in wealth of the individual agent.
vi. Gross rate of return = Gross Margin/ Total variable costs.
vii. Net Rate of Return = Net Profit/Total Production Costs.
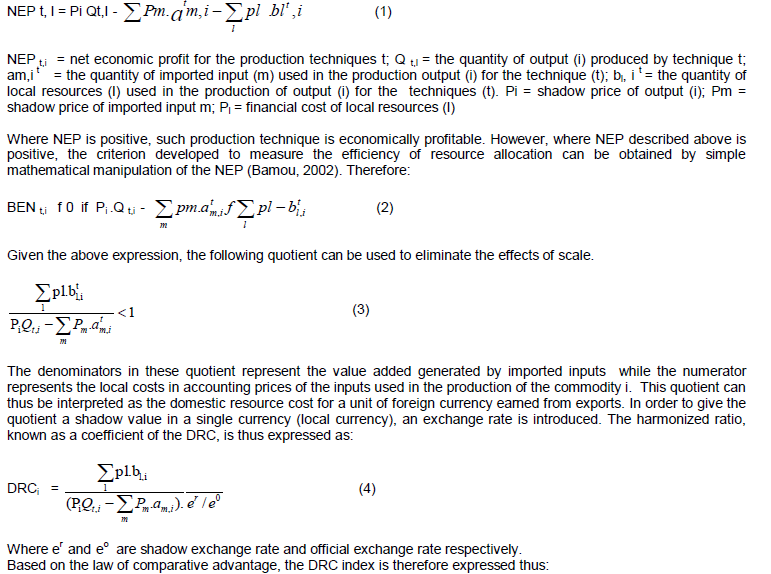
Another important indicator, the coefficient of domestic resource cost (DRC), which is derived from the microeconomic profit function on the basis of economic prices, and which is most often used in the measurement of competitiveness (Bamou, 2002), was also adopted in this study. The DRC is a measure of a product’s capacity to penetrate the international market. In other words, it is to measure whether the local production can use the resources better than the rest of the world. If Nigeria is to produce a commodity for the world market, the concern is that the realizable world price in Nigerian Naira covers the costs of exports and an adequate profit margin. The exporter’s attraction to deal in the export commodity is a function of the size of this margin. The bigger the margin the more attractive is the commodity. The economic basis of analyzing export competitiveness of Nigerian sugarcane on the world market was therefore computed using the Domestic Resources Cost (DRC).
DRC as a measure of competitiveness
The DRC is the domestic resources cost for a unit of net foreign exchange. One of the various methods that have been used to measure DRC assumes that the production of a commodity i is based on a production technique, t. Thus, supposing that two types of inputs, namely, imported inputs or tradable, and local resources or non-tradable were used in the production of the commodity. The imported inputs known as (m) are subject to taxes or subventions, while the local ones are not subject to either taxes or subventions. The producer profit function of the commodity (i) for the production technique t can be expressed as followed:
1. If the DRC index is lower than 1, it means fewer resources are needed to generate a unit of foreign currency. In essence, the world market price is greater than the resource cost used in production. Thus, compared to the rest of the world, the country uses its resources more effectively and therefore has a comparative advantage in the production activity.
2. If the DRC is greater than 1, it implies that more local resources are required to produce a unit of foreign currency so, the country has no comparative advantage in the production activity.
EMPIRICAL RESULTS AND DISCUSSION
Structure of financial costs of sugarcane enterprises
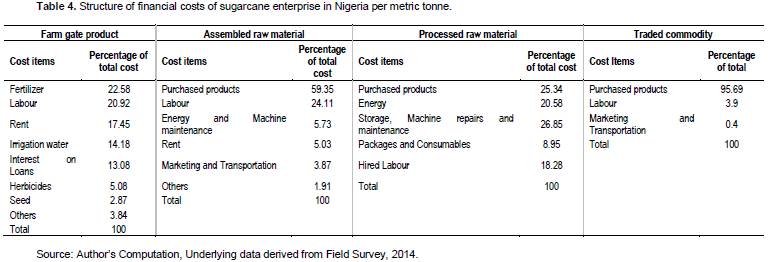
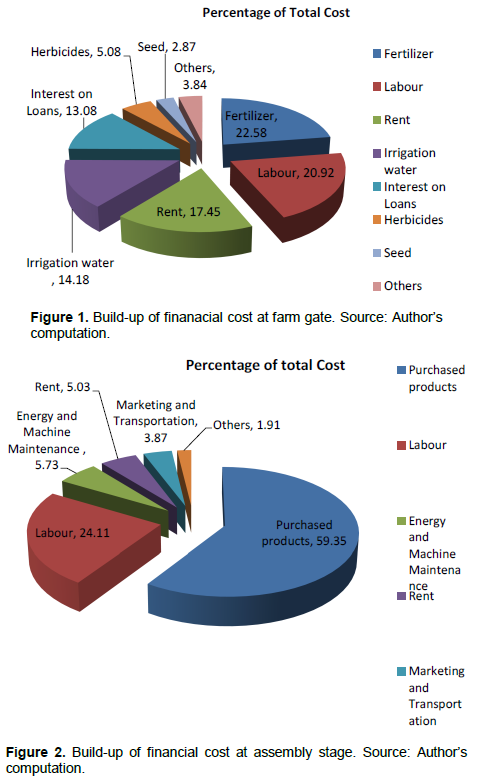
Both the magnitude and structure of financial costs are important in commodity chain analysis. The magnitude of cost will affect the performance of the commodity value chain while the structure will provide the opportunity to identify specific cost items that can be targeted by actors in a bid to improve the performance of the chain. As expected, the type and composition of financial costs of sugarcane commodity chain vary from one stage to another. The structures of financial costs of the sugarcane enterprise per metric tonne across the various stages of the commodity chain in Nigeria are summarised in Table 4 while Figures 1 to 4 indicated the graphical illustrations of the cost structures at the farm gate, assembly, processing, and logistic trading stages respectively. As shown by Table 4 and Figure 1, sugarcane production cost at the fam gate stage is distributed over five major factors that are important. These are purchased inputs (31%) in which fertilizer dominates with 23% share of the total cost, hired labour accounts for 21%, renting of equipment accounts for 17%, while interest paid accounts for 13%. In Table 4 and Figure 2, five major factors are important in the financial costs of sugarcane enterprise at assembly stage. These are products purchased (59%), labour (24%), energy and machine maintenance (6%), rent (5%), marketing and transportation (4%).
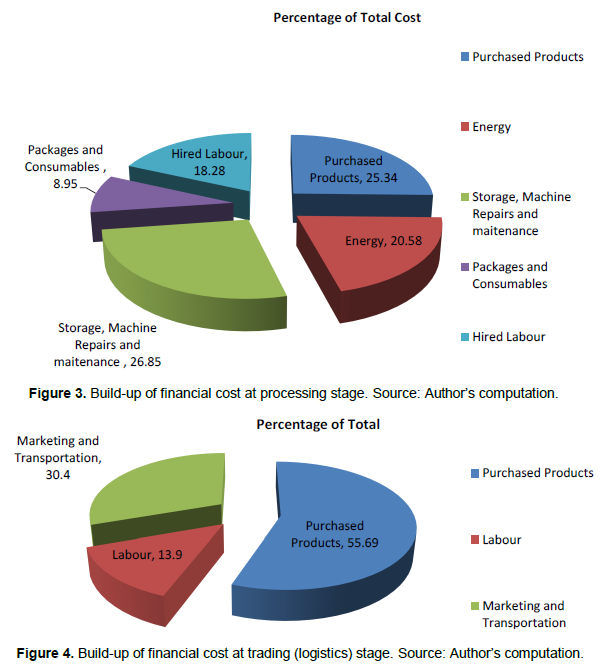
At processing stage, five variables are important in the cost of processing sugarcane. The combination of storage, machine repairs and maintenance cost dominates the cost structure, with 27% share of the total cost. About 25% of the total cost goes to product purchased. Product purchased ranked second in the order of importance among the five variables that are substantial in the cost structure. Following this is cost of energy which constitutes about 21% of the total cost. The fourth variable that contributes substantially to total cost at the processing stage is hired labour. About 18% of the total cost goes to hired labour. A combination of packages and consumables constitutes the fifth factor that is important in determining the total cost at the processing stage. About 9% of the total cost goes to packages and consumables (Figure 3).
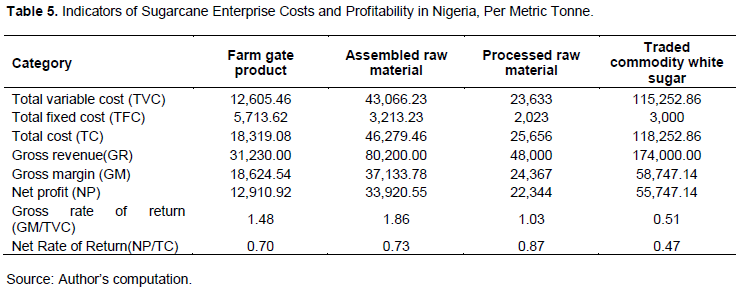
At the logistics stage (domestic distribution), the relevant cost items in order of importance are product purchased (56% of total cost), marketing and transportation (30%), labour (14%) (Figure 4). Overall, across all stages, the analysis of cost structure clearly indicates dependency on hired human labour which is favourable for employment generation across the various stages of the commodity chain. Other factors that frequently occur as crucial variable affecting cost of operation include renting of infrastructures such as warehouse, shops, equipment and machines, as well as fuel, purchased inputs mainly herbicides, pesticides and fertilizer. Cost of fuel and transportation cost of moving goods from point of sale to delivery point and cost of quality inputs such as fertilizer, improved seeds and pesticides have affected the cost of operation particularly at the farm gate level.
Financial costs and profitability indicators of sugarcane entrprises
The magnitudes of the financial cost and profitability indicators of sugarcane enterprise per metric tonne of product across the various stages of sugarcane value chain in Nigeria are summarised in Table 5. As shown by the table, each stage of the commodity chains is profitable. At the production stage, total production cost per metric tonne of output was ₦18,319.08 while the gross revenue realized was ₦31,230. Profitability indicators in terms of gross margin and net profit per metric tonne of commodity across the commodity chain are the lowest at the fam gate level. The gross margin at the farm gate level was ₦18,624.54 while the net profit was ₦12,910.92 per metric tonne of output. In terms of rates of returns, the gross rate of return 148% which is higher than that of processing and trading stage. The net rate of return was 70% which is higher than that of trading stage. At the assembly stage, the total cost of operation per tonne was ₦46,279.46, gross margin per tonne was ₦37,133.78 while the net profit is ₦33,920.55. The rate of return, 186%, at the assembly stage, is the highest across all stages, but the net rate of return of 73% on the basis of net profit is lower than that at processing stage. At the processing stage, total operation cost per tonne was ₦25,656, gross revenue was ₦48,000.00, while net profit per tonne was N22,344 with 103% gross rate of return on the basis of gross margin and 87% rate of return on the basis of net profit.
At the trading stage, total cost of operation per tonne of white sugar was ₦118,252.86 while the gross revenue was ₦174,000. The trading stage attracts gross margin per tonne of ₦58,747.14 while the net profit was ₦55,747.14 with 51% rate of return on the basis of gross margin and 47% rate of return on the basis of net profit. Across the various stages of the commodity chain, both the gross and the net rates of return are the lowest at the trading stage.
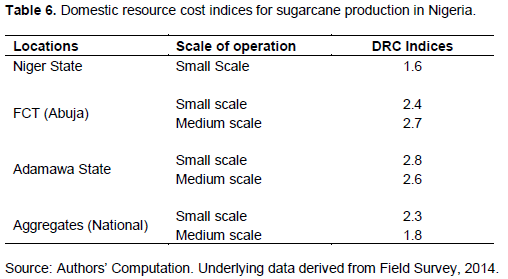
Competitiveness of sugarcane production
The results of the analysis of domestic resource costs (DRC) in the production of sugarcane at small and medium scales as shown in Table 6 yield coefficients greater than 1. As indicated earlier, if the DRC is lower than 1, then fewer local resources are required to generate a unit of foreign currency; hence the value of the product at the world market price is greater than the resource costs used in production. Therefore, as opposed to the rest of the world, the country uses its resources more effectively and thus has a comparative advantage in the production activity. However, if the DRC is greater than 1, more local resources are required to produce a unit of foreign currency and the country has no comparative advantage in that production activity. Thus, in the case of Nigeria, the result of the DRC analysis presented in Table 6 indicate that sugarcane production in Nigeria is not internationally competitive. The reasons that negatively affect international competitiveness of the commodity are discussed subsequently.

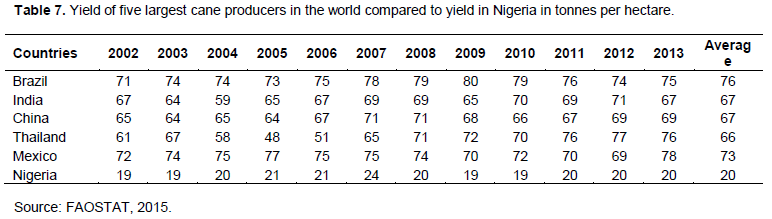
Sugarcane yield in nigeria and five largest cane producers in the World
Table 7 summarised the sugarcane yield per hectare in Nigeria as well as the yield in the five largest cane producing countries in the wold. At the international level, the yield of sugarcane in Nigeria is the least among the comparator countries, namely, Brazil, India, China, Thailand and Mexico. For the period beween 2002 and 2013, the yield levels was the highest in Brazil with the yield being 76 tonnes per hectare on the average. The yield level in Mexico averaged 73 tonnes per hectare. The yield of sugarcane was the least in Nigeria with the average yield of 20 tonnes per hectare for the same period. This implies that the yield level in Nigeria was about one-quarter of the yield in Brazil. The ultimate ambition of Nigeria, therefore, is to reach the level of sugarcane development attained by these five largest cane producing countries if the profitability and international competitiveness of sugarcane will be enhanced in Nigeria.
Constraints and limitations to growth of sugarcane industry in Nigeria
Infrastructure constraints arising from inadequate policy implementation is a worrisome challenge that could limit the profitablility and international competitiveness of sugarcane. Results of the in-depth interview conducted at the savannah sugarcane processing factory in Numan, Adamawa State, revealed that the seeds planted by the contract farmers were imported from Sudan for multiplication. The sugar processing factory spent a lot on diesel to supplement energy supply. The fertilizer being supplied to farmers are inadequate and often they are being procured by the farmers at exorbitant prices. Moreover, the machines for processing cane into sugar at Numan were imported. Further it was revealed that the factory spent huge amount of money on custom duty and the bureaucratic procedure involved in clearing their machines at the port.
More importantly, small-scale farmers have been discouraged by the restricted number of mills available. Most of the farmers are far away from the mills. This represents an important disincentive for both producers and millers. Producers of sugarcane can only sell their products to the limited number of mills, reached at a very high transport costs. The problem has been aggravated by lack of high quality roads and lack of steady supply of electricity, conditions that exacerbate a poor investment climate particularly in the Nigerian rural sector. The results in Table 4 and Figure 3 on the structure of operational costs at the processing stage supported these findings. At the processing stage, the operational costs of processing sugarcane are dominated by energy and machine operations (47.43%). Similarly at the logistics stage, (domestic distribution) excluding the cost of purchased products, the cost of marketing and transportation to delivery point dominates the total cost of operation (30.4%). In spite of the various government policies to revive the energy sector, hours of electricity per day is limited to few hours resulting in huge expenditure being spent by Nigerians on fuel to power electric generating sets (Nigerian Tribune, 23 October, 2014 page 4). With the current change of government in May, 2015, the hours of electricity per day has increased but not yet at the required level that will enhance international competitiveness of Nigerian agriculture.
In summary several difficulties adversely affected the performance and growth in the sugarcane industry. In general the problems cut across the production, processing and marketing stages of the value chain. The main constraints included reliance on estate-based industrial cane production system which has been bedevilled with myriads of operational deficiencies and has thus hindered regular supply of raw materials to the sugar factories over the years. Low output price for industrial sugar-cane is another disincentive factor on the part of the farmers. This resulted into shifting of production resources away from industrial sugarcane to other remunerative crops such as cassava. Only few farmers have joined the estate-based out-grower schemes due largely to unattractive prices offered to farmers. Unattractive price discouraged farmers from out-growers schemes. Restricted market for sugar-cane has tended to discourage increased production by small-scale farmers. The mills available are too few compared to the number of farmers. Moreover, available mills are located close to few farmers and far away from several others; thus constituting great disincentive for both producers and millers. Whereas farmers growing chewing cane can sell their products at various markets, producers of industrial cane can only sell to the limited number of mills which in some instances can be reached at very high cost of transportation. Other constraints include reliance on imported cultivars for the estate-based production systems, low level of capacity utilization in existing sugar mills and inadequate and irregular supply of sugarcane to the mills.
POLICY IMPLICATIONS AND CONCLUSION
Based on the findings of this study, the following policy strategies should be given priority attention in order to enhance value addition and growth of sugarcane industry in Nigeria.
Effective implementation of the concept of staple crop processing zone for sugarcane processing and marketing
Federal Ministry of Agriculture and Rural Development has come up with the concept of staple crop processing zone (SCPZ). Effective implementation of the concept for sugarcane processing will ensure increased value addition,reduce deterioration of sugarcane and ensure increased market access and market linkages. The processing zone will be helpful for processing sugarcane immediately after harvest. This will create incentives for producers, processors, and marketers along the sugarcane value chain and it will address infrastructure challenges such as poor roads, unreliable power supply, lack of processing, storage and marketing facilities, inefficient supply and poorly integrated supply chains and lack of off-takers for the produce of farmers that often lead to post-harvest losses.
Research institutes should develop improved and high yielding varieties of sugarcane
More improved seed varieties should be developed by the Research Institutes and should be made more available to farmers to improve on the low yields of sugarcane obtained in Nigeria. The Reseach and Technology Innovation Focus (RTI) of the National Sugar Development Council (NSDC) must continue to fund investment in Research and Development and must ensure development of high yielding, disease resistant and pest resistant as well as drought and flood tolerant variesties of industrial sugarcane through strengthening of existing relevant research institutes for raising the poor yield of sugarcane when compared with the five largest cane producing countries.
The Nigerian sugar master plan should be effectively implemented
The Nigerian Sugar Master Plan (NSMP) is a Road Map designed to make the Nigerian Sugar Industry transform into a world class multi-product sugarcane industry. The NSMP lays the ground for enhanced performance of the sugar industry premised on a robust import substitution stategy and attraction of investment through a liberal incentives and policies. The master plan if effectively implemented will address some of the constraints limiting the growth of sugarcane industry in Nigeria.
Development of physical infrastructures
Clearly, physical infrastructure, especially transportation is a major constraint for actors along sugarcane value chain. Deplorable rural road condition is thus a major issue for attention. Good roads will improve access to farms and to markets and will ultimately result in lower unit cost of commodities being purchased and transported. The recurring challenge of low sales and low patronage among farmers will be addressed when there are good roads that link village to village and villages to industrial centres in towns and cities. Investment in infrastructure and new innovative processing technology is required for the modernization and the expansion of local processing industries, as well as for enlarging markets for the outputs of sugarcane industries. Presently, there is weak linkage of farmers to processing factories.
The monopoly of the few sugar processing companies in the country should be broken
This can be done by looking for a technology that can make it possible even for the farmers to produce and process at small-scale level, just as being done in China and India in the case of cotton and apparel industry. There should be small scale processing machine adaptable by the farmers and processors on the small scale level. In this case, the issue of energy and transportation would be addressed so that farmers can engage in processing at reduced cost.
The author has not declared any conflict of interest.
REFERENCES
|
Bamou LT (2002). Promoting Export Diversification in Cameroon: Towards which Products? AERC Research Paper114. African Economic Research Consortium, Nairobi, Kenya.
|
|
|
|
Central Bank of Nigeria (2015). Annual Reports and Statement of Accounts, 2015. CBN, Abuja, Nigeria.
|
|
|
|
|
Central Bank of Nigeria (CBN) (2011). Integrating Nigeria's Agricultural and Financial Value Chains: The Role of Nigeria Incentive Based Risk Sharing for Agricultural Lending (NIRSAL).
|
|
|
|
|
Coffin DP, Lauenroth WK, Burke IC (1993). Spatial Dynamics in Recovery of Shortgrass Steppe Ecosystems. In theoretical Approaches to Predicting Spatial Effects in Ecological Systems. Lect. Math. Life Sci. Eds.R Gardner 23:75-108.
|
|
|
|
|
FAOSTAT (2015). Sugarcane Production in Nigeria.
View
|
|
|
|
|
Gourichon H (2013). Analysis of incentives and disincentives for sugar in Nigeria. Technical notes series, MAFAP, FAO, Rome.
|
|
|
|
|
Klaus F, Monika H (1997). Comparing Measures of Competitiveness. Institut fur Agrarentwicklung in Mittelund Osteuropa Halle, Saale. Discussion Paper. IAMO 2:2.
|
|
|
|
|
Krugman P (1994). The Myth of Asia's Miracle, Foreign Affrairs, 73(6):62.
Crossref
|
|
|
|
|
National Sugar Development Council (2012). Nigerian Sugar Master Plan. NSDC, Abuja, Nigeria.
|
|
|
|
|
Porter ME (1990). The Competitive Advantage of Nations. Harvard Business Review March-April, 1990 Issue.
Crossref
|
|
|
|
|
Schnepf RD, Dolman E, Bolling IC (2003). Agriculture in Brazil and Argentina, Developments and Prospects for Major Field Crops, U.S. Department of Agriculture, Economic Research Service, Agriculture and Trade Report No WRS-01-3.
|
|
|
|
|
Smit AJ (2010). The Competitive Advantage of Nations: Is Porter's Diamond Framework a New Theory that Explains the International Competitiveness of Countries? S. Afr. Bus. Rev. 14:1.
|
|