Full Length Research Paper

ABSTRACT
The study identified all Nigeria’s products of trade, with a view to ascertaining and computing volumes of net trade and corresponding latent gains and or losses sustained in pursuit of Economic Community of West African States (ECOWAS) trade policy objectives. Data were soured from United Nations Commodity Trade (UNComtrade), via Trade Analysis and Information System Window. The inherent most-favored-nations tariffs were identified and applied in computation of the latent revenue gains and losses sustained in pursuit of the sub-regional duty free trade. The net trade (Exports-Imports) and latent revenue gains or losses per product for the years under review were evaluated to ascertain the level to which the country contributes through each traded product in sustaining the regional trade liberalization policy as gauged or inferred. A country being net importer or net exporter of any product is an indication of latent gains or losses in tariff revenue, respectively. The study concludes that Nigeria sustains ECOWAS trade liberalization policy by losing accruable/latent revenues in products where she is net exporter (supplier) to the sub-regional members who import at zero tariff charges, and gains inherent revenues in products where she is a net importer; hence, the losses outweigh gains. All members are advised to pursue and improve the sub-regional trade policy by engaging in production of goods that have extended value chain, culminating to net product exporter status in products where she has a comparative advantage. In this way, members will on the long run maintain an increasing threshold of net export to push the sub-regional policy agenda of growth and development.
Key words: Trade policy, tariff, net trade, revenue gains/losses.
INTRODUCTION
Trade liberalization is a comprehensive term that does not only encompass the flow of goods and services, but also scientific and cultural ideas and values across countries of a sub-region and/or the world. It also facilitates the flow of physical, financial, and even human capital across the borders (Folasade et al., 2020). The empirical evidence on the benefits of globalization and liberalizing capital flows is fairly mixed (IMF, 2003, 2012). Rodrik (1998) and Ostry et al. (2009) find no clear relationship between financial openness and economic growth, whereas Quinn and Toyoda (2008) find that countries with open capital market tend to grow faster. Eichengreen et al. (2011) find that countries that have succeeded in avoiding crises have benefited from capital account liberalization, while countries that have not so succeeded have neither benefited nor suffered on average. The lack of consensus in these studies reflects a variety of differences, ranging from country coverage (advanced, developing, or both; cross-sectional, time series, or panel samples) to the estimation methodology applied (e.g., ordinary least squares (OLS), instrumental variables, two stage least squares, or generalized method of moments (GMM). Trade liberalization is linked with the process of gradual or instant elimination of duties on traded goods and services, and other non-tariff trade barriers such as quotas and voluntary export restrictions. It is also related with elimination of trade-distorting policies, promotion of market access, removal of monopoly powers, and free movement of capital among countries. Trade liberalization has many forms such as free trade zones, free trade area, trade unions, and free trade agreements at bilateral, multilateral, or regional agreements. It has been advocated that during liberalization, developing countries should formulate proper policy for generation of trade revenue or substitution of trade revenue so that public investment in physical plus social infrastructure may not be hurt (Khalil et al., 2018).
Developing countries as found within the ECOWAS neither have nor can they easily search alternative resources to replace tariff revenue against losses occasioned by trade liberalization, because they have no capability to bring further change in their domestic tax structure. Globally, trade liberalization by developing country or region may create problems for public investment in physical infrastructure, while some expenditure components may be difficult to reduce such as politically-sensitive expenditure on military and social security spending (Khattry, 2003).
Since the inception of sub-regional group of West Africa, the trade policy has been designed to increase intra-regional commerce, raise trade volume and generally galvanize the economic activities within the region in such a way as to positively impact on the economic wellbeing of the citizens. The trade policy is also meant to foster the smooth integration of the region into the world economy with due regard for the political choices and development priorities of states in the desire to engender sustainable development and reduction of poverty (ECOWAS, 2021a). Major trade co-operation objective of Economic Community of West African States was to expand the volume of intra-community trade following the removal of both tariff and non-tariff barriers to trade on goods originating from member countries. The trade policy objective was a process expected to be implemented through such interventions like free international trade, common external tariff wall, consolidation or freezing of custom duties, and non-tariff barriers to intra-trade (ECOWAS, 2021d). Others include gradual phasing out of duties on industrial products from community projects over a period of 6-10 years at annual rates of reduction of 10-16.6% depending on the classification of member states based on the level of development, location and importance of customs revenue (ECOWAS, 2021e).
Nigeria’s sub-regional exports refer to goods or services produced domestically, and supplied to customers residing within ECOWAS. Such exports are supposed to occasion inflow of revenue to the supplier. This is because export of goods and or services means selling domestic goods and services to consuming most-favored-nations to earn tariff revenue. However, in ECOWAS sub-region pursuing trade liberalization policy, the reverse is the case as being net exporter leads to latent losses in revenue, while being net importer translates to latent revenue gains. Cagé and Gadenne (2014), opined that one negative side-effect of trade liberalization which has often been underplayed is the fiscal aspect. They stated that opening up to trade typically lowers these revenues, leading to challenges that are widely underappreciated in the developed world. They also noted the evidences that abound from 110 trade-liberalization episodes where tariff cuts lead to lower tax revenues as a share of GDP, especially in poor countries where the drop is highest due to lack of capacity to compensate for lost tariff revenues with domestic taxes. Put differently, her sub-regional imports which refer to goods she demand for consumption, normally from the producing member nations do not attract payment of any import tariffs, while sub-regional exports benefit importing member due to tariff exemptions. Therefore, due to trade liberalization policy option in vogue in the sub-region, importing and exporting member nations neither pay nor receive tariff revenues, which are here referred to as latent revenue gains or losses. It is hypothesized that the level of losses or gains sustained depicts latent contributions per country/product to trade policy sustenance, hence trade cum general development of the sub-region via latent trade tax aversion and conservation for unquantified physical infrastructural improvements over times.
In addition to the trade policy measures, enabling institutions were established by the Community, aimed at taking the community’s economy to the next level. Trade facilitation has been a critical aspect of trade in addition to private sector promotion. The establishment of ECOWAS’ Common Investment Market and the Development of Common Investment Code and Policy are welcome compliments. The establishment of the ECOBIZ World Market Information System is to ensure a positive increase in the activities of the Investment Promotion Agencies of West Africa (IPAWAS) (ECOWAS, 2021b). Again, the development of ECOBIZ platform is to promote the E-commerce in the region. Besides, the establishment of Inter-Institutional Committee under the ECOWAS Trade Negotiation Capacity Building project (TNCB) is targeted towards trade capacity building. In an attempt to guide citizens and prospectors around the world, the Community Computer Centre (CCC) has begun preparations for the development of the data and information exchange software for the regional transit system (ALISA) for which the Centre has already validated the procedures manual with the regional group of experts (ECOWAS, 2021b). It is expected that the Common External Tariff (CET) which took off in January 2015 now has a real opportunity to give a boost to the economies of West Africa while allowing citizens of the area to have a real chance of enjoying the benefits of a trade boost, that will likely lead to an improvement of the implementation of the ECOWAS Trade Liberalization Scheme (ETLS). With the CET, member countries will be paying a uniform tariff at all borders in the sub-region. It is one of the landmarks of ECOWAS known as the CET citizens of West Africa through it, will have a real chance of enjoying the benefits of a trade boost (ECOWAS, 2021b). With this development, an improvement of the implementation of the ECOWAS Trade Liberalization Scheme (ETLS) can now also be safely expected. The CET is an important milestone on the road to the creation of a customs union for West Africa (ECOWAS, 2021b).
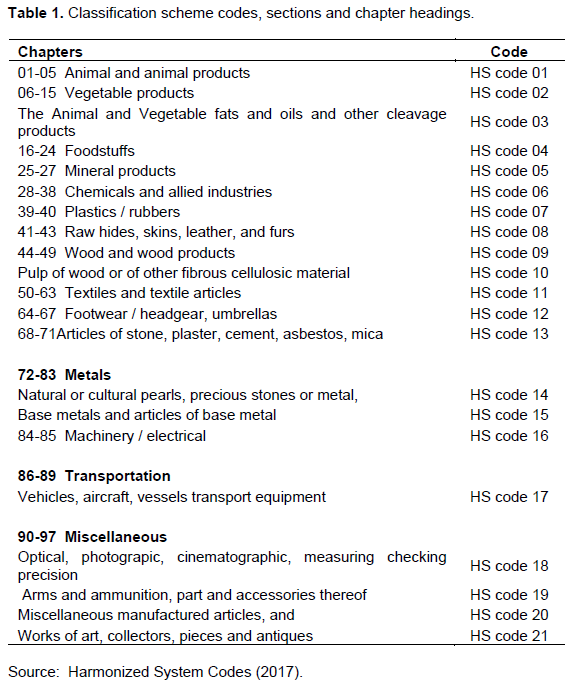
The Harmonized System as an international nomenclature for the classification of products allows participating countries to classify traded goods on a common basis for customs purposes. The HS comprises approximately 5,300 article/product descriptions that appear as headings and subheadings, arranged in 99 chapters, grouped in 21 sections (United Nations Trade Statistics, 2017). In this classification scheme codes, sections and chapter headings, the first four deal with agricultural products; (Harmonized System Codes, 2017). Table 1 shows a summary of these sections.
References made to Nigeria data indicates she had no records in sub-regional trade in 2015 and 2019 for all products of trade, hence trades were not reported, therefore absent in United Nation Commodity trade. It is evident from WITS - UNComtrade Data that Nigeria has no trade records for 2015 and 2019 and as such calculations of latent gains or losses were not extended to these years.
Problem and justification issues of this study are linked to the ultimate objective of establishing ECOWAS in 1975, for the creation of an economic and monetary union, epitomized by the free movement of persons, goods, capital and services as well as a common commercial policy and a CET regime (EPA-ECOWAS, n.d.). The level to which sub-regional members have contributed to sustain the trade liberalization policy viz members’ improved and sustained losses as against gains of accruable latent revenues given the trade liberalization policy implementations are not been ascertained. More so, the volume and net trade for each traded product by members have not been evaluated to infer latent revenue gains or losses by any given member for the growth and development of the sub-regional market economy. This study grades/rates a negative net traded value for any member state as an indication of being net importer, hence has zero contribution to the economy of the sub-region since such position translates to revenue gains given her zero tariff charges on imports from sub-regional suppliers. Latent revenue gains accrue to predominantly net importer country, while latent revenue losses befall net exporter country within the ECOWAS sub-region. Latent revenue gains result from importation of tradable goods and or services from the community without paying commensurate inherent most-favored-nations tariff compared with such payable for importation from countries outside the sub-region, but for her trade liberalization policy of zero tariff regime on importation. The broad objective of the study is to evaluate the latent revenue gains or losses sustained by Nigeria in pursuit of trade liberalization policy, while the specific objectives include to:
i) Assess the pattern of products trade within the sub-region
ii) Evaluate the net trade (Exports less Imports) of the traded products.
iii) Estimate the volume of latent tariff revenue gains or losses by Nigeria in pursuance of trade liberalization policy of the sub-region.
iv) Infer the products where greatest gains and losses are sustained in pursuit of ECOWAS trade liberalization policy objectives.
MATERIALS AND METHODS
The trade between Nigeria and the ECOWAS member nations between 2015 and 2019 were assessed with the aim of ascertaining the latent tariff revenue gains or losses sustained by Nigeria in pursuit of the sub-regional trade liberalization policy objectives. Trade data were sourced from the World Integrated Trade Solution (WITS); a UNComtrade Data from 2015 to 2019. The choice of five year study in 2020 when the study commenced was for currency, moreso, the volume of data involved ran into tens of thousands of tariff line products. Relevant query on traded products were raised on the WITS platform which elicited trade information for the number of manageable years. The trade data obtained has information on harmonized system code nomenclature, trade flow name (Import or Export), trade value (1000 USD), reporter's name, partners name, product code and description among others.
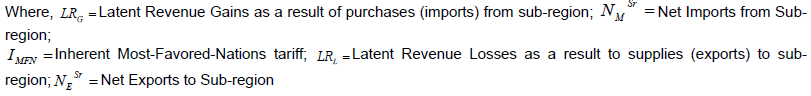
Analyses aimed at evaluating the net trade and latent revenue gains and losses for Nigeria were set out in Equations 1, 2 and 3. Latent tariff revenue losses and or gains were obtained by multiplying the value of net trade for the country product group with inherent most-favored-nations tariff.
Net trade
This was evaluated by the following relationship:

Latent revenue gains and losses
As ECOWAS sub-regional trade policy entails elimination of tariffs on all imports for members, the latent tariff revenue loss by supplier nation constitutes their sacrifice towards pursuing sub-regional trade policy. The potential of each member towards sustaining the trade policy is a function of the level of latent revenue gains or losses sustained in pursuit of the trade policy objectives of the sub-region, estimated thus:


RESULTS
Nigeria’s net trade 2015-2019
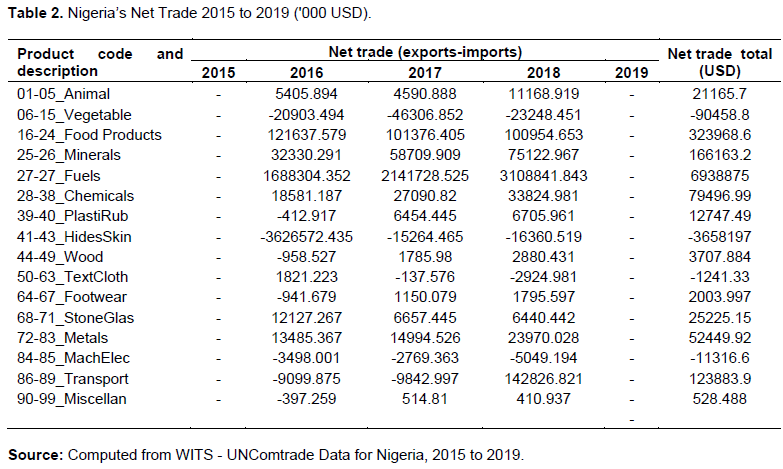
Table 2 presents the net trade values of Nigeria from 2015 to 2019. Following the calculations of Nigeria’s net trade, latent gains and losses in various products, negative net import values are observed as leading to gains in latent revenues because tariff charges that would have paid to supplying member nations were eliminated due to trade policy in place. On the other hand, losses in latent revenue are due to positive net exports, which would have led to revenue accruals to exporter, but pursuance of trade liberalization policy of sub-region led to the loss of the accruable tariff revenues by suppliers of various products of trade in the sub-region (Table 2).
Nigeria’s latent revenue gains or losses due to pursuit of sub-regional trade policy
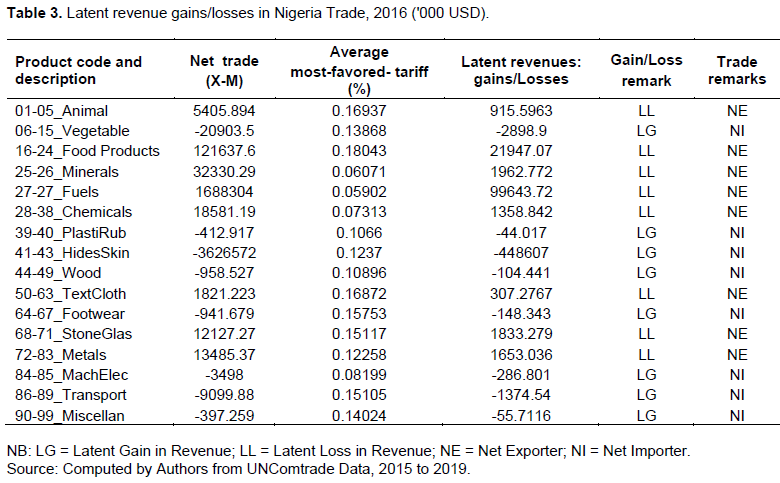
Importing countries do not pay import tariffs due to trade liberalization policy pursued by the sub-region, hence value of which becomes a latent revenue gain, while exporting nations do not receive potential tariff charges, referred to as latent revenue losses (Tables 3, 4 and 5). The products in which Nigeria experienced latent revenue losses in 2016 include, Live animals, Food products, Minerals, Fuels, Chemicals, Textiles and Cloths, Stone Glass, and Metals. The values of the latent gains or losses are as presented in Table 3.
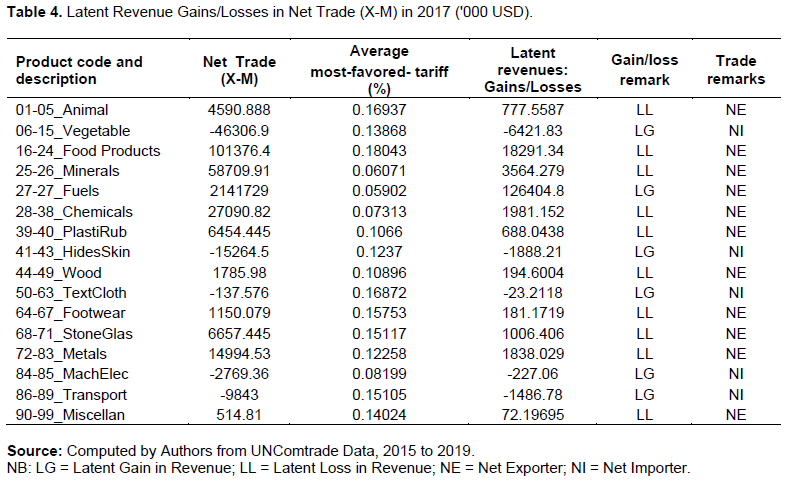
The products in which Nigeria experienced latent revenue losses in 2017 include, Live animals, Food products, Minerals, Chemicals, Plastic Rubber, Wood, Foothwear, Stone Glass, Metals and Miscellaneous Products. The values in thousands of US Dollars of the latent gains or losses in various products codes are as presented in Table 4.
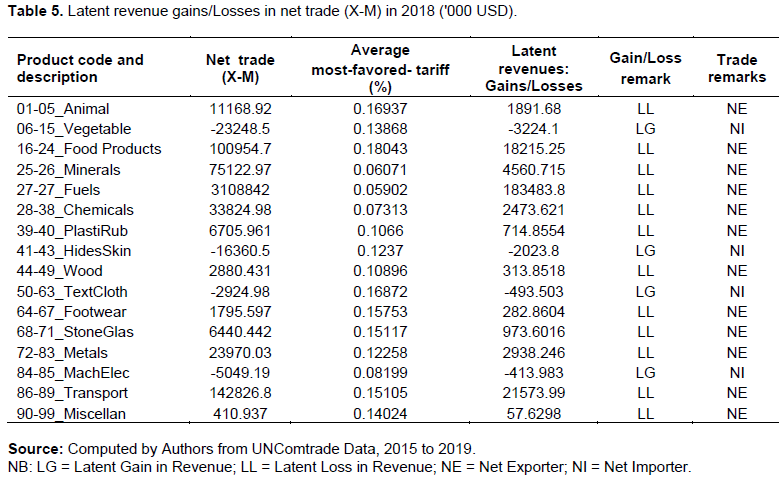
In 2018, the products in which Nigeria experienced latent revenue losses include, Live animals, Food products, Minerals, Fuels, Chemicals, Plastic Rubber, Wood, Foothwear, Stone Glas, Metals, Transport Equipment and Miscellaneous Products. The values in thousands of US Dollars of the latent gains or losses in various products codes are as presented in Table 5.
DISCUSSION
The study examined Nigeria export and import trade in all classes of tradable products within the review period, 2015 to 2019. However, it was evident from the UNCommTrade data that there were no trades recorded for Nigeria in 2015 and 2019, hence computations of net exports and latent tariff revenue gains and losses were carried out for 2016, 2017 and 2019 for all traded products. Net trade figures show net export of 67.33% of the total trade value, while net import stood at 32.67% of the total trade, implying a net exporter trade status in a good number of products traded within the sub-region in review period. The net export trade are dominated by about six products. Leading in export trade is Fuels (product Code 27). They represent 60% of total trade (exports and imports). They are followed by Food Products and Minerals (product codes 14-24 and 25-26) representing 2.81 and 1.44%, respectively of the total trade (exports and imports). Transport equipment is placed fourth, while chemicals is placed fifth, representing 1.07 and 0.69%, respectively of the total trade within the sub-region for the period under review. The sixth dominant export product is Metal (Code 72-78), representing 0.45% of the total trade. Besides, import trade is dominated by about three products with Hides Skins (Code 41-43) leading, representing 31.77% of the total trade for the period. They are closely followed by Vegetable (Code 06-15) and Live Animals (Code 01-05), representing 0.78 and 0.18% of the total trade, respectively, as in Table 1.
Latent revenue gains resulting from the sub-regional trade policy is accruable when gross imports exceeded gross export trade for any particular product by community member (that is, member is a net importer), while latent revenue losses accrue when gross exports exceeds gross imports (that is, member is a net exporter) of any particular product. This means that tariff free imports are inherently revenue enhancing, while exports are inherently revenue reducing because the sub-region has put into force full trade liberalization policy. This study therefore, estimates the latent revenue gains and or losses given the traded product portfolios of various sub-regional members in the light of their trade policy objectives.
Negative net trade values indicate that country imported more than it exported and has gained the revenue that would have been lost as tariff payment to the regional exporting members in any given product. In terms of sustaining of regional trade policy, such country is seen by this study to having less contribution given the amount of gains received against zero tariff sacrifice by a member with whom are jointly pursuing trade liberalization policy. Besides, positive net trade in favor of export values implies losses in revenue that would have accrued to exporter member nation in a given product in a period. In terms of sustaining sub-regional trade policy, such net exporter nations are believed to have contributed more given the amount of losses sustained in pursuit of the trade liberalization policy of the sub-region.
Net imports were calculated by comparing the total value of import trade in 2016, 2017, and 2018 to the total value of similar products exported to the sub-region during the same period of time. A net importer of a product was identified as a member nation that buys more of a particular product from other member countries than it supplies to them over a period of time (Thakur and Vaidya, n.d.). Sub-regional imports by any member nation represents the products purchased from the sub-regional market by residents of the particular member nation, rather than buying domestically produced items in her own smaller market. Notably, imports trigger outflow of revenues from the importing nation. Such transactions involve payments to sellers/suppliers residing outside the region, a most-favored-nations tariff revenue, but the case of ECOWAS sub-region is different due to liberal trade policy put in place. Net imports were measured by comparing the value of the goods imported over a specific time period to the value of similar goods exported during that period. The formula for net imports is: Net Imports = Value of Imports - Value of Exports (Thakur and Vaidya, n.d.).
Net export measures the value of a country's total export of a given product group less the value of the product group imports in any given period. Net exports were calculated by subtracting total imports of similar products from total export of the same products from 2015 -2019. Put differently, it is the estimation of the total value of a country’s exports in particular products minus the total value of its imports of same products for the review period. A positive net exports figure indicates a trade surplus, while a negative net exports figure indicates a trade deficit. A trade surplus or trade deficit reflects a country’s balance of trade (which is, essentially, whether a country is a net exporter or importer, and to what extent). (Corporate Finance Institute, n.d.)
CONCLUSION
It is evident from the study that on the average, Nigeria experiences losses in tariff revenue in at least ten out of the sixteen product groups traded annually within the sub-region in the review period. As net exporters in those products, revenues that would have accrued to her from importing ECOWAS members are lost due to pursuance of sub-regional trade liberalization trade policy objectives. Hence, her contributions in revenue (though latent) to sustaining the sub-regional trade agreement is enormous and outweighs latent gains. However, these gains and or losses with respect to pursuance of policy objective is at variance with (Ahmad et al., 2018), whose empirical results show that quantitative trade restriction is positively linked with trade tax revenue. On the basis of empirical findings, his study suggests that trade liberalization has negative impact on trade tax revenue. This study recommends that all members should pursue and improve the sub-regional trade policy by engaging in productive ventures with extended value chain that will result to net product exporter status in products where they have comparative advantage. In this way, members will contribute and maintain any policy evolved threshold for net export and uphold the sub-regional policy agenda of growth and development on the long run.
CONFLICT OF INTERESTS
The authors have not declared any conflict of interests.
REFERENCES
|
Cagé J, Gadenne L (2014). The Fiscal Cost of Trade Liberalization. PSE Working Paper 2012-27. |
|
|
Corporate Finance Institute. (n.d.). What are Imports and Exports? |
|
|
ECOWAS (2021a). Member states. |
|
|
ECOWAS (2021d). Trade Policy. ECOWAS Common External Tariff. |
|
|
ECOWAS (2021e). Trade Policy. ECOWAS Trade Liberalization Scheme. |
|
|
ECOWAS (2021b).Trade. |
|
|
Eichengreen B, Gullapalli R, Panizza U (2011). Capital Account Liberalization, Financial Development and Industry Growth: A Synthetic View. Journal of International Money and Finance, Elsevier 30(6):1090-1106. |
|
|
EPA-ECOWAS (n.d.). Economic Partnership Agreement - EPA. |
|
|
Folasade BA, Oluwatoyin AM, Jeremiah E, Olumide SA, Romanus O (2020). Assessing the Role of Trade Liberalization in Facilitating Trade Flows and Economic Expansion: Evidence from ECOWAS Countries. |
|
|
Harmonized System Codes (2017). HS Code Current. |
|
|
International Monetary Fund (IMF) (2003). Effects of Financial Globalization on Developing Countries: Some Empirical Evidence Eswar Prasad, Kenneth Rogoff, Shang-Jin Wei and M. Ayhan Kose March 17, 2003. |
|
|
International Monetary Fund (IMF) (2012). Liberalizing Capital Flows and Managing Outflows-Background Paper Prepared by the Monetary and Capital Markets Department; the Strategy, Policy, and Review Department; and the Research Department; in consultation with the Legal Department and other Departments; Approved by Jan Brockmeijer, David Marston, Jonathan D Ostry. |
|
|
Khalil A, Ali S, Ali A (2018). Trade Revenue Implications of Trade Liberalization in Pakistan. MPRA Paper No. 87529. |
|
|
Khattry B (2003). Trade Liberalization and the Fiscal Squeeze: Implications for Public Investment. Development and Change 34(3):401-424. |
|
|
Ostry JD, Prati MA, Spilimbergo MA (2009). "Structural Reforms and Economic Performance in Advanced and Developing Countries," IMF Occasional Paper No. 268 (Washington: International Monetary Fund). |
|
|
Quinn DP, Toyoda MA (2008). Does Capital Account Liberalization Lead to Economic Growth? Review of Financial Studies 21(3):1403-1449. |
|
|
Rodrik D (1998). Who Needs Capital-Account Convertibility? In Essays in International Finance 207 (Princeton: Princeton University Press). |
|
|
Thakur M, Vaidya D (n.d.). Net Exports [Blog]. Wall Street Mojo. |
|
|
UNComtrade, 2015; 2019 data base (2019). Trade and Tariff data. Available @ World Integrated Trade Solutions |
|
|
United Nations Trade Statistics (2017). Harmonized Commodity Description and Coding Systems (HS). Knowledge Base. |
|
|
World Integrated Trade Solutions (2019). Trade and Tariff data. Available @ |
|
Copyright © 2024 Author(s) retain the copyright of this article.
This article is published under the terms of the Creative Commons Attribution License 4.0


