ABSTRACT
South Africa’s agricultural sector is comprised of livestock, field crops and fruit in their order of size, in gross value terms. Agriculture in South Africa accounts for a relatively low share in the economy (3% of gross domestic product - GDP), 6% of employment and about 10% of exports (over R144 billion in 2015). Currently (2015/16), South Africa is experiencing the worst drought in over 100 years, which has resulted in significant effects on agriculture, with eight of the nine provinces being declared disaster areas. The motivation of the study was to understand the severity of drought on agriculture as well the impact on the whole economy (to quantify the economy-wide effects/losses emanating from the drought). To quantify these effects a single-country computable general equilibrium (CGE) model was used. Four scenarios were developed: Impact of field crops losses; impact of livestock losses; impact of aggregated agriculture losses; and impact of aggregated agriculture losses plus drought relief. The analysis shows that all scenarios led to a negative impact on GDP, employment and exports while the drought relief was found to have saved some jobs, albeit not significantly.
Key words: Drought, computable general equilibrium (CGE) model, field crops, livestock and fruit, GEMPACK.
Based on gross value of production, South Africa’s agricultural sector is comprised of livestock (e.g. beef, poultry, game, sheep and others) as the biggest sub-sector, followed by field crops (e.g. maize, wheat, sugar, beans, barley, sorghum and oilseeds) and fruit (e.g. fruits, nuts, flowers and vegetables). Agriculture accounts a relatively small share in the economy (3% of GDP), 6% of employment and about 10% of exports (over R144 billion in 2015) (StatsSA, 2015). From a developmental viewpoint, agriculture plays a pivotal role in ensuring food security and providing jobs for low skilled people in the country. Furthermore, agriculture provides raw materials to secondary sectors such as manufacturing and retail which reduces the country’s dependency on international markets. Thus any disturbance on the agricultural sector will not only affect food security in the country but it will also affect the competitiveness of secondary sectors and tertiary sectors in the South African economy. Currently (2015/16), South Africa is experiencing the worst drought in over 100 years, which has resulted in significant effects on agriculture, with eight of the nine provinces being declared disaster areas. This drought has resulted in a number of livestock losses, cereal crop losses and in fruit losses. Direct losses, as presented in the simulations, alone amount to billions of Rands. Therefore, this paper seeks to quantify the socio-economic impact of drought on agriculture within a broader context of the economy.
The rationale of conducting the study is to inform policy makers of the economy-wide effects of drought in South Africa focusing on food security impacts, job losses and value lost due to drought. Parallel to evaluating the drought effect, the study also evaluates the drought relief program implemented by government to assist farmers to cope with drought. To better capture the impact, a single-country static computable general equilibrium model - more specifically, the University of Pretoria General Equilibrium Model (UPGEM) model - was used. The approach taken here was used in earlier studies such as Dixon and Rimmer (2002) and Bohlmann et al. (2015). The results show that the economy stands to lose or loses because of drought; the impact on macroeconomic variables, including exports, is minimal but negative.
OVERVIEW OF THE AGRICULTURAL SECTOR IN SOUTH AFRICA
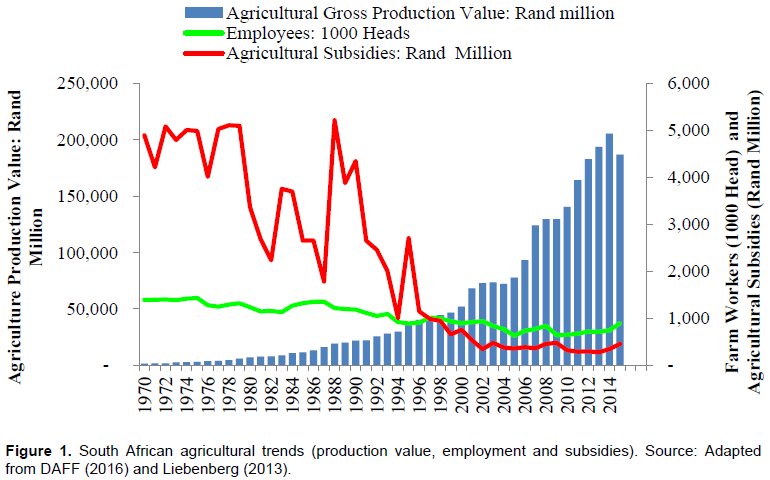
South African agriculture has experienced significant structural changes over the last 30 years fueled by policy reforms that took place in the mid-1990s. The liberalization of agricultural markets in 1996 provided access to various global markets and consequently stimulated agricultural output, which grew from R52.186 billion in 2000 to over R193 billion in 2013 (Figure 1). Liebenberg (2013) argues that production growth during this period was due to export growth in Europe and Asian markets. Figure 1 also shows trends in farm employment and subsidies. Over the reviewed period, farm employment declined from nearly 1.42 million in the mid-1970s to less than 900 thousand by 1995 and further declined to less than 750 thousand in 2013. Agricultural subsidies have also showed a significant decline from the mid-1980s to 2015 caused by South Africa’s trade and market reforms that reduced agricultural protections that is, tariff reduction and agricultural subsidies.

The reduction on agricultural support has exposed agriculture to external shocks such as drought. Smallholder farmers have limited access to irrigation water and possess poor farm infrastructure. As a result of limited farm infrastructure, their capability to withstand drought is very minimal, hence, the current drought has displaced over million smallholder farmers (DAFF, 2016).
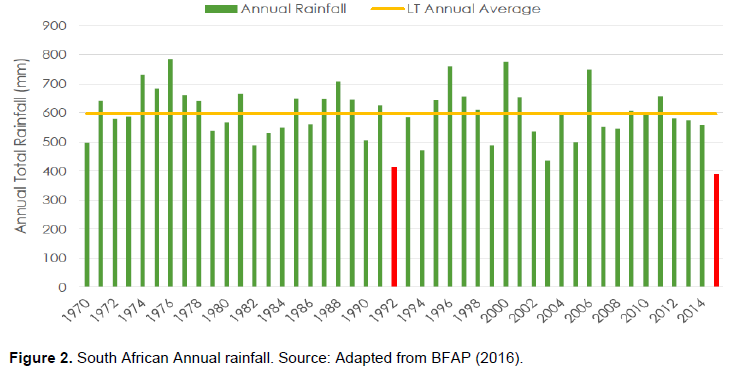
Figure 2 shows a trend in the annual rainfall in the country between 1970 and 2015. It is evident that the rainfall received in 2015 season was the lowest throughout the reviewed period. The need to understand the severity of drought on agriculture as well as on the economy as a whole is drawing attention from researchers and policy makers in the country. To better capture the effect of drought on agriculture in the broader economic contexts, a general equilibrium framework is adopted in this study.
Computable general equilibrium (CGE) models are well-suited to analysing policy questions such as the economy wide impact of drought on agriculture. There are two types of CGE models depending on the number of regional accounts the model has. In cases where there is one regional account the models are known as single country CGE models (for example the UPGEM model) while with two or more regional accounts the model is known as a multi country CGE model (for example the GTAP model). The strength of CGE methodology lies in its ability to capture the various inter-linkages in the real economy in great detail. This inter-linkages ability provides CGE models with a certain advantage over any partial equilibrium models often used in economic analyses of the agricultural sector in South Africa and worldwide. Since data for only one reference year is required for the initial solution to the model, more detail is usually able to be incorporated in the analysis compared to many other econometric methods that require large time-series datasets in order to produce robust simulation results. The large amount of detail to be specified for the agriculture sector in this study, capturing its cost and sales structures along with a number of behavioural parameters, combined with the policy questions within the sector to be addressed in this study, makes CGE the method of choice.
CGE models have also been established as a superior methodology to Input-Output or SAM multiplier models, despite being based on the same underlying set of national accounts (Bohlmann et al., 2015). The ability of CGE models to accurately reflect resource constraints and the impact of relative price changes in the economic decision making process, and ultimately the structure of the economy, are of significant importance in conducting accurate and credible policy analysis.
CGE methodology has been applied in numerous studies to quantify the impact of various shocks to macroeconomic variables in many countries, and a few of these are mentioned next. Berrittella et al. (2004) used a multi-country world CGE model (the GTAP Model) to study the economic implications of climate change-induced variations in tourism demand. Bigano et al. (2006) applied the CGE model to quantify economy-wide effects of two climate change impacts namely, sea-level rise and tourism flows. In a study by Bassanini et al. (1999), a CGE model was applied to simulate the impact of the introduction of an employment conditional scheme in four OECD countries. Using a single-country, static CGE model, Jaafar et al. (2011) quantified the economic impact of pollution tax on the Malaysian economy under the backdrop of trade liberalization. Kaempfer et al. (2007) used a CGE model to examine the consequences of the tariffication of a quota when there are several potential distortions present in a country, including domestic monopoly and wage rigidities.
The UPGEM model used in this study runs on General Equilibrium Modelling Package (GEMPACK) software unlike most other CGE models that run on General Algebraic Modelling System (GAMS) software. This study does not provide a detailed comparison between software packages. A detailed comparison of software packages is documented in Horridge et al. (2013). Also, a detailed explanation of the theory and the structure of the UPGEM model as well as the database was documented in Bohlmann et al. (2015) and Ntombela and Bohlmann (2016).
Description of the model
According to Adams (2005), there are four basic tasks that distinguish a CGE based analysis from other types of analyses. First, with regards to the theoretical derivation and description of the model, the general equilibrium core of UPGEM is made up of a linearized system of equations describing the theory underlying the behaviour of participants in the economy. It contains equations describing, amongst others, the nature of markets; intermediate demands for inputs to be used in the production of commodities; final demands for goods and services by households; demands for inputs to capital creation and the determination of investment; government demands for commodities; and foreign demand for exported goods.
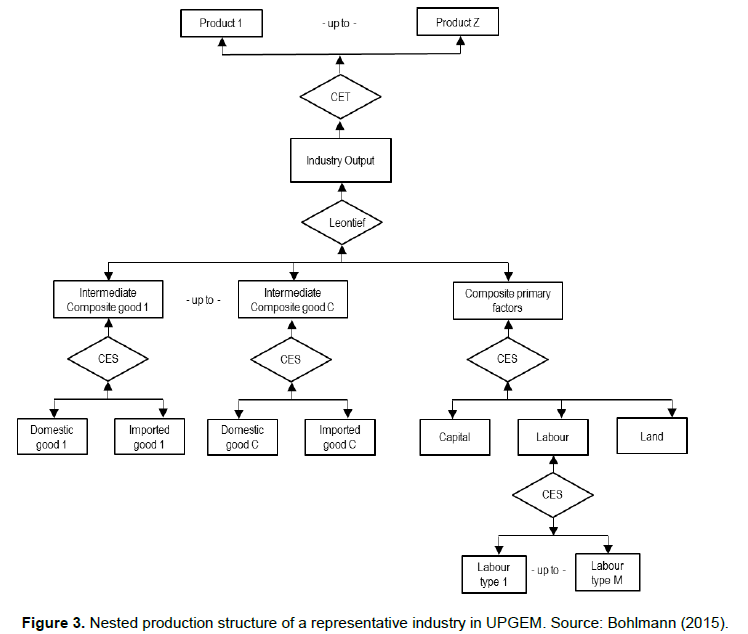
The specifications in UPGEM recognize each industry as producing one or more commodities, using as inputs combinations of domestic and imported commodities, different types of labour, capital and land. The multi-input, multi-output production specification is kept manageable by a series of separability assumptions, illustrated in Figure 3. This nested production structure reduces the number of estimated parameters required by the model. Optimizing equations determining the commodity composition of industry output are derived subject to a constant elasticity of transformation (CET) function, while functions determining industry inputs are determined by a series of constant elasticity of substitution (CES) nests. At the top level of this nesting structure, intermediate commodity composites and a primary-factor composite are combined using a Leontief or fixed-proportions production function. Consequently, they are all demanded in direct proportion to industry output or activity. Each commodity composite is a CES function of a domestic good and its imported equivalent. This incorporates Armington’s assumption of imperfect substitutability for goods by place of production. In UPGEM all industries share this common production structure, but input proportions and behavioural parameters vary between industries based on base year data and available econometric estimates, respectively.

The second task identified by Adams (2005) is calibration, which incorporates the construction of a balanced database and evaluation of coefficients and parameters. As required for CoPS-style models, the initial levels solution of the model is provided by the base year data. The database, in combination with the model’s theoretical specification, describes the main real inter-linkages in the South African economy. As explained in Table 2, the version of UPGEM used in this study is based on a 2011 reference year database that draws mainly from the 2011 supply-use tables published by Statistics South Africa (2015). The core database described in Table 2 contains three sets of information, namely:
1. Coefficients, which represent the basic flows of commodities between users, commodity taxes paid by users and margins flows that facilitate the flow of commodities.
2. Behavioural parameters, which are elasticities that influence the degree to which economic agents change their behaviour when relative prices change.
3. Government accounts, which include South African financial accounts with the rest of the world and relevant interest rate parameters.
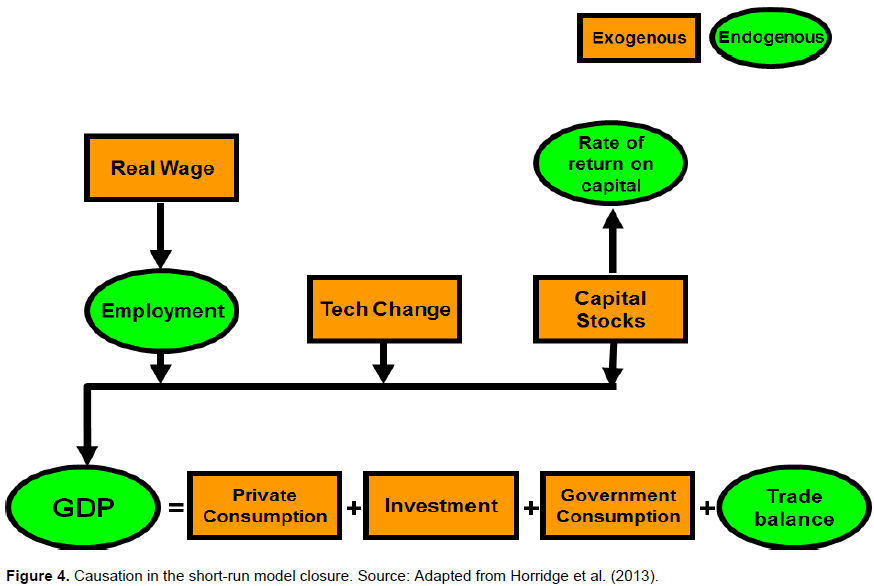
The third task is solving the model using a suitable closure. In this study, we use a static UPGEM model and select a short run model closure to simulate the effects of drought on the economy. Drought is considered a short term problem caused by a significant decline in rainfall received in 2015/2016. The changes caused by drought in agricultural production are expected to vanish in the long term as the economy converges to a new equilibrium. Figure 4 provides a schematic view of variables selected as endogenous, that is, determined within the model, and those selected as exogenous, that is, determined outside the model. In a short run model closure, we make employment flexible but fix the real wage because economic theory posits that real wages are sticky in the short run. All technological variables are exogenous in the model. Capital stock is fixed but the rate of return on capital is allowed to move. Net trade is also flexible, which enables us to determine the effect of drought on agricultural exports given that agriculture is a net exporter. Demand by final users is fixed to baseline level, that is, private consumption, government consumption and investments are exogenous.
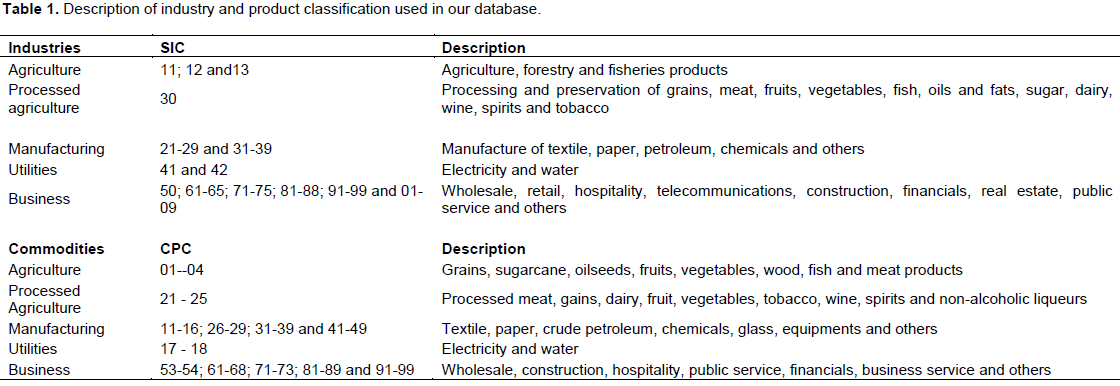
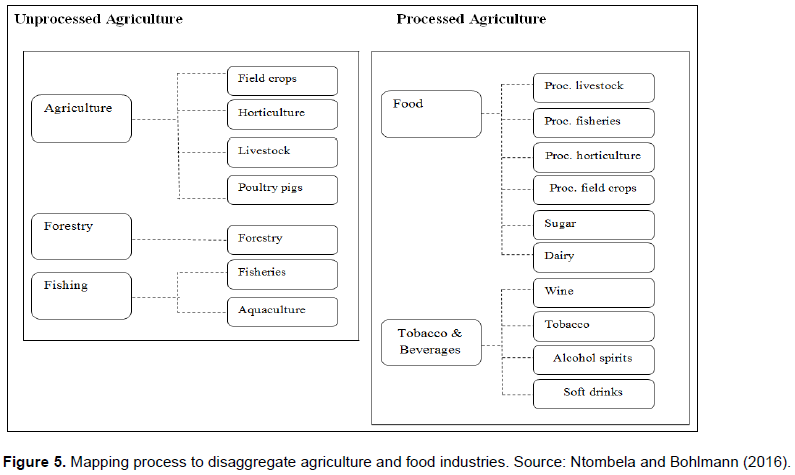
An intensive simulation process was followed which started with the organizing of the dataset and alignment of sectors. The agriculture sector is split into seven industries namely: Field crops, fruit, livestock, poultry, forestry, fisheries and aquaculture. Then the food sector is split into ten industries namely: Processed meat, fish, fruit and vegetables, crops, sugar, dairy, wine, alcoholic spirits, soft drinks and tobacco. The rest of the industries in the database include: Mining, textile, wood, chemicals, manufacturing, electricity, water, construction, retail, hospitality, transport, communication, business services, government and other unclassified. The final database distinguishes 32 industries and commodities (Table 1).
Figure 5 shows the disaggregation and mapping process, which is informed by two documents namely the Standard Industrial Classification (SIC) and Central Product Classification (CPC), both downloadable from Statistics South Africa (2015)(
www.statssa.gov.za).
For simplicity, Table 2 shows an aggregated view of the database highlighting the cost and sale structure of agriculture, food and other sectors within the South African economy. Bohlmann (2016) explains that understanding the cost and sales structure of sectors is imperative for various reasons including, but not limited to the following:
1. From the supply side, understanding the industries that supply intermediate inputs to agriculture and food sectors enable us to know which industries are directly exposed in the short run to any changes experienced by agriculture, such as drought in this case;
2. From the demand side, knowing the final users of products produced by agriculture and food industries allows us to better predict how the drought shock will affect the final users in the economy; and lastly
3. Understanding the primary factors’ cost structure, that is, the capital-labour ratio in the overall cost structure of the agriculture and food industries, helps us to better predict the industries’ short-run supply elasticities as well as the impact of drought on agricultural employment.
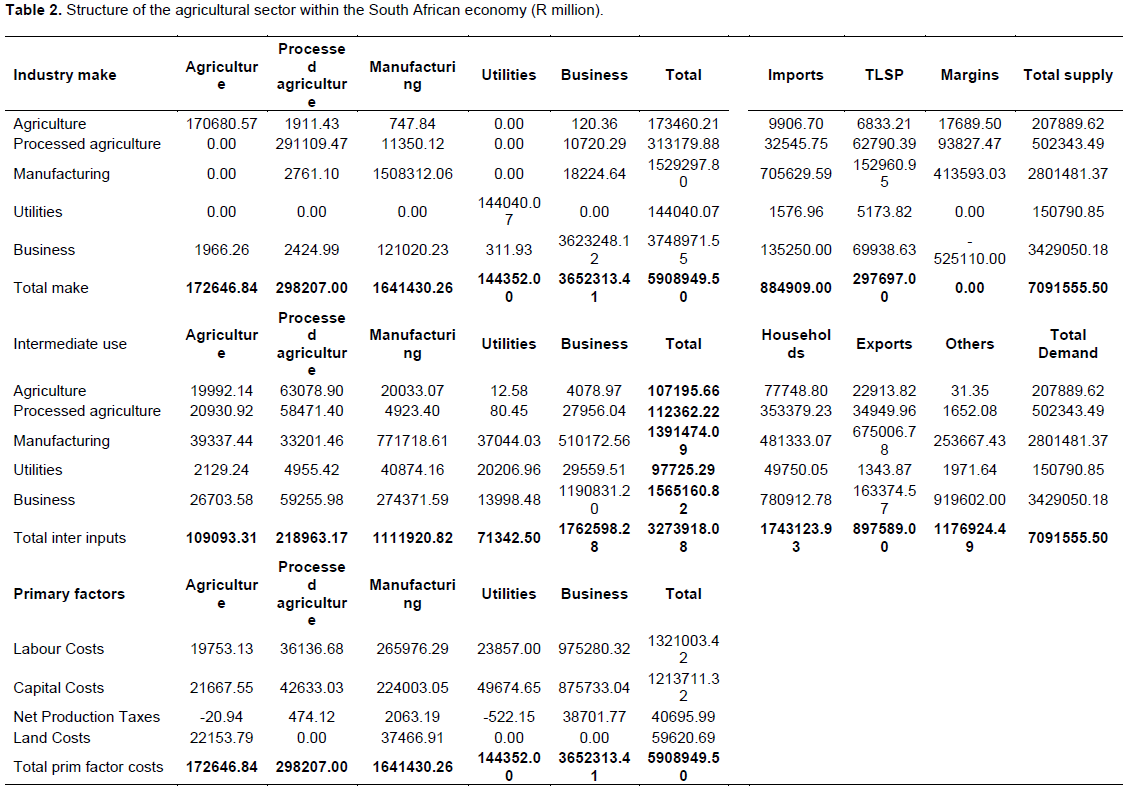
The agricultural sector produced R172 billion worth of products in 2011 across all users in the economy. The agricultural commodities imported in 2011 were worth close to R10 billion less the taxes and subsidies as well as margins which amounted to R24.5 billion. The value of commodities from all sectors within the economy amounted to R5.9 trillion showing that agriculture accounted for just under 3% of the gross domestic product (Table 2). In producing the R172 billion worth of products, the agricultural sector used intermediate inputs worth R109 billion (equivalent to 63% of total production costs), which includes animal feeds, seedlings, fertilisers, agricultural machinery, electricity and water as well as others. In addition, the sector paid nearly R64 billion in compensation for labour and other primary factor costs.
The sales structure of agriculture reveals that R107 billion (equivalent to 57% of total sales) worth of agriculture, forestry and fisheries products are procured by downstream industries, that is food and manufacturing sectors, and used as intermediate inputs. The strong linkages between agriculture and downstream sectors show the importance of this sector in the economy. Agriculture provided live animals worth over R72 billion; grains worth R36 billion; fruits and vegetables worth R38 billion; forestry products worth R20 billion and fishery products worth R3.5 billion to downstream industries for processing. This directly exposes the food and manufacturing industries to the drought problem that is currently facing agriculture. From the sale structure, the rest of agricultural products worth over R100 billion were consumed by export and household users (Table 2).
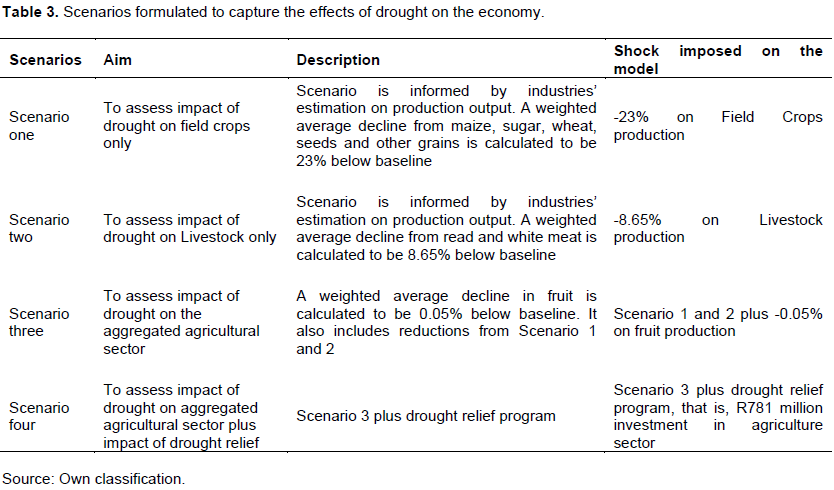
Recognising the devastating effects of drought on agriculture the South African Minister of Agriculture pronounced in his 2016 budget vote a drought relief of R381 million through the Comprehensive Agricultural Support Programme (CASP) and an additional R400 million through the Land Bank. This implies that the government has acknowledged the need to support farmers in order to cope with drought effects, thus implementing the post drought relief program. It is important to understand that such drought relief is distributed in form of animal feeds, grazing field management and water infrastructure (e.g. boreholes and irrigation equipment). This drought relief will be incorporated in the model to determine its impacts in assisting the country to cope with drought. Once the database was completed and checked using the database balancing tests available in the GEMPACK software and explained in Horridge et al. (2013), the study designed four scenarios (Table 3).
Analysis of the results
The currency used in the analysis is the South African Rand and the exchange rate during the base year was to the dollar 1UD$ = R7).
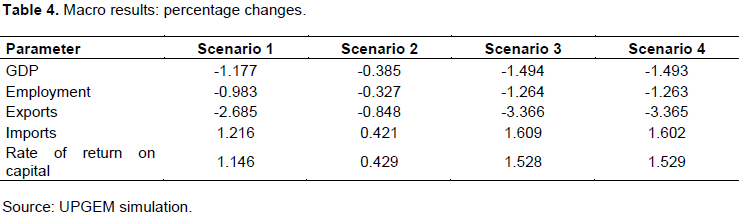
Table 4 provides macroeconomic results on the four scenarios. In this model the macroeconomic variables looked at include the GDP, employment, exports, imports and rate of return on capital. It is very clear from Table 4 that across all scenarios, the effects of the drought are significant and negative. In Scenario 3 whereby both Scenario 1 and 2 are combined with additional losses in the fruit industry, GDP declines by nearly 1.5%, employment declines by 1.3%, exports decrease by 3.5% while imports increase by 1.6% and the rate of return to capital increases by 1.5% all against the baseline. The R781 million drought reliefs announced by the Minister of Agriculture, Forestry and Fisheries in 2016 budget vote was captured under policy Scenario 4 and it has a minimal effect on the economy given the severity of drought.

Scenario 1 and 2 isolate the effects caused by decline only in field crops and livestock respectively. From this, it is evident that the significant impact of drought stems from significant decline in field crops products including
grains, sugar, barley, tobacco, which are in turn used as intermediate inputs in secondary industries.
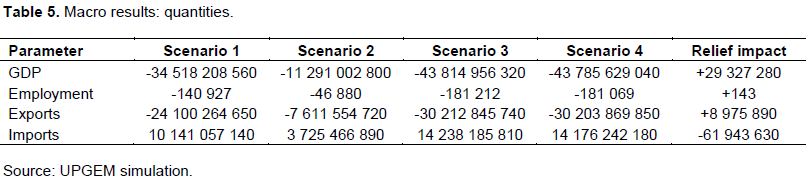
The changes in macroeconomic variables are always better captured when they are presented in terms of actual levels. Table 5 presents the macro results in levels (quantities) form. Although the drought relief is minimal but it has helped rescue nearly 150 jobs from the already lost 181 212 jobs in Scenario 3.
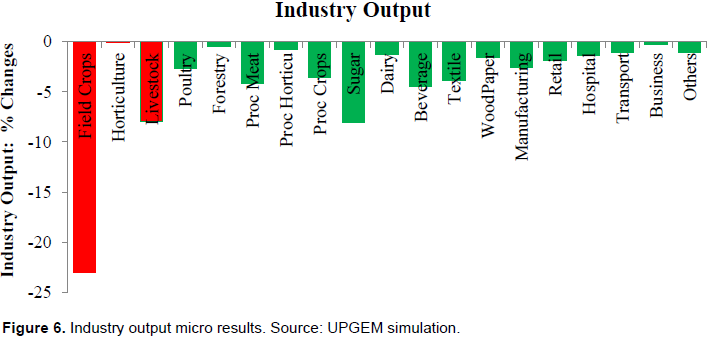
Figure 6 presents results showing the impact of drought on individual industry output. The output in primary agriculture was exogenously decreased by 23% in field crops, less than 1% in fruit and nearly 9% in livestock and collectively such decline resulted in further declines in secondary and tertiary industries. On average, the output of all economic industries declined by 3.5% below the average output with exception in sugar and textile industries, which lose over 5% production each.
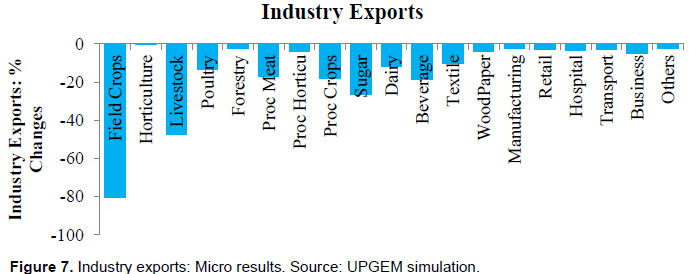
Figure 7 provides industry results indicating that drought is causing a significant decline in exports especially in primary agricultural exports. For example, the 31% decline in maize production results in more than 70% decline in field crops products. The 22% decline in sugar cane reduces sugar production by 26%.
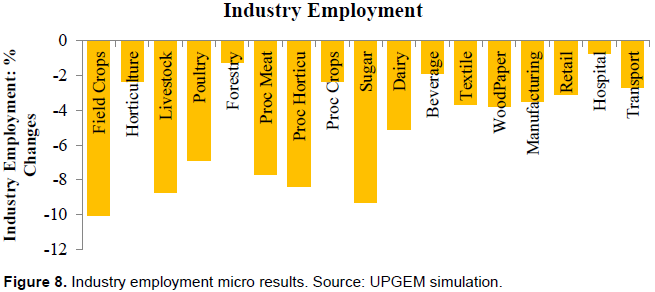
Figure 8 shows the decline in industry employment due to drought. All industries lost employment with food and agricultural industries suffering the most. It can be seen from Figure 6 that the biggest employment losses will be found in the field crops, livestock and sugar. These three depend mostly on rain fed pasture or on rainfall for planting. It is important to note that the impact of drought on employment in all sectors stands to be negative.
In this study we employed the UPGEM model to estimate the impact of drought on the South African economy. The UPGEM model is a CGE-based model that is made up of a linearized system of equations describing the theory underlying the behavior of participants in the economy. Its CGE-based structure enables the capturing of the various inter-linkages in the real economy in great detail, which in turn makes this model well-suited to analyzing policy questions such as the economy wide impact of drought on agriculture.
Four scenarios are analysed namely: (1) Impact on field crops only; (2) Impact on livestock only; (3) Impact on aggregated agriculture output; and (4) Impact on aggregated agriculture output plus impact of drought relief. It was found that all scenarios reflected a negative impact on aggregate GDP, employment and exports. In Scenario 4, drought relief was found to have saved some jobs, albeit not significantly. The overall conclusion from this study is that the 2015/16 drought has resulted in a negative impact in South Africa’s economy. The intervention by government mainly through the Department of Agriculture, Forestry and Fisheries’ drought relief has assisted in saving some of the jobs that could have been lost due to drought. The amount injected as drought relief is clearly not enough, which speaks to fiscal constraints that South Africa as a country faces under the currently difficult economic climate. One of the lessons learnt from this drought is that more concerted effort by all stakeholders is required to prevent potential catastrophic implications of any future droughts.
The authors have not declared any conflict of interests.
REFERENCES
|
Adams PD (2005). Interpretation of results from CGE models such as GTAP. J. Policy Model. 27:941-959.
Crossref
|
|
|
|
Bassanini A, Rasmussen JH, Scarpetta S (1999). The Economic Effects of Employment-Conditional Income Support Schemes for the Low-Paid: An Illustration from a CGE Model Applied to Four OECD Countries. OECD Economics Department Working Papers No. 224.
Crossref
|
|
|
|
|
Berrittella M, Bigano A, Roson R, Tol RSJ (2004). A General Equilibrium Analysis of Climate Change Impacts on Tourism. FEEM Working Paper No. 127.04.
Crossref
|
|
|
|
|
Bigano A, Bosello F, Roson R, Tol RSJ (2006). Economy-Wide Estimates of the Implications of Climate Change: A Joint Analysis for Sea Level Rise and Tourism. FEEM Working Paper No.135.2006.
Crossref
|
|
|
|
|
Bohlmann HR (2016). The South African Transport Service Sector: Overview and Base Case Scenario. Report prepared for CSIR. Unpublished.
|
|
|
|
|
Bohlmann HR, Van Heerden JH, Dixon PB, Rimmer MT (2015). The Impact of The 2014 Platinum Mining Strike in South Africa: An economy-wide analysis. Econ. Model. 51:403-411
Crossref
|
|
|
|
|
Bureau for Food and Agricultural Policy (BFAP). (2016). Policy Brief on the 2015/2016 Drought. Available online: www.bfap.co.za. [Accessed 20 May 2016]
|
|
|
|
|
Department of Agriculture, Forestry and Fisheries – DAFF and National Agricultural Marketing Council – NAMC (2016). Affected Livestock Numbers Per Province in South Africa. CASP Internal Report, Unpublished.
|
|
|
|
|
Dixon PB, Rimmer MT (2002). USAGE-ITC: Theoretical Structure. Centre of Policy Studies, Monash University, Australia
View
|
|
|
|
|
Henrich J, Boyd R, Bowles S, Camerer C, Fehr E, Gintis H, McElreath R (2004). Overview and synthesis. In: Foundations of human sociality, ed. J. Henrich, R. Boyd, S. Bowles, C. Camerer, E. Fehr, & H. Gintis, Oxford University Press. [GG] pp. 8-54.
Crossref
|
|
|
|
|
Horridge M, Meeraus A, Pearson K, Rutherford TF (2013). Solution Software for Computable General Equilibrium Modeling. Handbook Comput. General Equilibrium Model 1:1331-1381.
|
|
|
|
|
Jaafar AH, Al-Amin AB, Siwar C (2011). A CGE Analysis of the Economic Impact of Output Specific Carbon Tax on the Malaysian Economy. Int. J. Environ. Sci. 1(2):151-161.
|
|
|
|
|
Kaempfer WH, Ross MT, Rutherford TF (1997). Tariffication of a distorted economy: a CGE analysis. Rev. Dev. Econ. 1(2):207-218.
Crossref
|
|
|
|
|
Liebenberg F (2013). South African Agricultural Production, Productivity and Research Performance in the 20th Century. PhD Thesis, Department of Agricultural Economics, Extension and Rural Development, University of Pretoria, South Africa.
|
|
|
|
|
Ntombela SM, Bohlmann HR (2016). Structural Changes in the Agricultural Sector: Construction of Agriculture Focused CGE Database and Analysis. (Forthcoming)
|
|
|
|
|
StatsSA (Statistics South Africa) (2015). Quarterly Labour Survey. Available onlive at
View (Accessed on 10 May 2016
|
|