ABSTRACT
This study is set to examine the possibility of maximizing the returns of Egyptian vegetable exports: fresh potatoes, onions, and tomatoes, through the optimal distribution of exports to international markets. Linear programming model is formulated to determine the optimal distribution of exports among the importing countries. This model is restricted by export capacity, import capacity, and suggested organization constraints, determining the optimal plan for various scenarios. The mathematical analysis is based on secondary data from the Central Agency for Public Mobilization and Statistics of Egypt and the United Nations Comrade Database for the period of 2010- 2014. The model solution is obtained using the General Algebraic Modeling System (GAMS). The results show that the major export markets for Egyptian potatoes are Russia, Italy, and Germany, representing altogather about 69% of Egyptian exports. For Egyptian onions, Saudi Arabia, Kuwait, Jordan, and Syria together accounted for 77% of the total exported quantity. For Egyptian tomato exports, Syria, Saudi Arabia, Libya, and Iraq accounted for 85% of the total tomatoes exports from Egypt. The results of the various scenarios showed that there is a prospect to increase the Egyptian export returns through geographical re-distribution of exports from potatoes, onions, and tomatoes. Under the capacity of export-import constraints (Scenario No. 1), the total export value would increase by 19.26, 33.95 and 45.30% for potatoes, onions, and tomatoes, respectively. Under countries group constraint (Scenario No. 2), the export value increases by 12.67, 26.49 and 35.85% for these crops, respectively, more than the current export values. Under the suggested model (Scenario No. 3), the export value would increase by 9.56, 25.45 and 25.26% for potatoes, onions, and tomatoes respectively, much more than the current values of exports. Egyptian exports of potatoes would be directed to many countries: the United Kingdom, Greece, Italy and Russia. For onions, higher quantities would be exported to Saudi Arabia, Kuwait, Belgium, and Romania. The most important export markets for Egyptian tomatoes would be Iraq, Italy, Syria, and Saudi Arabia. The study recommends to re-distribute the Egyptian exports of vegetable crops in the international markets to maximize export returns. These models can be used as a tool for the Egyptian decision makers about optimum export distribution for export development.
Key words: Optimal geographic distribution, export development, linear programming, optimization technique.
The Egyptian exports play an important role in economic development especially agricultural exports. Agricultural exports are one of the most important sources to increase the foreign currency. Thus, it is necessary to focus on promoting Egyptian agricultural exports. It is thereby one of the most important pillars of the economy that help to overcome trade balance deficit. Agricultural exports constitute a proportion of Egyptian total exports, representing about 10.60% of the total exports during the period 2001-2014 (FAOSTAT, 2017). The export of potatoes, onions, and tomatoes is the most important vegetable exports. Therefore, increasing the value of vegetable exports have a significant impact on agricultural export and economic development. Hence, maximizing the return of agricultural export in general and vegetable export in particular is one of the important cornerstone of development.
The total vegetable exports value accounted for USD 969 million representing about 24% of Egypt's agricultural export value as average of the period of 2010 - 2014. Potatoes, onions, and tomatoes export values reached about USD 305, 194, and 43 million representing 31.40, 20.05 and 4.44%, respectively, of the total vegetable export value (UN Comtrade 2016). Despite the low contribution of tomatoes export value in total vegetable export value, its importance comes from the fact of being one of the most essential food commodities as well as acting as a safeguard for many health problem. It is important to understand the actual and optimal distribution patterns of marketed crops to international markets in order to promote Egyptian agricultural exports.
Although Egypt has a comparative advantage in producing vegetable crops, the exporting sector is facing many constraints that are associated with many importing countries differing in export prices and the importing capacity.
Egyptian vegetable exports are spread among more than 25 importing countries in the world, especially for potatoes, tomatoes, and onions. In addition, the fluctuation in exported quantities is resulted in losing Egypt's market share in favor of competing countries. This requires a review of the geographical distribution of vegetable export in different world markets to ensure a share of Egyptian vegetables and maximize the return on export of the same quantity. This needs determining the optimal geographic distribution of vegetables exports especially the most important crops potatoes, tomatoes and onions.
This study mainly aims at optimizing the returns of vegetable export in the importing markets in order to increase the export earnings of Egypt. Specifically, there are three aims to reach. First, understanding the current geographical distribution of export of the most important vegetable crops: fresh potatoes, onions and tomatoes. Second, developing an optimization model to ensure the optimal distribution of export for these crops, and re-distributing of exports for potatoes, onions and tomatoes in different foreign markets to increase the Egyptian export earnings. This model is to serve as a tool for policy makers of planning in export development. To reach the objective of this study, first is a presentation of the methodology and data with special emphasis on the mathematical model formulation. This is followed by the model results and discussions, along with the overall recommendations.
Model specification
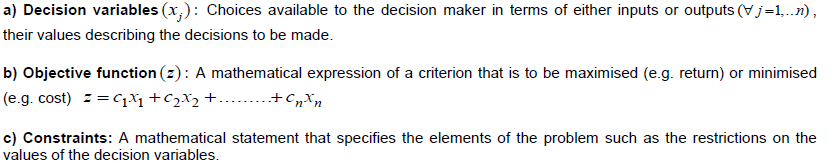
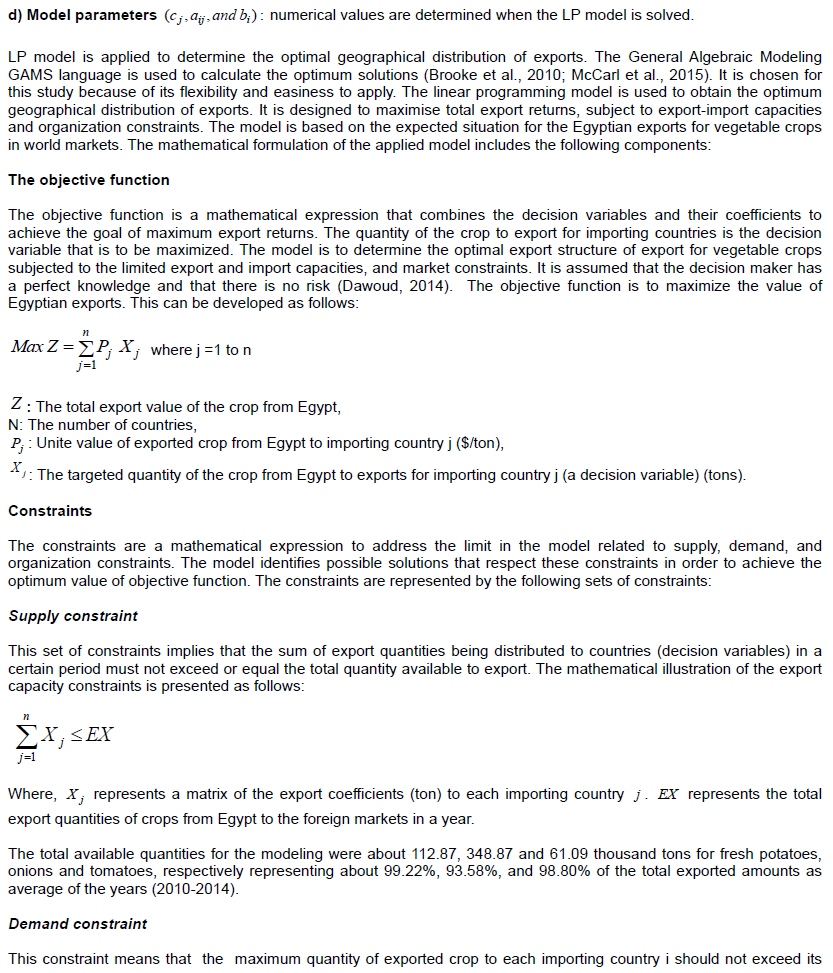
The study depends on the descriptive and quantitative methods, using linear programming model to determine the optimal distribution pattern of vegetable exports. Linear Programming (LP) is a mathematical technique used in computer modeling to find the best or optimal solution to resource allocation problems. LP model is a well suited for this study because of the following reasons: (a) many activities and restrictions can be considered at the same time,(b) an explicit and efficient optimum seeking procedure is provided, (c) with a once-formulated model, results from changing variables can easily be calculated, (d) the policy instruments can be incorporated by means of additional or modified activities in the models (Hazell and Norton, 1986). The main components of any constrained LP problem are (Hillier and Lieberman, 2009):
total imported capacity of the country. Assuming that there is no demand increase during a year, demand constraints can be written as:
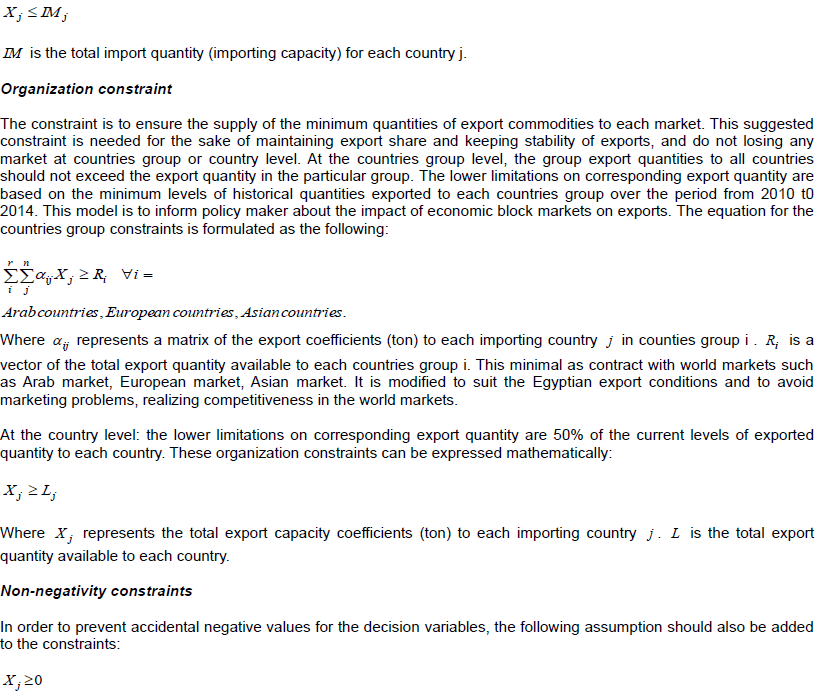
The first two which constraints are obligatory while the organisation constraints are optional. The planner can introduce them to take into account some other limitations such as market constraints. The model is applied in three possible future scenarios in accordance with organization constraints (from Scenario No. 1 to Scenario No. 3) in order to determine the impact of each policy alternative separately. Scenario No. 1 considers only supply and demand constraints that include first and second constraints, thus providing the impact of export and import capacities constraints on the value of exports. Scenario No. 2 a lower limit over the same period from 2010 to 2014 is placed on the export quantity allocated within each countries group. Scenario No. 3 differs from Scenario No. 2 by limiting the minimum export quantity to be allocated to each country. The lower limit on corresponding export quantity is 50% of the current levels of exported quantity to each country.
Data source
This study is based on data from the Central Agency for Public Mobilization and Statistics (CAPMAS, Unpublished), the National Centre for Information, Egypt, and the United Nations Commodity Trade Database (UN COMTRADE) along with other data and references related to the subject of this study from the internet. For modeling optimization problems the General Algebraic Modeling System (GAMS) is designed (Brooke et al., 2010). Data are entered in familiar list using GAMS. Models are presented in algebraic statements that are easy to read. In the mathematical analysis, the selection of the countries is based on the relative importance of geographical distribution during the period 2010-2014.
Current distribution of Egyptian vegetable exports to international markets
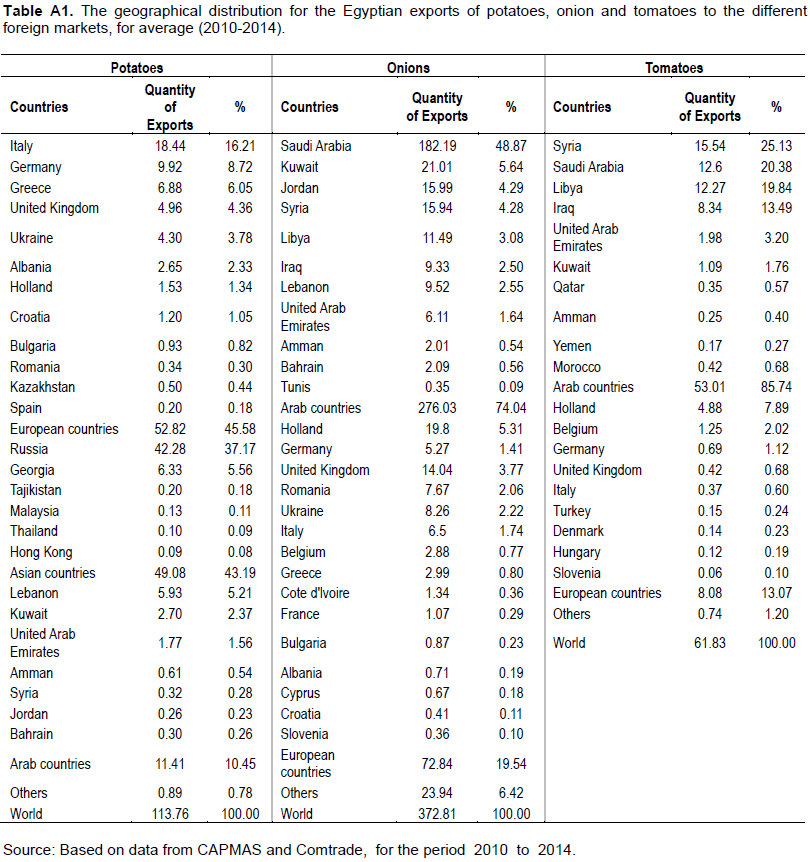
Here presents the current geographical distribution for Egyptian exports of vegetable crops. The current study focuses on exported quantities from fresh or chilled potato, onion, and tomato crops. The exports of these crops are delivered to more than 25 countries in the world. Appendix Table A.1 in the Appendix shows the composition of Egyptian exported crops by importing countries and regions over the period 2010-2014, as follows.
Potatoes
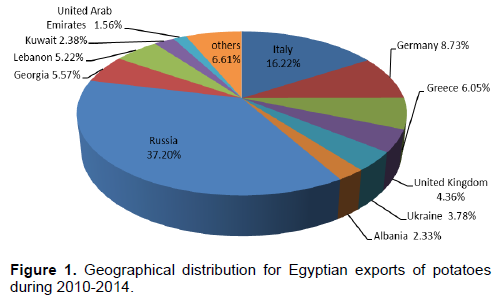
During the period under consideration, EU region was the largest importer of Egyptian potatoes, representing 45.58% of the total Exports. Asian countries ranked second, followed by Arab markets. European countries are mainly restricted to following number of countries: Italy, Germany, Greece, United Kingdom, and Ukraine. More interesting, diverse states namely Italy, Germany, Greece, United Kingdom, Ukraine, Russia, Georgia and Lebanon represented about 87.06% of Egyptian exports for potatoes in 2010-2014. Figure 1 shows geographical distribution for Egyptian exports of Potatoes by major importing countries over the period 2010-2014. The Russian market is one of the most importing Egyptian
fresh potatoes, importing 42.28 thousand tons with relative importance of about 37.20%. The quantity exported to Italian market from fresh potatoes was about 18.44 thousand tons accounted for 16.22% of the total quantity of Egyptian exports over the same period. Germany, Greece, Georgia, Lebanon and United Kingdom were also among the importing countries of potatoes representing about 8.73, 6.05, 5.57, 5.22 and 4.36% of the total potato exports from Egypt during the same period, respectively.
Onions
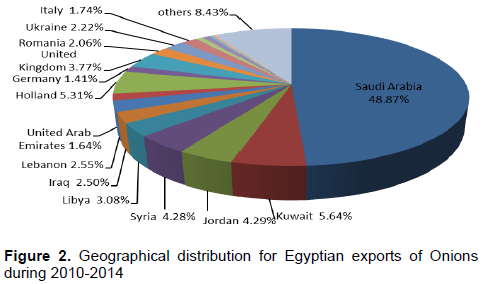
The Saudi market is one of the significant markets importing Egyptian onions. Table A.1 in the appendix shows the quantity exported to Saudi Arabia from onions is about 182.19 thousand tons representing about 48.87% of the total exported quantity to world markets. Also, Egypt's exports of onions were directed to the markets of Kuwait, Holland, Jordan, Syria, and United Kingdom with share of 5.64, 5.31, 4.29, 4.28 and 3.77% respectively, of the Egyptian onions exports to the foreign markets during the period (2010-2014) (Figure 2).
Tomatoes
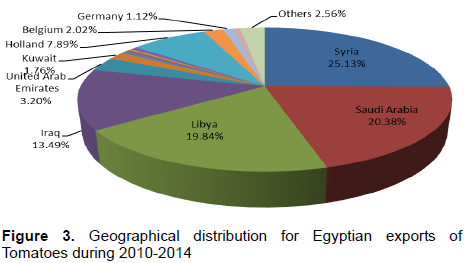
During the period (2010-2014), Arab countries were the largest importer of Egyptian tomatoes exports. Appendix Table A.1 in the Appendix shows the geographical distribution of fresh tomato exports to major importing countries. The exported quantity of Egyptian tomatoes to Syria was about 15.54 thousand tons as an average for the period (2010-2014), representing about 25.13% of the total tomato's exported quantity. It was followed by Saudi Arabia (20.38%), Libya (19.84%), and Iraq (13.49%). These top four importers, taken together, accounted for about 78.84% of the total tomato exports from Egypt during the same period. Holland was the biggest importer of Egyptian tomatoes in European market, with a share of 8% of the total Egyptian tomato exports. The rest of the countries share a very small proportion (Figure 3).
Optimal distribution of Egyptian vegetable exports to international markets
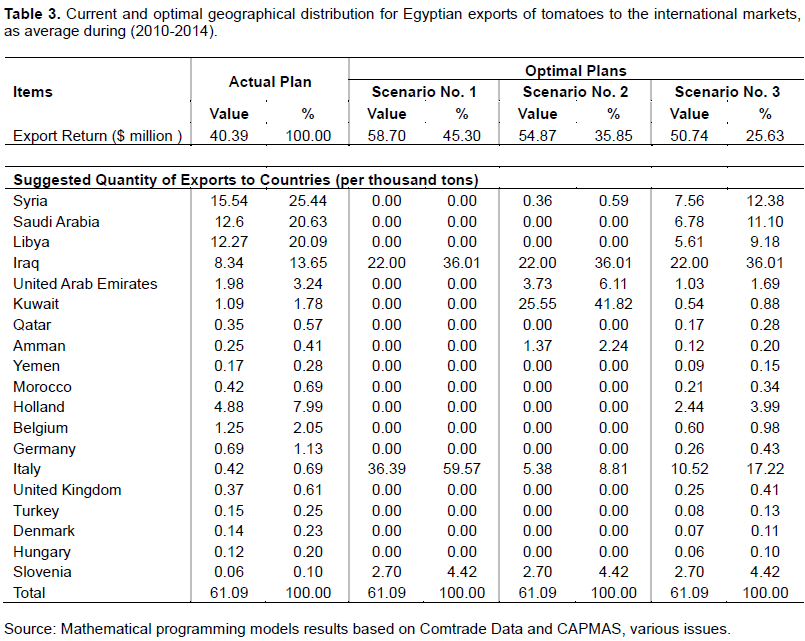
The LP model is used to find the optimal distribution pattern of the export crops under study. In order to calibrate the model, the actual distribution plan for the reference average of years 2010-2014 are compared with the results generated by the mathematical models. Tables 1, 2 and 3 compare the optimal values of the total Egyptian export returns and export quantities to international markets in the three scenarios vs. the actual distribution pattern.
Optimizing the total return for Egyptian potato exports in international markets
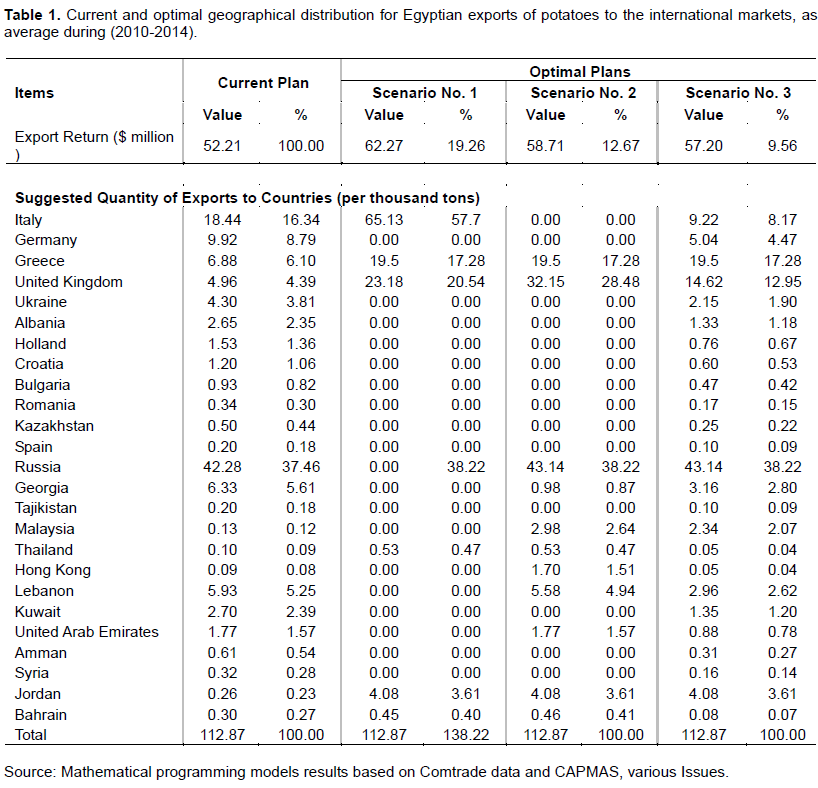
Here accounts for optimal scenarios to increase the Egypt's export returns. The results of the LP models are shown in Table 1. The first scenario represents the total exported quantity of potatoes being distributed to high price countries according to imported capacity. It suggests, the total exported quantities distributed to Italy, United Kingdom, Greece and Jordan with shares of 57.70, 20.54, 17.28 and 4.08%, respectively, because of their high export prices. Under this scenario, the total export returns are increased by 19.26% above the actual total returns.
Scenario No. 2 maximizes the value of Egyptian potato exports subject to countries group constraint. The constraint is to ensure the supply of the minimum quantities of export commodities for each countries group during 2010-2014. These countries were Arab countries, European countries, Asian countries. European countries were the largest importer of Egyptian export potatoes, representing 51.56% followed by Asian countries (49.33%) and Arab countries constituting (10.53%) of the total potato exports from Egypt during 2010-2014. The largest increase in exported potatoes will be to the United Kingdom, Greece, Russia, and, Jordan. There is a potential to generate an estimated export returns equivalent to about 12.67%, that exceed the current export returns. Scenario No. 3 assumes that the lower exported quantity of potatoes to each country is 50% of the actual exported quantity. The most important countries, which appear in the model results include United Kingdom, Greece, Russia, and Jordan. Egypt's potato exports will increase in countries like the United Kingdom and Jordan. The other countries will remain at minimum levels. The scenario No.3 generates a high export returns about US $57.20 million equivalent to almost 9.56% exceeding the actual total export returns.
Optimizing the total return for Egyptian onion exports in international markets
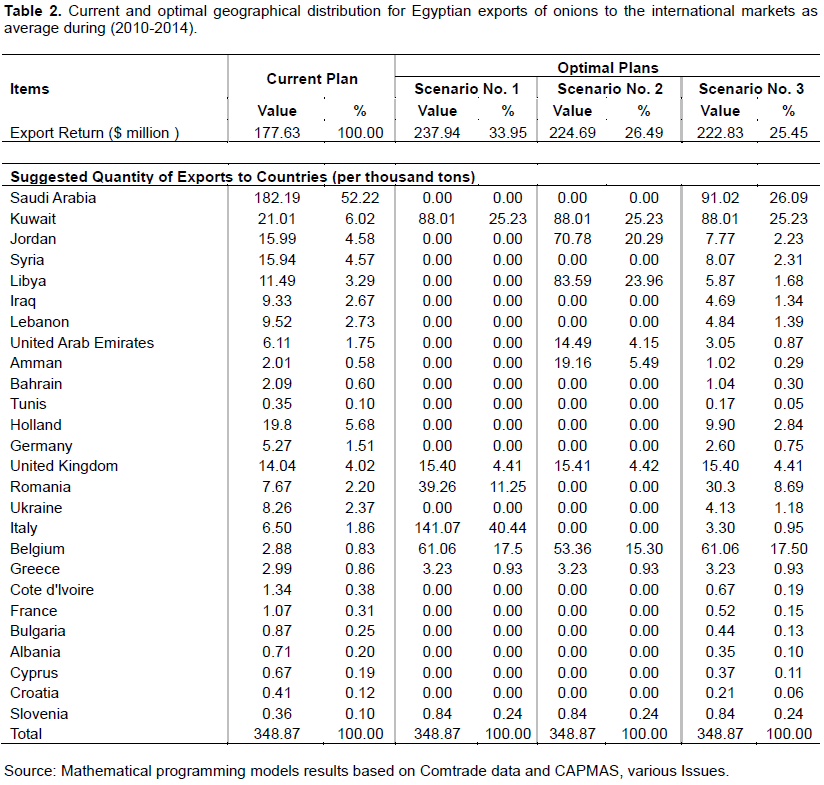
The results of the LP models for onions exports are shown in Table 2. The first scenario suggests that the total exported quantities distributed to Italy, Kuwait, Belgium, Romania and United Kingdom with a share of 40.44, 25.23, 17.50, 11.50 and 4.41% respectively more than the actual export returns, because of their high export prices. This optimum distribution has been coupled with about 33.95% increasing in the total export returns compared to the current situation.
Scenario No. 2 maximizes the value of Egyptian onion exports subject to countries group constraint. Arab countries were the largest importer of Egyptian onion exports, representing about 79% of total Egyptian exports, followed by European countries (21%) of total onion exports from Egypt during 2000-2014. Egyptian onions would be exported to many countries of the world: Kuwait, Libya, Jordan, Belgium, Amman, United Arab Emirates and United Kingdom. The results indicate that the total export returns are increased by 26.49% more than the actual total export returns. For scenario No. 3, the export quantities to Saudi Arabia, Kuwait, Belgium and Romania will increase with a share of 26.09, 25.23, 17.50 and 8.69% of total Egyptian onion exports. The other countries will remain at minimum levels. Scenario 3 generates a high export returns about US $ 222.83 million equivalent to nearly 25.45% more than the actual total export returns.
Optimizing the total return for Egyptian tomato exports in international markets
As shown in Table 3, the first scenario suggests the total exported quantities distributed to Italy and Iraq with a share of 59.57 and 36.01%, respectively, of the total Egyptian exports. This could be as a result of high export prices. Under this scenario, the total export returns are increased by 45.30% above the actual total returns. Scenario No. 2 maximizes the value of Egyptian tomatoes exports subject to countries group constraint. Arab countries are the largest importer of Egyptian tomato exports, representing 86.87% of the total Egyptian exports. The Scenario shows that the total returns are increased by 35.85% above the actual total net returns. The results of scenarios 3 show that the minimum level is considered by 50% of the actual levels of export quantity to each country. Iraq was largest importer of Egyptian tomato exports, representing 36.01% followed by Italy, (17.22%), Syria (12.38%), and Saudi Arabia (11.10%) of total Egyptian potatoes exports during 2010-2014. The other countries will remain at minimum levels. The results indicate that there is a prospect to generate an estimated export returns equivalent of US $ 50.74 million representing about 25.63% more than the actual total export returns.
Regarding the results of the above analysis, the major potato export markets are Russia, Italy, Germany, Greece, and Lebanon representing about 82% of Egyptian exports from potatoes. The most important countries that import Egyptian onions are: Saudi Arabia, Kuwait, Jordan and Syria accounting together for 77% of total quantity exported to the world markets. Arab countries were the largest importers of Egyptian tomato exports. The top four importers Syria, Saudi Arabia, Libya and Iraq, together representing about 85% of total tomato exports from Egypt.
Based on the results of the suggested mathematical model to explore optimal distribution pattern for vegetable exports, the following conclusions could be deduced:
i) There is a likelihood for improvement in total returns to Egyptian vegetable exports through the optimum geographical re-distribution of crop exports.
ii) The largest increase in Egyptian fresh potato exports will be to United Kingdom, Greece, Russia, and, Jordan.
iii) The most important countries where higher export quantities of Egyptian onions are involved Saudi Arabia, Kuwait, Belgium and Romania.
iv) The most important import markets for Egyptian tomato exports are Iraq followed by Italy, Syria, and Saudi Arabia
Several recommendations would be made for the future export development policies in Egypt as follows:
i) Producers should be advised to produce high value export crops and increase their production to meet the growing foreign demand.
ii) Government should encourage investment in production projects for export and improve distribution export pattern.
iii) Maintaining Egypt's position of vegetable exports in the actual international markets to meet their needs with the required quality of crops.
iv) The applied mathematical models can be used to provide information to decision makers about likely optimal distribution policy alternatives for export development.
The authors have not declared any conflict of interests.
REFERENCES
|
Brooke A, David K, Alexandr M, Ramesh R (2010). General Algebraic Modeling System- GAMS User's Guide V.20 Rewood Press, California, USA.
|
|
|
|
CAPMAS (Unpublished). Central Agency for Public Mobilization and Statistics (2010 - 2014), the National Centre for Information, unpublished data Egypt.
|
|
|
|
|
Dawoud SZ (2014). Economic Optimal Allocation of Irrigation Water In Egypt. J. Dev. Agric. Econ. 6:472-480.
|
|
|
|
|
FAOSTAT (2017). The database of the United Nations Food and Agriculture organization statistical database.
View.
|
|
|
|
|
Hazell PBR, Norton RD (1986). Mathematical Programming for Economic Analysis in Agriculture, MacMillian Publishing Company, New York.
|
|
|
|
|
Hillier FS, Lieberman GJ (2009). Introduction to Operations Research, 9th ed., McGraw-Hill Inc., New York.
|
|
|
|
|
McCarl BA, Meeraus A, van der Eijk P, Bussieck M, Dirkse SP, Nelissen F (2015). McCarl GAMS User Guide, Version 24.4,
View
|
|
|
|
|
UN Comtrade (2016). UN Comtrade, 2010-2014. United Nations Commodity Trade Database.
View
|
|