Spirulina platensis is a planktonic photosynthetic filamentous cyanobacterium that forms massive populations in tropical and subtropical water bodies that have high level of carbonate, bicarbonate and Ph values of up to 11. This cyanobacterium features morphological traits of the genus, that is, the arrangement of multicellular cylindrical trichomes in an open lift-hand helix along entire length of the filaments (Soni et al., 2012). The genus Spirulina has gained importance and international demand for its high phytonutrients value and pigments, which have applications in healthy foods, feeds, and therapeutics (Becker, 2007). It represents the second most important commercial microalgae (after Chlorella) for the production of biomass used as healthy food and animal feed (Sotiroudis et al., 2013). Its annual worldwide production in the year 2000 was estimated to be approximately 2000 tonnes (Spolaore et al., 2006). Spirulina has been used as food and nutritional supplements since antiquity (Falquet and Hurni, 2006). It is generally considered as a rich source of proteins, vitamins, essential amino acids, minerals, essential fatty acids such as linolenic acid and sulfolipids (Mendes et al., 2003). In addition to poly-unsaturated fatty acids, it also has 6 poly unsaturated fatty acids, phycocyanin and other phytochemicals (Chamorro et al., 2002). The present study reports the impact of different physical and chemical environment for mass production of Spirulina.
Microorganism
Cyanobacterium Spirulina used in the present study was purchased from Collection Centre of Marine Microalgae, Chinese Academy of Sciences, China. It was grown and maintained in 2 L sterilized Erlenmeyer flasks containing 1 L Zarrouk’s medium (Amala et al., 2013), chemical composition of which is shown in Table 1, at room temperature, pH 9 with continuous illumination using cool white fluorescent tubes whose light intensity was controlled and maintained at 2500 lx using the TES-1330A Digital Lux Meter (TES Electrical Electronic Corp, ISO 9001:2008). The experiment was done in triplicate. Agitation was done thrice a day manually. All the reagents used were of analytical grade and were obtained from Shoude Experimental Equipment Co., Ltd, Nanjing.
Culture media and growing conditions
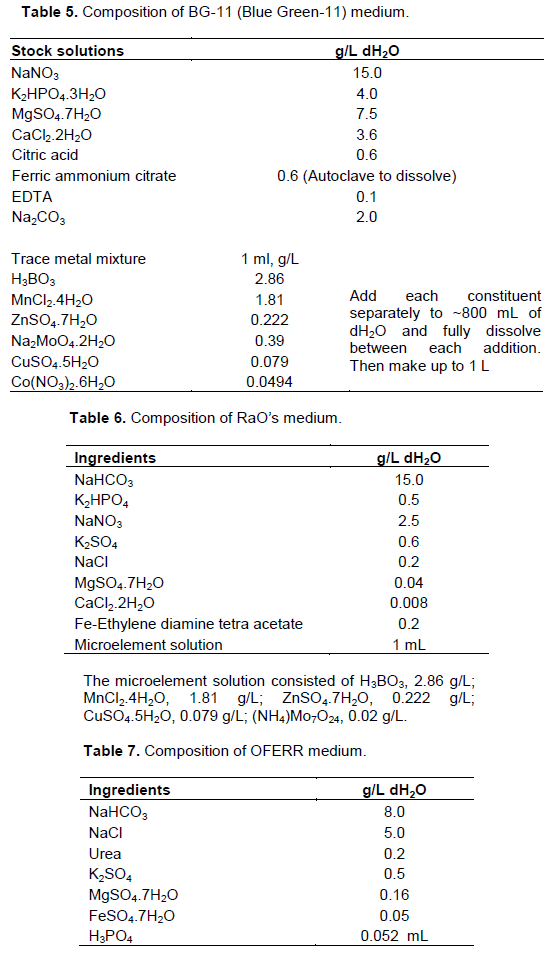
Zarrouk’s medium (Amala et al., 2013) was used as the standard control medium (SM) and its constituents are shown in Table 1. It was autoclaved (LDZX-75KBS Vertical Heating Pressure Steam Sterilizer (Shanghai Shenan Medical Instrument Factory) at 121°C for 15 min and incubation was done aseptically. ES medium (West and McBride Version) (West et al., 1999) was used as the growing medium in cultivation of Spirulina under different salinity levels and its constituents are shown in Table 2. The cyanobacterium Spirulina was grown under the following physical conditions: temperature 30 ±2°C, light intensity 4400 lx and light/dark cycle 14:10. Agitation was done thrice a day and the experiments were done in triplicate. To achieve growth under different chemical conditions, the Zarrouk’s medium was set at pH 7, 8, 9 (control), 10, 11 and 12; the MgO concentration was set at 0.0, 0.4, 0.8 (control), 1.2 and 1.6 mmol/L; for nitrogen source 2.5 g/L of NaNO3 (standard), urea and NH4Cl were used; for phosphorus source 0.5 g/L of K2HPO4 (standard), KH2PO4 and NaH2PO4 were used and for the carbon source 18 g/L of NaHCO3 (standard), Na2CO3 and K2CO3 were used; salinities of 1.0, 1.5, 2.0, 2.5, 3.0, 3.5% were used and finally CFTRI media, natural sea water, Bangladesh media No.3, BG-11, RaO’s, OFERR, and Zarrouk’s media (control) were used as the different growing media and their constituents are shown in Tables 3, 4, 5, 6, 7, and 1, respectively. All the sets of experiment were done in triplicate.

Cultivation
Spirulina was cultivated aseptically in the 250 mL sterilized Erlenmeyer flasks containing 150 mL of respective sterilized media. The temperature in the incubator was maintained at 30±2°C and illuminated with day-light fluorescent tubes with light intensity at 4400 lx under Light/dark cycle, 14:10. During the process of growth, the flasks were shaken manually 3 times per day. The experiments were run in triplicate.
Biomass yield
At 2-days intervals, 10 mL of homogenized algal suspension were filtered through a Whatman GB/T 1914 to 2007 filter paper that had been pre-combusted in an oven for 1 h at a constant temperature of 100°C and stored in a vacuum dessicator until use. The biomass yield (the dry weight (g/l)) was determined by the method described by Moheimani et al. (2013) as described above. The biomass yield of the samples under different salinity levels was then calculated through Optical density (OD) measurements using a spectrophotometer (SpectraMax M5 Microplate Reader, Molecular Devices, United States) and the growth rate (K′) was calculated using the equation below (Van Leeuwe et al., 1997):
K′ = ln (N2 / N1) / (t2 – t1) (1)
Where N1 and N2 are biomass at time 1 (t1) and time 2 (t2) respectively.
Biochemical analysis
Chlorophyll a content was estimated according to Oncel et al. (2006), Soni et al. (2012) and Ritchie (2006 and 2008). The algal biomass was harvested through centrifugation and mixed with pure methanol, heated in 70°C water bath for 3 min for chlorophyll a extraction and later centrifuged at 3500 r/min for 5 min. The absorbencies of chlorophyll a containing supernatant were measured at 665 and 750 nm according to Oncel et al. (2006) and Soni et al. (2012). The algal biomass was harvested through filtration and then washed with distilled water and then frozen at -20°C until use for chlorophyll a extraction according to Ritchie (2006 and 2008),. Then later the frozen filter paper was crushed in a motor and pestle to homogenize the filter and algae. 5 to 10 mL of 100% ethanol was then added to the sample and centrifuged at 5000 r/min for 10 min. The absorbencies of chlorophyll a containing supernatant were measured at 630, 647, 664, and 691 nm using 100% ethanol as the blank. The protein content was determined by the Bicinchominic Acid (BCA) Protein Assay (Smith et al., 1985) using bovine serum albumin as the standard. 5 mL of homogenized algal suspension was centrifuged at 3500 r/min for 5 min and later mixed with 1Χ Phosphate Buffer Saline (PBS) (pH 7.4). The sample was then sonicatend in an Ultra Sonic Crasher Noise Isolating Chamber (Ningbo Scientz Biotechnology Co. Ltd.). The absorbencies of protein containing supernatant were measured at 562 nm using bovine serum albumin as a blank. For estimation, the following equations were used and expressed in mg/L per dry weight:
Chl a (mg/L) = 13.9 (A665–A750) (2)
Chl a (µg/mL) = 0.0604 E630 – 4.5224 E647 + 13.2969 E664 – 1.7453 E691 (3)
Protein content (µg/mL) = OD1/ OD2 × 563× dilution ratio (4)
Where OD1 is the unknown sample, and OD2 is the standard sample.
Statistical analysis
The data obtained from the experiment were subjected to the paired sample statistics (t-Test) using SPSS Software; version 14.0, 2007. The significance of the result was set at 5% level and compared based on the mean values by least significant difference.
Effect of different pH levels on biomass production of Spirulina
pH is one of the main factors influencing the abundance of inorganic carbon, dissolved total carbon (DTC). When the pH is below 5, the majority of dissolved inorganic carbon (DIC) is CO2, which is equal to HCO3- at pH 6.6 but at pH 8.3 almost all DIC is HCO3- (Ogbonda et al., 2007). Therefore, the pH should be controlled during cultivation to enhance the absorbability and utilization of CO2 by microalgae. The pH can also directly affect the permeability of the cell and the hydronium forms of the inorganic salt, and indirectly influence the absorption of the inorganic salt. CO2 in the culture is consumed by the microalgae during photosynthesis, thereby increasing the pH of the medium. Therefore, substances like hydrochloric acid and acetic acid have to be added to control the pH to stop it from increasing beyond the tolerance of the microalgae. Compared with hydrochloric acid, acetic acid has the advantage of not only adjusting the pH value but also acting as a carbon source to enhance the growth rate of microalgae (Junying et al., 2013). Culturing Spirulina in conical flask has its limitation in providing complete information related to growth, development and production of value added chemicals namely vitamins, amino acids, fatty acids, protein and polysaccharides both in quantity and quality and disposing of carbon (II) oxide which is one of the major causes of global warming (Bergman et al., 2013). Extensive research has been conducted on production of Spirulina at salt lakes in the tropical regions (Sassano et al., 2004). Physico-chemical profile of Spirulina involves describing the relationship between growth and the environmental factors especially irradiance flux, density and temperature (Sotiroudis et al., 2013), which are important in the evolution of micro algae and cyanobacteria for biomass production, as well as their general characterization. High alkalinity is mandatory for the growth of Spirulina and bicarbonate is used to maintain the high pH (Pandey et al., 2010; Jones et al., 1998). Sources of nutrition also affect the growth rate of cyanobacteria (Costa et al., 2001). The pH value of the culture medium combined with the dry cell weight may be an indirect method for determining the degree of cell growth of Spirulina. This is because the pH gradually rises as bicarbonate added to the culture medium is dissolved to produce CO2, which releases OH- during the cultivation of Spirulina (Moberg et al., 2012). The organism was adapted to six pH regimes (7, 8, 9, 10, 11 and 12) in flask culture, monitored and yield expressed in term of dry weight. The maximum bulk density of about 7.83±0.29 g/L was observed when the pH of the culture medium was maintained at 9.0 with medium volume 150 mL in a 250 mL flask as illustrated in Figure 1. The maximum bulk density was attained on the 25th day after the inoculation of culture in Zarrouk’s medium.

The increase in the yield of Spirulina could have been due to the availability of mire space, oxygen, and light to the
culture flask and also due to the different solubility of CO2 and other mineral compounds affected by the different pH levels. Earlier results also demonstrated that optimum pH for maximum growth of Spirulina was 9 to 9.5 ranges (Pandey et al., 2010). Spirulina is considered an alkalophilic organism by nature (Jones et al., 1998). The chlorophyll a content and protein content were maximum at pH 9 (Figure 1). Chlorophyll a content was 1.34±0.12 mg/mL while the protein content was 18.64±0.06 µg/mL. Similar results have also been reported by various cyanobacteria researchers (Carvalho et al., 2002; Pandey et al., 2010).
Effect on different concentrations of Mg2+ ions to Spirulina biomass production
Magnesium oxide is known to hydrolyze in water to generate hydroxide (Shand, 2006) and thus resulting to increase in the pH level. In the present study, concentrations of 0.0, 0.4, 0.8 (control), 1.2 and 1.6 mmol/L of nano-MgO were added into the growing medium.0.8 mmol/L was set as the control measure since it is the amount in the Zarrouk’s media (Amala et al., 2013). According to a study by Liu et al. (2012), nano-MgO is known to inhibit BOD and its toxicity results primarily from the increase in pH level following MgO hydrolysis thus the decrease in biomass yield in higher concentrations. In terms of biomass yield, highest biomass was obtained at 0.8 mmol/L (control) (3.48±0.24 g/L) and lowest at 1.6 mmol/L (2.02±0.18 g/L) respectively as illustrated in Figure 2. The low biomass yield at the highest concentration could be attributed to substrate toxicity. Wakte et al. (2011), studying metal ions toxicity on Spirulina, demonstrated a similar phenomenon.
Effect of different nitrogen, phosphorus, and carbon sources to biomass production of Spirulina
Many elements have to be provided for the growth of Spirulina, such as carbon (C), oxygen (O), hydrogen (H), nitrogen (N), potassium (K), calcium (Ca), magnesium (Mg), iron (Fe), sulfur (S), phosphorus (P) and trace elements with the major nutrients being carbon, oxygen, hydrogen, nitrogen, phosphorus, and potassium. The first three are obtained from water and air while the latter three have to be absorbed from the culture medium (Xin et al., 2010). Nitrogen is one of the essential elements for the growth, development, reproduction, and other physiological activities of Spirulina. The nitrogen source and concentration also affect the accumulation of lipid in Spirulina. Usually, ammonium salts, nitrates, and urea are used as nitrogen sources, but their absorption rates and utilization are different (Xin et al., 2010). This is because ammonia is directly used to synthesize amino acid while the other nitrogen sources have to be converted to ammonia to synthesize amino acid (Junying et al., 2013). It also has been found that microalgae grow well with urea and nitrate. In the present study, sources of nitrogen used included; NaNO3 (it is used as the standard source of nitrogen), urea and NH4CL of the same osmolatity (0.03 mol/L). Highest biomass recordings were observed in NaNO3 nitrogen source (2.24±0.13 g/L) as illustrated in Table 8 while Chl a protein contents were 2.53±0.24 and 3.24±0.30 mg/mL respectively (Table 8).

However, in urea and NH4CL, there were no detections of biomass increase as a result of a high concentration of NH4+ which is not suitable for growth as respiration of Spirulina is adversely affected by too high concentration of NH4+ ions (Chen et al., 2011). Thus, NaNO3 is a better recommendation for nitrogen source.
Phosphorus is another essential element for the cultivation of Spirulina. Phosphate, hydrogen phosphate, and other phosphates, play an important role in the metabolic processes of microalgae, as well as the succession of phytoplankton in aquatic ecosystems. Phosphorus takes part in many metabolic processes, such as signal transduction, energy conversion and photosynthesis (Navarro et al., 2008). The metabolic mechanisms of P in the different forms are different in microalgae. Orthophosphate is most easily absorbed and significantly promotes the growth of microalgae (Navarro et al., 2008). According to the current work, sources of P used were K2HPO4 (it is used as the standard source of nitrogen), KH2PO4 and NaH2PO4 of the same osmolatity (0.003 mol/L). Optimal biomass yields were observed in K2HPO4 (2.08±0.17 g/L) as shown in Table 8. Chl a content (2.52±0.21 µg/mL) and protein content (2.93±0.06 mg/mL) are illustrated in Table 8. The lowest biomass concentration was observed when K2HPO4 was replaced by NaH2PO4 (0.80±0.07 g/L) as illustrated in Table 8 and this is due to the changing of the N:P ratio, as too high concentrations inhibited cell division of Spirulina thus the low biomass attained (Chu et al., 2013). Microalgae are phototrophic microorganisms, and they include prokaryotic photosynthetic bacteria, called cyanobacteria (Borges et al., 2013). These microorganisms have been investigated for their potential to enrich foods. The main nutrient required for Spirulina cultivation is carbon, because the cells contain about 50% (w/w) of this element. Thus, the carbon source is the most expensive component of Spirulina production. For autotrophic growth (which is more suitable for large-scale open cultivation), carbon can be provided as CO2, carbonate or bicarbonate. If bicarbonate is used, it represents 60% of the cost of nutrients (Alava et al., 1997), which is one of the reasons for studying the effects of different carbon source and their concentrations and finding alternative sources of this nutrient, such as molasses (Andrade et al., 2008), residual CO2 (Ferreira et al., 2012) and synthetic CO2 (Rosa et al., 2011). The concentration of dissolved inorganic carbon in anaerobic effluent is lower than the amount indicated in the formulation of standard culture media for production of Spirulina biomass, such as Zarrouk medium (Amala et al., 2013). In the current work, sources of C used were NaHCO3 (it is used as the standard source of nitrogen), Na2CO3 and K2CO3 of the same osmolatity (0.21 mol/L). Maximum yield was observed with NaHCO3 carbon source (1.18±0.92 g/L) as shown in Table 8. Chl a and protein contents were 1.15±0.11 µg/mL and 2.97±0.10 mg/mL respectively while the lowest biomass concentration was observed when NaHCO3 was replaced by K2CO3 (0.75±0.52 g/L) due to less CO32- in the medium which are responsible for low alkalinity of the growing medium (Table 8).
Effect of different salinities in biomass production of Spirulina
Salinity is the presence of high levels of soluble salts in soils or waters. Management of salinity is important, as elevated salt levels can have detrimental effects on production and the environment (Rafiqul et al., 2003). Spirulina can readily adapt to the environment, and it can inhabit lake, creek, reservoir, or oceans, which have appropriate alkalinity, especially the southern ocean enjoying tropical climate. Additionally, seawater Spirulina performs better than freshwater Spirulina because of its excellent nutrition content.
In the present study artificial seawater medium, ES medium (West and Mcbride Version) (West et al., 1999), was used as the growing medium and its constituents are shown in Table 9. Its salinity levels were 1.0, 1.5, 2.0, 2.5(control), 3.0 and 3.5% as shown in Table 9. To reduce the cost of production of Spirulina, many methods have been attempted. The best method to date involved the use of nutrient-enriched seawater culture medium like the one used in this current study (Rafiqul et al., 2003). In the early stages of growth, there was an increase in biomass to 1.44±0.06 g/L (Table 9) and the specific growth rate (K′) of Spirulina (0.22±0.01 µm/d (Table 10) respectively in the 12th day at 2.5% salinity. As the salinity increased beyond 2.5%, biomass and growth rate decreased though the range of salinity was not high enough to inhibit growth. The decrease in growth with increasing salinity has frequently been reported in the literature of Rosales et al. (2005); Shimamatsu (2004), Zeng et al. (1998) and (Kebede (1997). It is accompanied by a decrease in photosynthetic efficiency, phycobilin/Chl a ratio and PSII activity and an increase in carbohydrate metabolism (Shimamatsu, 2004; Warr et al., 1985). In the present study, chlorophyll a content was stimulated at lower salinities with the highest content being observed at 2.5% (1.86±0.13 mg/L) followed by significant decrease at high salinity levels (Table 9). This could be as a result of enhanced respiration that indicates that the response to salinity stress is an energy consuming process (Zeng and Vonshak, 1998), but the mechanisms involved have not yet been elucidated. It is probable that salinity stress affects light utilization and metabolism (particularly carbohydrates involved in osmoregulation) to counteract ionic and osmotic stresses (Kebede, 1997; Rosales et al., 2005). Protein content was also influenced by the salinity of the medium (Table 9). There was a drastic decrease in protein content with increase in salinity levels. However, protein content results in this study are somewhat contradictory to those reported earlier by some researchers. Most researchers have found similar results (Shimamatsu, 2004; Zeng et al., 1998) whereas some found an augmentation of protein contents with salinity increase (Rosales et al., 2005). However, strains and culture conditions were very different for all these studies so the results are difficult to compare. In this work, it could be suggested that stressed cells had a lower protein synthesis (at 3.5%; 85.68±3.50 µg/mL) capacity linked to the higher carbohydrate metabolism (Kebede,1997; Rosales et al., 2005). As protein content is a very important parameter for nutritional uses of Spirulina, the values have to be compared to the range of protein in Spirulina products found on the market, which is 50 to 65%. The maximal value near 50%, obtained for 1.0% is satisfactory for food applications.

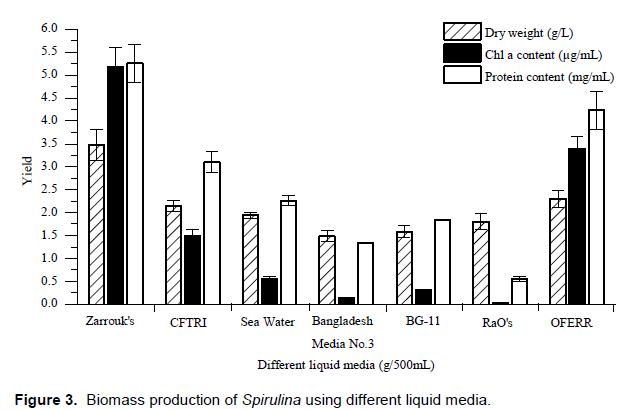
Biomass cultivation of Spirulina using different liquid media
Large-scale production of Cyanobacterial biomass is essentially a complex process involving a large number of variables and for their successful growth; the environment needs to be conditioned to meet as many of the essential requirements of the organism. Among the several constraints to the multiplication of cyanobacteria physical, physiological and economic limitations are of major importance. In tropical countries, especially developing countries such as India, emphasis is placed more on the production costs (Larsdotter, 2006; Raoof et al., 2006). Culture of Spirulina in conical flask has its limitation in providing complete information related to growth, development and production of value added chemicals namely vitamins, amino acids, fatty acids, protein and polysaccharides both in quantity and quality and disposing of carbon dioxide one of the major causes of global warming (Bergman et al., 2013; Ferreira et al., 2004). Extensive research has been conducted on production of Spirulina living at salt lakes in the tropical regions (Sassano et al., 2004). In addition, sources of nutrition also affect the growth rate of Spirulina (Sotiroudis et al., 2013; Pandey et al., 2010). In the present study we investigated comparative growth rate of Spirulina on CFTRI medium (Pandey et al., 2010), Natural seawater, Bangladesh Media No.3 (Bharat et al., 2011), BG-11 medium (Ruiz et al., 2004), RaO’s medium (Devanathan et al., 2013), OFERR medium (Devanathan et al., 2013) and Zarrouk’s medium (Amala et al., 2013) as the control. The growth of Spirulina in flask culture was then monitored and expressed in terms of dry weight. Figure 3 shows that the specific dry weight of Spirulina was 3.48±0.34 g/L on Zarrouk’s medium, 1.80±0.17 g/L on RaO’s medium, 2.15±0.12 g/L on CFTRI medium, 2.30±0.18 g/L on OFERR medium, 1.49±0.12 g/L on Bangladesh medium No. 3, 1.94±0.06 g/L on natural sea water and 1.59±0.14 g/L on BG-11 medium respectively. The data shows that specific growth of Spirulina is higher on Zarrouk’s medium. The chlorophyll a content of Spirulina was 5.18±0.43 µg/mL on Zarrouk’s medium, 0.04±0.00 µg/mL on RaO’s medium, 1.50±0.14 µg/mL on CFTRI medium, 3.39±0.27 µg/mL on OFERR medium, 0.13±0.01 µg/mL on Bangladesh medium No. 3, 0.56±0.05 µg/mL on natural sea water and 0.31±0.02 µg/mL on BG-11 medium respectively. The protein content of Spirulina was 5.26±0.41 mg/mL on Zarrouk medium, 0.55±0.05 mg/mL on RaO’s medium, 3.10±0.23 mg/mL on CFTRI medium, 4.23±0.42 mg/mL on OFERR medium, 1.33±0.01 mg/mL on Bangladesh medium No. 3, 2.26±0.11 mg/mL on natural sea water and 1.84±0.02 mg/mL on BG-11 medium respectively (Figure 3). Similar studies were conducted by Hall et al. (2004), Bharat et al. (2011) and Bharat et al. (2011).