Full Length Research Paper

ABSTRACT
INTRODUCTION
For the reason of obesity and insulin resistance in non-alcoholic fatty liver disease (NAFLD), the prevalence of hepatic steatosis is increasing rapidly in the world (Angulo, 2002; Williams, 2006). Simple nonalcoholic steatosis can progress to more serious liver disease (nonalcoholic steatohepatitis and cirrhosis), representing a threat to public health.
Diagnosis and quantification of hepatic steatosis is important. In NAFLD, steatosis is the hepatic mani-festation of the metabolic syndrome and the earliest biomarker for the development of liver fibrosis in the more severe condition of non-alcoholic steatohepatitis (NASH). Early diagnosis and treatment of NASH can prevent the potential development of cirrhosis and hepatocellular carcinoma (HCC) (Adams et al., 2005; Farrell and Larter, 2006; Rector et al., 2008). In hepatitis C, steatosis is associated with more severe fibrosis and rapid disease progression (Adinolfi et al., 2001; Rubbia-Brandt et al., 2004). Liver biopsy remains the gold standard for providing the evaluation of hepatic steatosis, despite well-established drawbacks regarding its invasiveness and sampling error due to small sample size and inter-observer variability (Bravo et al., 2001). But this invasive procedure is not without risk. There is a small mortality rate but a high error rate, predominantly owing to under sampling, whereby typically less than 1/50,000 of the liver volume is obtained for histologic evaluation. Histological assessment of a needle biopsy specimen is potentially inaccurate since heterogenic manifestation of hepatic steatosis can lead to underscoring of the degree of steatosis or to false-positive results (Ratziu et al., 2005). These factors highlight the need for a noninvasive test to characterize diffuse liver disease. For ethical reasons and because most patients are unwilling to undergo repeated procedures, treatment algorithms rarely mandate or require serial liver biopsies.
Noninvasive modalities such as ultrasound (US), computed tomography (CT), and magnetic resonance imaging (MRI) have been employed for the assessment of hepatic steatosis (Saadeh et al., 2002; Mehta et al., 2008; Cho et al., 2008). However, these modalities do not specifically measure hepatic fat content, are semi-quantitative, and lack high sensitivity and specificity (Cho et al., 2008). Many studies have focused on the role of imaging techniques as a non-invasive alternative to liver biopsy for detecting and quantifying hepatic steatosis (Charatcharoenwitthaya and Lindor, 2007; Hamer et al., 2006, Joseph and Saverymuttu, 1991; Szczepaniak et al., 2005). The reported sensitivities and specificities between different imaging techniques and between different studies investigating the same technique vary substantially.
1H MRS is widely used to measure intramyocellular and intrahepatocellular lipid content in vivo (Szczepaniak et al., 1999). 1H-MRS measures the resonance signals derived from protons in triglycerides, which can be quantified and used as a noninvasive measure for the degree of steatosis. The lipids observed in 1H MRS arise mainly from triglycerides (TGs) in lipid droplets (Opstad et al., 2008) as these are NMR visible, whereas lipids bound to membranes and proteins are too rigid to generate a 1H MRS-observable signal. This property of 1H MRS to detect mobile lipids in lipid droplets has made it the standard method for the quantification of liver fat content (LFAT) (Szczepaniak et al., 2005). The purpose of this essay was to assess the value of 1H MRS in diagnosis of hepatic steatosis in non-alcoholic fatty liver disease.
MATERIALS AND METHODS
Patients
From January 2010 to June 2010, after institutional and ethics board review and approval and after providing informed consent,120 patients with chronic hepatitis C were enrolled. The diagnosis of decompensated HCV-induced cirrhosis was based on the American Association for the Study of Liver Diseases Clinical Guideline for Hepatitis C (2004).
All enrolled patients were also naive to any anti-viral treatments. Other inclusion criteria were (1) HCV RNA >500 copies/mL; (2) absence of complications such as gastrointestinal bleeding, hepatic encephalopathy and primary liver cancer; and (3) liver function defined as Child-Pugh grade A or B based on serum bilirubin, serum albumin, presence of ascites, presence of hepatic ence-phalopathy and prothrombin time. Patients with hypersplenism were also enrolled. Exclusion criteria included: (1) infection with hepatitis A, B, D or F virus, Epstein-Barr virus, cytomegalovirus or human immunodeficiency virus; and (2) presence of alcoholic or drug-induced liver diseases, Child Cor severe heart, brain or kidney disease.
A total of 120 patients that meet the inclusion criteria were enrolled. Patients were considered as part of the treatment group (n = 90) or control group (n = 30) based upon whether they opted to receive anti-viral therapy. The study was approved by the Institutional Review Board of the hospital, and informed consent was obtained from all study participants.
Clinical evaluation
Determination of therapeutic efficacy
The primary endpoints were (1) SVR, defined as HCV RNA undetectable or < 500 copies/mL for at least 24 weeks after treatment discontinuation (Pearlman, 2012); (2) relapse, defined as HCV RNA undetectable or < 500 copies/mL during antiviral therapy, but becomes detectable at 24 weeks after treatment discontinuation. The secondary endpoint was assessment of disease progression, (defined as an increase of 2 or more in the Child-Pugh score), presence of primary hepatocellular carcinoma, renal dysfunction, spontaneous bacterial peritonitis, variceal bleeding or death due to liver disease (Liaw et al., 2004)
Measures
Patients in the treatment group were evaluated for serum HCV antibodies, liver function, HCV RNA, coagulation function, thyroid function, and alphafetoprotein as well as liver computed tomography. Routine blood and urine tests were performed before the start of the study. Routine blood and liver function tests were performed weekly in the first month, then once every 4 weeks during the study period and once every 8 weeks for 24 weeks after discontinuation of treatment. Quantitative detection of HCV RNA was done immediately prior to treatment (baseline), at 24 and 48 weeks after treatment, and 6 months after discontinuation of treatment. HCV RNA levels were quantitated by real-time polymerase chain reaction (PCR) using a kit from the Roche company.
Patients in the control group were evaluated for liver function and HCV RNA levels. Routine blood tests and color ultrasonography of the liver were done once every 12 weeks. All patients were assessed for disease progression.
Treatment regimen and follow-up
All participants received symptomatic and supportive treatment, including treatment for reducing levels of transaminase and bilirubin and supplemental albumin. For patients in the treatment group, those who had a neutrophil count of ≥ 1.0 × 10⁹/L, platelet count of ≥ 50 × 109/L and hemoglobin of > 10 g/L were treated additionally with both Peg-IFNα-2a and RBV. The initial dose of Peg-IFNα-2a was 180 μg/kg subcutaneously. Peg-IFNα-2a dosage was reduced to 90 μg/kg once weekly when neutrophil or platelet counts decreased to ≤ 0.75 × 10⁹/L or < 50 × 109/L, respectively. The dose was returned to 180 μg/kg if neutrophil and platelet counts increased to > 0.75 × 10⁹/L and ≥ 50 × 109/L, respectively, after two weeks. Treatment was discontinued if neutrophil count was ≤ 0.5 × 10⁹/L or platelet count was < 30 × 109/L. Patients tolerating the standard Peg-IFNα-2a dose of 180 μg/kg weekly were treated for 48 weeks. Patients who could not tolerate the standard dose were treated with the reduced dose of 90 μg/kg once weekly for up to 72 weeks.
Patients with hemoglobin of > 100 g/L were initially treated with standard dose of RBV (genotype 1: 1200 mg/d for patients with body weight >75 kg and 1000 mg/d for patients with body weight ≤ 75 kg; non-genotype 1: 1000 mg/d for patients with body weight > 75 kg and 800 mg/d for patients with body weight ≤ 75kg). RBV dosage was reduced when hemoglobin levels decreased to ≤ 100 g/L after the dosage increase. RBV treatment was discontinued when hemoglobin levels were ≤ 80 g/L. Patients tolerating the standard dose of RBV were treated for 48 weeks. Patients developing cytopenia during the treatment period were treated with cell growth-stimulating factor and/or erythropoietin. All patients were followed up for 3 years.
MR imaging and 1H-MR spectroscopy
MR measurement was performed on a clinical Philips Achieva 3.0 T TX scanner (Philips Healthcare, Best, The Netherlands). The Sense Torso coil was positioned on the abdomen and scout image were acquired to localize the liver and surrounding structures.T1-, T2- weighted, were performed in all patients and controls . TR/TE 2000/40 ms, FOV =35mm*35mm*35mm, 96 averages, 3.4mm, PA w/s exc angle 250.
1H-MR spectrum was acquired with and without water suppression. Localized single voxel point resolved spectroscopy (PRESS) BH with TR/TE=3,000 ms/35 ms and number of averages =64 were taken. A voxel of 2×2× 2 cm3 was located mainly in right parietal region of the liver in all the subjects. First a layer selection gradient plus 90. Radio frequency pulse (RF), while followed by two layer selection gradient plus 180. RF reunion pulse. Three orthogonal vertical, reach the three-dimensional spatial orientation, the spin echo signal. Data acquisition during the breath hold to ensure that the constant of the scanning area of interest and reduce the impact of cardiac pulsatility. Liver tissue contains more water and fat, and the strongest signal of 1H-MRS detected are water and fat.
Analysis of 1H-MR spectroscopy
All the data was calibrated and calculated with spectroview of extended MR workspace 2.6.3.2? The peak value of lipid, peak value of water, area under the peak of lipid and lipid/water ratios of all patients were analyzed and the results of different groups were compared.
Statistical analysis
Age and baseline HCV RNA level were normally distributed and presented as mean and standard deviation. Differences in age and baseline HCV RNA levels between the two groups were tested with the independent two samples t-test. Child-Pugh scores were non-normally distributed and presented as median and inter-quartile range (IQR). Differences in Child-Pugh scores between the two groups were tested with the non-parametric Mann-Whitney test. Other categorical variables were presented as number and percentage, and the associations with categorical variables versus treatment group were tested with the Fisher’s exact test. Statistically significant variables from the univariate analyses were used in the multivariate analysis. All statistical tests were two sided, and a p-value of less than 0.05 was considered statistically significant. All statistical analyses were performed using the SPSS 19.0 software (SPSS Inc, Chicago, IL).
RESULTS
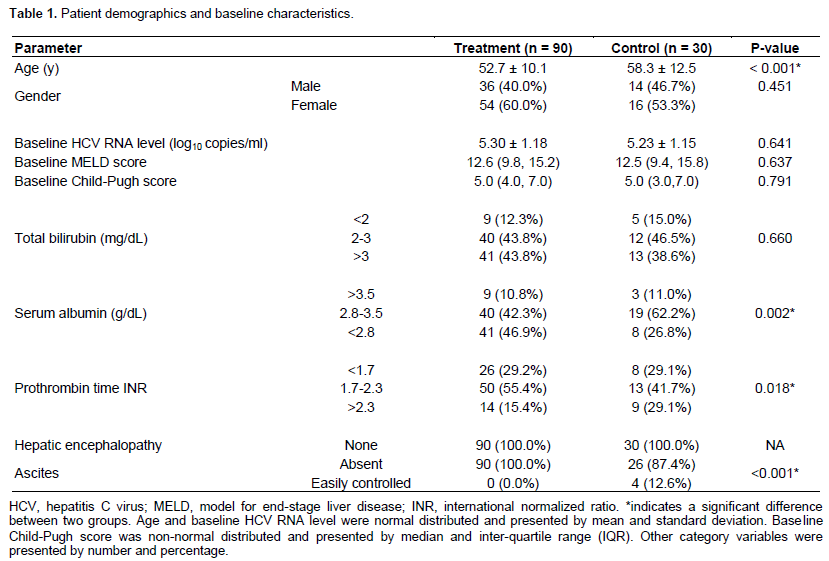
Patient demographics and baseline characteristics
As shown in Table 1, 120 patients, who met the inclusion criteria, were enrolled. Among them, 90 patients had sufficient blood cell counts for anti-viral therapy. The remaining 30 patients, who refused anti-viral therapy, were placed in the control group. Patients in the treat-ment group were significantly younger than those in control group (mean age 52.7 vs. 58.3 years, p < 0.001). There were also no significant differences between the two groups in baseline HCV RNA levels. In addition, baseline MELD scores were not significantly different between treatment and control groups (Table 1). Although baseline Child-Pugh scores, total bilirubin, and hepatic encephalopathy were not different between the two groups, significant differences in serum albumin, international normalized ratio (INR) for prothrombin time, and ascites were observed between the treatment and control groups (p = 0.002, p = 0.018, and p < 0.001, respectively).
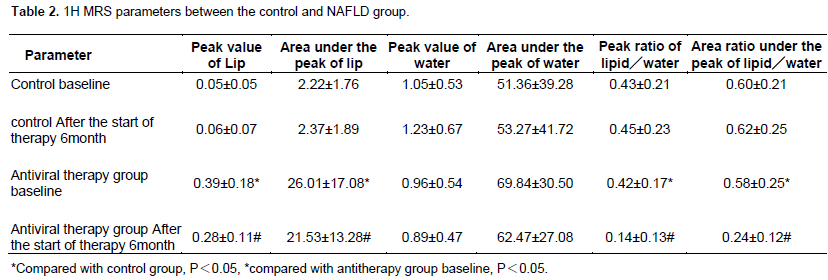
Comparison of the 1H MRS between before and after antiviral therapy
Peak value of lipid, area under the peak of lipid, peak ratio of lipid/water and area ratio under the peak of lipid/water had statistical difference between baseline of control group and antiviral group: peak value of lipid: (0.39±0.18) vs (0.05±0.05); area under the peak of lipid: (26.01±17.08) vs (2.22±1.76); peak ratio of lipid/water: (0.42±0.17) vs (0.43±0.21); area ratio under the peak of lipid/water (0.58±0.25) vs (0.60±0.21), P<0.05. Peak value of lipid, area under the peak of lipid, peak ratio of lipid/water and area ratio under the peak of lipid/water also had statistical difference between baseline and after the start of therapy 6 months of antiviral therapy group: peak value of lipid: (0.28±0.11) VS(0.39±0.18); area under the peak of lipid: (21.53±13.28) vs (26.01±17.08); peak ratio of lipid/water: (0.14±0.13) vs (0.42±0.17); area ratio under the peak of lipid/water (0.24±0.12)VS(0.58±0.25)?P<0.05. (Table 2).
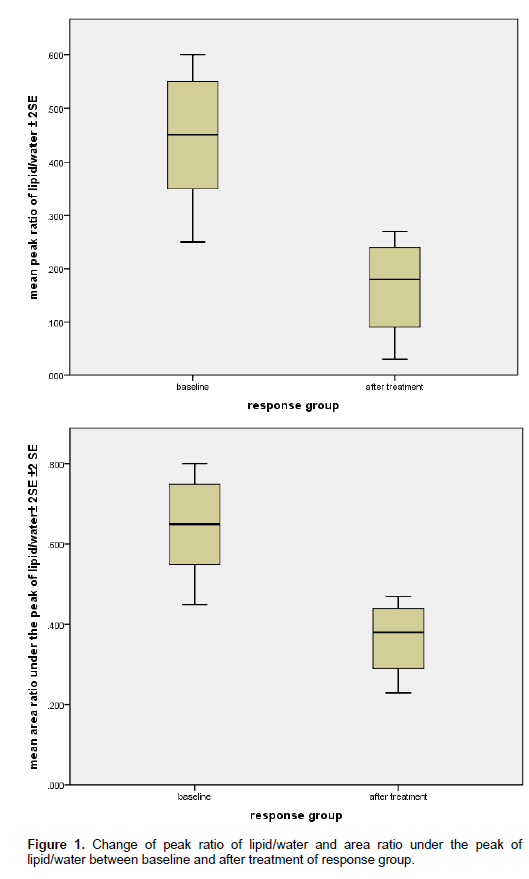
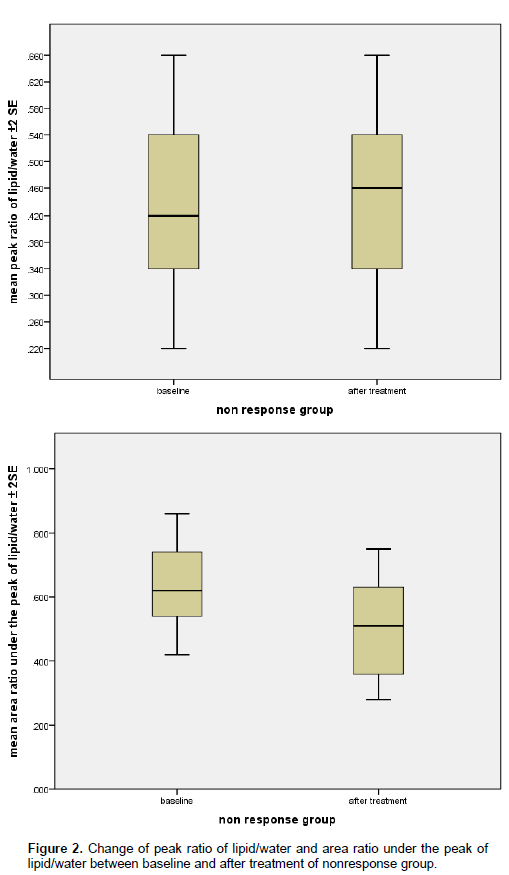
Change of peak ratio of lipid/water and area ratio under the peak of lipid/water between baseline and after treatment of response group and non-response group
69 patients responded to antiviral treatment with a sustained viral response. In 54 of these patients, peak ratio of lipid/water and area ratio under the peak of lipid/water had decreased on 6 months follow-up MR spectroscopy; P<0.05. Figure 1 is the graph of a responder whose spectra changed after treatment, showing a decrease in peak (Figure 2) ratio of lipid/water and area ratio under the peak of lipid/water. 15 of the 21 virologic non-responders had peak ratio of lipid/water and area ratio under the peak of lipid/water on follow-up imaging similar to the baseline values.
DISCUSSION
It is estimated that approximately 3% of the global population has chronic infection with the hepatitis C virus (HCV) and that approximately 4 million persons are newly infected each year (Hoofnagle, 2002). In 55 to 85% of patients with infection develops into chronic liver disease, which in many cases remains asymptomatic. In approxi-mately 20% of cases, fibrosis develops into cirrhosis, which leads to hepatocellular cancer in 5% of cases each year (Brook et al., 2010). Liver biopsy is the reference standard for staging and grading chronic liver disease,
but this invasive procedure is not without risk. There is a small mortality rate but a high error rate, predominantly owing to under sampling, whereby typically less than 1/50,000 of the liver volume is obtained for histologic evaluation (Ishak et al., 1995; Regev et al., 2002). As a result of the problems associated with biopsy, a steady drive to find an effective noninvasive method of eva-luating liver damage has led to developments both in testing with serologic biomarkers of disease and in imaging. For ethical reasons and because most patients are unwilling to undergo repeated procedures, treatment algorithms in the United Kingdom rarely allow serial liver biopsy. The impetus to find a reliable and repeatable biomarker of disease activity and response to treatment thus has renewed focus (Cobbold et al., 2006).
Magnetic resonance spectroscopy is a valuable tool for the non-invasive assessment of metabolic processes in vivo. Because of the presence of certain compounds form in the organization of the nucleus proton, these com-pounds or metabolites would produce a certain chemical shift in certain chemical environment. Small changes in the magnetic resonance peak caused by these changes could be collected by magnetic resonance scanner and converted to numerical spectrum. Neuronal markers, membrane constituents, osmolytes and the energy status can be measured for the diagnosis of various diseases and therapeutic monitoring in humans (Ross and Bluml, 2001). 1H magnetic resonance spectroscopy generates a spectrum of the various resonances of protons that are embedded in different chemical bonds. Because the protons are surrounded by various nuclei and electrons with their own magnetic properties, small magnetic field pertubations occur in a systematic manner, leading to slight differences in the received frequencies of protons in different chemical bonds. Thus, the chemical shift values occur essentially as a consequence of the variable electronegativity of adjacent chemical moieities in the molecule. The chemical shift scale describes the position of resonances in the spectrum in parts per million (p.p.m.), irrespective of the field strength, relative to a reference set at 0 p.p.m. The underlying frequency shift, however, measured in Hertz (Hz), is directly proportional to the strength of the magnetic field, for example 1 p.p.m. of the proton spectrum at 1.5 T refers to 64 Hz and at 3.0 T to 128 Hz. Therefore, with higher magnetic fields the resonances are better separated. The frequency separation of the resonances or peaks describes the resolution of the spectrum.
The clinical use of localized 1H magnetic resonance spectroscopy (1H MRS) in vivo first in the brain and then in the prostate has been well established and refined over the last two decades (Ross and Bluml, 2001; Michaelis et al., 1993; Cunningham et al., 2005; Hom et al., 2006). Single volume spectroscopy with stimulated echo acquisition mode or the point-resolved spectroscopy sequence (PRESS) technique is recommended, because of longer acquisition times and reduced SNR for multi-voxel liver MRS with chemical shift imaging (Fischbach and Bruhn, 2008).
The ratio of the fat peak (1.3 ppm) to the water peak (4.7 ppm) is a common definition of hepatic fat percen-tage by 1H-MRS (Thomas et al., 2005). Using this defi-nition, Thomas et al. (2005) reported on the relationship between body adiposity and steatosis in 11 NASH patients and measured hepatic fat percentages of up to 75%. But clinical study by Longo et al. (1995), a proposal for the ([AUC total fat peaks/ AUC total peaks]) method for calculating hepatic fat content from 1H-MR spectra was advocated. The same method was applied in a large study by Szczepaniak et al. (1999), evaluating the
prevalence of hepatic steatosis in over 2300 participants of the Dallas Heart Study population.
In this study, Philips Achieva 3.0 T TX scanner and 1H torso toil were used to get the signal. Localized single voxel point resolved spectroscopy (PRESS) BH was used. In this study, data was analysed by Philips Achieva 3.0T spectroview of extended MR workspace 2.6.3.2, quantitative spectral analysis chemical shifts, the calcu-lation Product of metabolite peak and the area below peak and so on. Peak value of lipid, area under the peak of lipid, peak ratio of lipid/water and area ratio under the peak of lipid/water had statistical difference between baseline of control group and antiviral group, and also between baseline and after the start of therapy 6 month of antiviral therapy group. It suggested that liver steatosis of chronic HCV steatosis was modified significantly by antiviral therapy, which is the same result of study of K. R. Reddy [Reddy, 2008 #3469].
In short, 3. 0T 1 H-MRS may be an effective technology in assessing of lipid metabolism in chronic HCV. Use of MRS technology is based on triglycerides (TG) methylene chemical shift difference between TG accumulations in fine Cell sources for fatty liver quantitative determination of a new idea. However, the study samples are relatively small, pending further in-depth exploration.
CONFLICT OF INTERESTS
The author(s) have not declared any conflict of interests.
ACKNOWLEDGEMENTS
This study was supported by the National Natural Science Foundation of China (Grant no: 30970415).
REFERENCES
|
Adams LA, Lymp JF, St Sauver J, Sanderson SO, Lindor KD, Feldstein A, Angulo P (2005). The natural history of nonalcoholic fatty liver disease: a population-based cohort study. Gastroenterology 129(1): 113-121. Crossref |
||||
|
Adinolfi LE, Gambardella M, Andreana A, Tripodi MF, Utili R, Ruggiero G (2001). Steatosis accelerates the progression of liver damage of chronic hepatitis C patients and correlates with specific HCV genotype and visceral obesity. Hepatology 33(6):1358-64. Crossref |
||||
|
Angulo P (2002). Nonalcoholic fatty liver disease. N. Engl. J. Med. 346(16):1221-31. Crossref |
||||
|
Bravo AA, Sheth SG, Chopra S (2001). Liver biopsy. N. Engl. J Med. 344(7):495-500. Crossref |
||||
|
Brook G, Soriano V, Bergin C (2010).European guideline for the management of hepatitis B and C virus infections. Int. J. STD AIDS 21(10):669-78. Crossref |
||||
|
Charatcharoenwitthaya P, Lindor KD (2007). Role of radiologic modalities in the management of non-alcoholic steatohepatitis. Clin. Liver Dis. 11(1):37-54, viii. Crossref |
||||
|
Cho, CS, Curran S, Schwartz LH, Kooby DA, Klimstra DS, Shia J, Munoz A, Fong Y, Jarnagin WR, DeMatteo RP, Blumgart LH, D'Angelica MI (2008). Preoperative radiographic assessment of hepatic steatosis with histologic correlation. J. Am. Coll. Surg. 206(3): 480-8. Crossref |
||||
|
Cobbold J, Lim A, Wylezinska M, Cunningham C, Crossey M, Thomas H, Patel N, Cox J, Taylor-Robinson S (2006). Magnetic resonance and ultrasound techniques for the evaluation of hepatic fibrosis. Hepatology 43(6):1401-1402. Crossref |
||||
|
Cunningham, CH, Vigneron DB, Marjanska M, Chen AP, Xu D, Hurd RE, Kurhanewicz J, Garwood M, Pauly JM (2005). Sequence design for magnetic resonance spectroscopic imaging of prostate cancer at 3 T. Magn. Reson. Med. 53(5):1033-9. Crossref |
||||
|
Farrell GC, Larter CZ (2006). Nonalcoholic fatty liver disease: from steatosis to cirrhosis. Hepatology 43(2 Suppl 1):S99-S112. Crossref |
||||
|
Fischbach F, Bruhn H (2008). Assessment of in vivo 1H magnetic resonance spectroscopy in the liver: a review. Liver Int. 28(3):297-307. Crossref |
||||
|
Hamer, OW, Aguirre DA, Casola G, Lavine JE, Woenckhaus M, Sirlin CB (2006). Fatty liver: imaging patterns and pitfalls. Radiographics 26(6):1637-53. Crossref |
||||
|
Hom, JJ, Coakley FV, Simko JP, Qayyum A, Lu Y, Schmitt L, Carroll PR, Kurhanewicz J (2006). Prostate cancer: endorectal MR imaging and MR spectroscopic imaging--distinction of true-positive results from chance-detected lesions. Radiology 238(1):192-9. Crossref |
||||
|
Hoofnagle JH (2002). Course and outcome of hepatitis C. Hepatology 36(5 Suppl 1):S21-9. Crossref |
||||
|
Ishak, K, Baptista A, Bianchi L, Callea F, De Groote J, Gudat F, Denk H, Desmet V, Korb G, MacSween RN, et al. (1995). Histological grading and staging of chronic hepatitis. J. Hepatol. 22(6):696-9. Crossref |
||||
|
Joseph AE, Saverymuttu SH (1991). Ultrasound in the assessment of diffuse parenchymal liver disease. Clin. Radiol. 44(4):219-21. Crossref |
||||
|
Liaw YF, Sung JJ, Chow WC, Farrell G, Lee CZ, Yuen H, Tanwandee T, Tao QM, Shue K, Keene ON, Dixon JS, Gray DF, Sabbat J, and Cirrhosis Asian Lamivudine Multicentre Study Group (2004). Lamivudine for patients with chronic hepatitis B and advanced liver disease. N. Engl. J. Med. 351(15):1521-31. Crossref |
||||
|
Longo R, Pollesello P, Ricci C, Masutti F, Kvam BJ, Bercich L, Croce LS, Grigolato P, Paoletti S, de Bernard B, et al. (1995). Proton MR spectroscopy in quantitative in vivo determination of fat content in human liver steatosis. J. Magn. Reson. Imaging 5(3):281-5. Crossref |
||||
|
Mehta SR, Thomas EL, Bell JD, Johnston DG, and Taylor-Robinson SD (2008). Non-invasive means of measuring hepatic fat content. World J. Gastroenterol. 14(22):3476-83. Crossref |
||||
|
Michaelis, T, Merboldt KD, Bruhn H, Hanicke W, Frahm J (1993). Absolute concentrations of metabolites in the adult human brain in vivo: quantification of localized proton MR spectra. Radiology 187(1): 219-27. Crossref |
||||
|
Opstad, KS, Bell BA, Griffiths JR, Howe FA (2008). An investigation of human brain tumour lipids by high-resolution magic angle spinning 1H MRS and histological analysis. NMR Biomed. 21(7): p. 677-85. Crossref |
||||
|
Pearlman BL (2012). Protease inhibitors for the treatment of chronic hepatitis C genotype-1 infection: the new standard of care. Lancet Infect. Dis. 12(9):717-728. Crossref |
||||
|
Ratziu V, Charlotte F, Heurtier A, Gombert S, Giral P, Bruckert E, Grimaldi A, Capron F, Poynard T (2005). Sampling variability of liver biopsy in nonalcoholic fatty liver disease. Gastroenterology 128(7):1898-906. Crossref |
||||
|
Rector RS, Thyfault JP, Wei Y, Ibdah JA (2008). Non-alcoholic fatty liver disease and the metabolic syndrome: an update. World J. Gastroenterol. 14(2):185-192. Crossref |
||||
|
Regev A, Berho M, Jeffers LJ, Milikowski C, Molina EG, Pyrsopoulos NT, Feng ZZ, Reddy KR, Schiff ER (2002). Sampling error and intraobserver variation in liver biopsy in patients with chronic HCV infection. Am. J. Gastroenterol. 97(10):2614-2618. Crossref |
||||
|
Ross B, Bluml S (2001). Magnetic resonance spectroscopy of the human brain. Anat. Rec. 265(2):54-84. Crossref |
||||
|
Rubbia-Brandt L, Fabris P, Paganin S, Leandro G, Male PJ, Giostra E, Carlotto A, Bozzola L, Smedile A, Negro F (2004). Steatosis affects chronic hepatitis C progression in a genotype specific way. Gut 53(3): 406-12. Crossref |
||||
|
Saadeh S, Younossi ZM, Remer EM, Gramlich T, Ong JP, Hurley M, Mullen KD, Cooper JN, Sheridan MJ (2002). The utility of radiological imaging in nonalcoholic fatty liver disease. Gastroenterology 123(3): 745-50. Crossref |
||||
| Szczepaniak LS, Babcock EE, Schick F, Dobbins RL, Garg A, Burns DK, McGarry JD, Stein DT (1999). Measurement of intracellular triglyceride stores by H spectroscopy: validation in vivo. Am. J. Physiol. 276(5 Pt 1):E977-89. | ||||
|
Szczepaniak LS, Nurenberg P, Leonard D, Browning JD, Reingold JS, Grundy S, Hobbs HH, Dobbins RL (2005). Magnetic resonance spectroscopy to measure hepatic triglyceride content: prevalence of hepatic steatosis in the general population. Am. J. Physiol. Endocrinol. Metab. 288(2):E462-8. Crossref |
||||
|
Thomas EL, Hamilton G, Patel N, O'Dwyer R, Dore CJ, Goldin RD, Bell JD, Taylor-Robinson SD (2005). Hepatic triglyceride content and its relation to body adiposity: a magnetic resonance imaging and proton magnetic resonance spectroscopy study. Gut 54(1):122-127. Crossref |
||||
|
Williams R (2006). Global challenges in liver disease. Hepatology 44(3): 521-526. Crossref |
||||
Copyright © 2024 Author(s) retain the copyright of this article.
This article is published under the terms of the Creative Commons Attribution License 4.0


