ABSTRACT
The study evaluated developmental responses associated with plant population density stress applied at different phenological phases and effects on grain yield in determinate and indeterminate soybean (Glycine max L.). A split-split plot design with four replications, with variety (main plot), plant density (sub plot) and thinning time (sub-subplot) was adopted. Two determinate genotypes (Lukanga and SC Semeki) and an indeterminate type (Mwembeshi) were used. Plant density stress was imposed by planting at supra optimal densities (700, 600 and 500 K plants ha-1) (K representing 1000) and stress was removed by thinning to the recommended density (400 K plants ha-1) at different phenological stages. Plant density had little effect on grain yield. Thinning time influenced root to shoot ratio, number of grains per pod, yield and harvest Index (HI). Lukanga had the highest grain yield (2.43 tons ha-1), followed by Mwembeshi (1.95 tons ha-1) and lastly SC Semeki (1.17 tons ha-1). Lukanga exhibited reproductive plasticity, while SC Semeki showed vegetative plasticity. Mwembeshi an indeterminate type suggested non-plastic or ‘elastic’ response. The lack of effect on planting density exemplified by constant yield at different plant densities suggests that maintaining low seed rates is more economical given the high cost of seed.
Key words: Partitioning, determinate, indeterminate, reproductive plasticity, vegetative plasticity.
Soybean (Glycine max (L.) Merrill), is an oilseed crop that is produced worldwide in varying environments (FAO, 2016). It is one of the field row crops that manifest general growth characteristic of having phenotypic plasticity, a concept which enables plants to counter environmental stresses (Mataa and Sichilima, 2019). Resource competition imposed by high plant population density results in a negative growth relationship per unit plant as recorded by Pacala and Tilmant (1994). This notion was confirmed byIbrahim (2012)and Li et al. (2019)who observed that as competition for environmental resources (e.g. light, nutrients, moisture among others) increased, through increased plant population density, there were decreases in individual plant biomass accumulation and this phenomenon was associated with assimilate allocation plasticity (Rondanini et al., 2017; Ibrahim, 2012).
In row crops, where intraspecific competition is at play, plants tend to utilize their biomass allocation plasticity capacities in order to ‘win’ (Yang et al., 2019). Yang et al. (2019)suggested that in severe asymmetric competition, plants allocated more of their biomass to plant parts that gave them a competitive edge in accessing resources in limitation (such as moisture and light). Hence plants may partition more assimilates to the below- ground tissues (like roots) and to support structures (e.g. stems and petioles). When competition is asymmetric, it results in weaker plants being out competed and the vigorous plants induced into positive morpho-physiological responses (Mellendorf, 2011; Rondanini et al., 2017). Park et al. (2003)described that asymmetric competition results when smaller plants get a disproportionately lower share of the available resources from the environment to their detriment because larger plants have had excessively higher share of the resource in question to the point of limiting growth and productivity of the surrounding plants (Yang et al., 2019).
As suggested by Bradshaw (1965), phenotypic plasticity induces a positive morphophysiological response that raises the plants’ resource acquisition competitiveness per unit photoassimilate produced, thereby enhancing the plants’ development capacity despite the resource limitation (Craine and Dybzinski, 2013). This concept shows that the plasticity is functional at some critical phenological stage of a plant (Mataa and Sichilima, 2019). Thus, early relief (in the developmental cycle) of the induced stress due to high plant population density (by thinning of weaker plants), theoretically builds the plants yield capacity (Mellendorf, 2011; Rondanini et al., 2017). Plasticity responses to adverse environmental cues that are restricted to vegetative phenotypic traits are referred to as vegetative plasticity (Rondanini et al., 2017). In contrast, reproductive plasticity was described by Sultan (2003)as adjustments to phenotypic traits that directly affect the reproductive success of a plant in response to various environmental stress signals.
During the process of plant development, many physiological processes that occur are controlled by plant hormones available only at specific growth stages (Maggio et al., 2018). Accurate determination of the different growth stages is critical for growth environment manipulation to influence plant development and determine potential yield loss from environmental stresses (Wright and Lenssen, 2013; Agalave, 2017). In soybeans however, the phenological stage at which plants can exhibit plasticity responses after thinning when exposed to high plant population density is not well known.
According to classical phenotype plasticity (Bradshaw, 1965; Sultan, 2003), two forms of plasticity are recognized -morphological and physiological - each with different mechanisms, resource costs and ecological implications (Bradshaw, 1965; Murren et al., 2015). The first form is meristematic in character and involves the replacement of existing tissues by new plant parts with different phenotypic characteristics: it appears to represent a high-cost solution to a change in environment (Grime and Mackey, 2002). The second- physiological plasticity- occurs in differentiated tissues and is associated with visually imperceptible changes in properties brought about by reversible sub-cellular rearrangements: here the costs are lower and the response can be much more rapidly achieved than in morphological plasticity (Mooney and Gulman, 1979; Grime and Mackey, 2002).
In an earlier study (Mataa and Sichilima, 2019), it was observed that soybean responses to stress were plastic with a range of alternative pathways or phenotypes. Additionally, stress caused plants to adopt certain phenotypes and generally no recovery or change was possible thereafter. Furthermore, these responses appeared to be dependent on the genotype and phenological stage at which stress was applied.
In this paper, we examined whether other responses were possible and/or whether plants can exhibit non-plastic or ‘elastic’ responses whereby previously stressed plants were able to recover and achieve normal yield. The main objective of the study was to determine the extent to which plant density and thinning time influence crop development and yield in soybeans, thus the study evaluated more detailed environmental responses in soybeans. Determinate and indeterminate soybean varieties were subjected to a wider range of supra- optimal planting density stress which was removed at different phenological stages and the recovery or elasticity was monitored.
Location
The experiment was conducted in the 2016 planting season at Mansa Research Station, Zambia (latitude 11° 14’ 27.0” S and longitude 28° 57’ 23.2” E) which is located in Agro-ecological Region III that is characterized by high rainfall of about 1200 mm (Chileshe and Chirwa, 1990). The site which had been fallow for two years have an elevation of 1231 m above sea level. The soils were classified as Acrisols according to the Food and Agriculture Organization (FAO, 2001) classification system. The soils were acidic with a pH of 4.4.
Plant materials
The following soybean varieties were used: Mwembeshi, an indeterminate type, self nodulating and an early maturing variety developed by IITA; Lukanga a medium maturing, determinate and non-self nodulating variety from ZamSeed Company; SC Semeki, a determinate type from SeedCo and non-self nodulating variety with a medium maturity (SeedCo, 2015; Chigeza et al., 2019).
Experimental design and treatments
A split-split plot design with variety, planting density and thinning time assigned to the main plot, subplot and sub-subplot respectively was used in the study. The smallest unit plot measured 1.5 m by 1.5 m. The recommended plant density for Zambia of 400,000 plants ha-1 (or 400 K plants ha-1, where K denote 1000) was used as a control (Mitti, 1995). Three supra normal plant density levels (500 K; 600 K and 700 K plants ha-1) were adopted at planting and thinned down progressively to the 400 K control density level at V0, V4, R1 and R8 phenological stages (Wright and Lenssen, 2013). Hence the experimental variants were: V0 was at planting before emergence; V4 (five nodes with 4 unfolded trifoliate), R1 was the onset of the reproductive growth phase, where the plant has developed at least one open flower at any node and R8 was when the plant reached full maturity and at least 95% of the pods had attained their full maturity color (Fehr et al., 1971; Wright and Lenssen, 2013). In practice, V0 was maintained with no thinning.
Cultural practices
Standard soybean production guidelines were followed (Mitti, 1995). Briefly, prior to seeding, the land was ploughed and subjected to harrowing. Each plot was applied with a stimulative dose (33 kg ha-1) of granular D-compound (NPK 10:20:10+6S) fertilizer as recommended. In the early stages of crop development, the nitrogen-fixing systems is inoperative, hence the need to apply an external nitrogen (N) to meet the plants’ demand (Oyatokun and Oluwasemire, 2014). Planting was done on 9th January, 2016. Seeds were drilled by hand and thus the spacing ranged from 2.5 to 7 cm within rows to achieve the different planting densities. In all treatments, a 30 cm distance between rows was maintained. The seeds were inoculated with rhizobia (Rhizobium leguminosarum) at the time of seeding; hand weeding, pests and disease control were done as the need arose; supplemental irrigation was done only when the rains were inadequate and soil moisture was deemed to be below field capacity. Further, harvesting was done by hand approximately 120 days after sowing (DAS) when the crop had reached physiological maturity (8th to 10th May 2016).
Data collection
The following vegetative parameters were monitored.
Plant height: Using a hand rule, five randomly selected plants were placed in a sub-subplot; thereafter, plant height were measured from the base to the uppermost shoot tip and expressed as a mean of the five individual plants at R1 and R8 growth stages. Using destructive sampling, five plants were harvested carefully from the border roles, fresh weights were taken and thereafter the samples were air-dried under shade (for about 2 weeks) to constant mass and then reweighed to determine total dry biomass weight (at V4 and R8).
Root-shoot weight ratio: The fresh and dry mass of the below ground and above ground dry biomass from five randomly selected plants were taken at V4 phenological stage. Means of the five plants were used to compute the root and shoot ratios expressed as percentages (at V4).
The reproductive parameters that were monitored include
Number of pods per plant: This was determined by taking counts of number of pods at maturity (R8) of the five randomly selected plants.
Grains per pod: This was determined at harvest by counting the number of grains from five randomly selected plants and expressed as a mean value.
100-grain weight: This was measured by taking a triplicate sample of 100 grains per subplot of soybeans at harvest to come up with a representative mean weight.
Grain yield: This was determined from each plot by weighing the total grains harvested in the net plot (excluding guard rows) and expressed in tons per hectare.
Harvest index (HI): This was computed at harvest by dividing grain yield with the total dry biomass yield.
Statistical analysis
Data was analyzed using GenSTAT (version 18) (VSN, 2015) and graphical illustrations were generated using Microsoft Excel. Data were subjected to analysis of variance, correlation and multiple regression. Where differences were considered significant, mean separation was done using the least significant differences method.
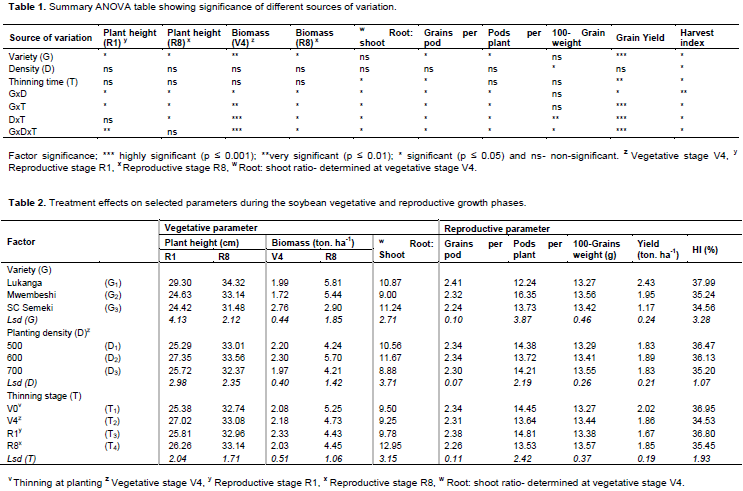
Yield was highly influenced by variety (p ≤ 0.001). Biomass at V4 was very significantly influenced by variety (G) (p ≤ 0.01) (Table 1). Plant heights, biomass at R8, grains per pod, number of pods per plant and harvest index were significantly influenced by variety (p ≤ 0.05). Plant density (D) had no significant effect on most parameters (p > 0.05) except for biomass at R8, 100-grain weight and harvest index (p ≤ 0.05). Thinning (T) influenced significantly root to shoot weight, grains per pod and harvest index (p ≤ 0.05). Thinning stage affected yield very significantly (p ≤ 0.01) while root to shoot ratio, grains per pod and HI were significantly affected (p ≤ 0.05). There were significant interactions between treatment factors (Table 1).
Vegetative parameters
Plant height
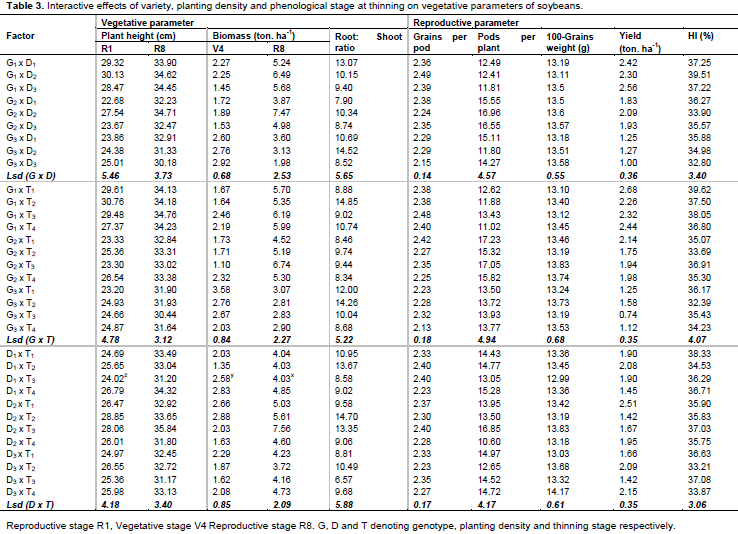
The main factor showed that Lukanga had significantly taller plants followed by Mwembeshi and SC Semeki was the shortest (Table 2). Density and thinning did not show single factor effects. The interactive effects of variety with density and thinning were significant (p < 0.05), particularly on Lukanga at all levels of density and for thinning at V0, V2 and R1 phenological stages (Table 3) when measurements were taken at the end of the vegetative growth phase (R1). The interaction of Lukanga with all levels of density and thinning at the maturity stage (R8) of the plants was significant. The interaction of Variety x Density x Thinning time at the R1 growth phase was very significant, specifically for Lukanga (32.61 cm) and Mwembeshi (32.04 cm) at density 600 K plants ha-1 which were thinned at V2 and R1 respectively (Figure 1).
Biomass
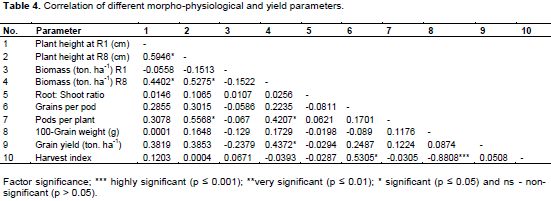
Early in the growth cycle at V4, SC Semeki had significantly higher biomass (2.76 tons ha-1) than the other two varieties (1.8 tons ha-1) (Table 2). But the opposite was true at R8, where Lukanga (5.81 tons ha-1) and Mwembeshi (5.44 tons ha-1) had significantly more biomass than SC Semeki (2.90 tons ha-1). The main effects of density and thinning time were not significant on biomass. The results showed that all interactions were significant for biomass at both measurement stages (V4 and R8). An interesting contrast was that SC Semeki showed significant effects at all levels of density at the V4 stage, while Lukanga exhibited the same but at the R8 stage for all the density levels. Figure 2 shows the variety x density x thinning interaction where Lukanga, at 500 K plants ha-1, had biomass that increased with delay in thinning. At 700 K plants ha-1, the biomass reduced with delayed thinning. For Mwembeshi at 600 K and 700 K, biomass tended to decline with delayed thinning time. For SC Semeki at 500 K and 600 K plants ha-1, biomass declined with a delay in thinning time. At 700 K plants ha-1, it increased with the delay in the thinning time.
Root to shoot ratio
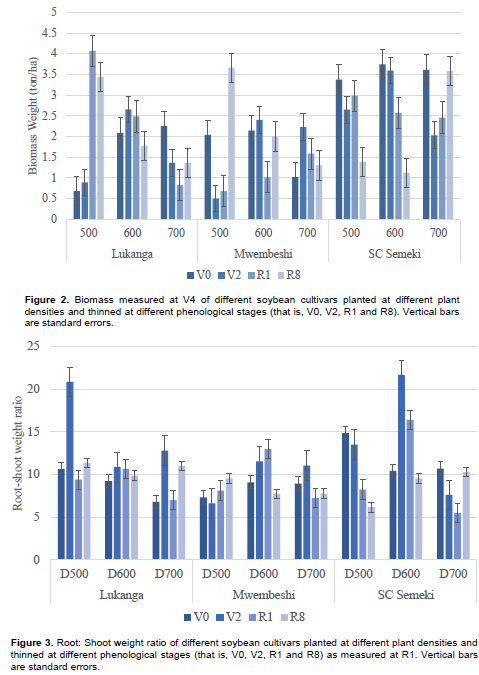
Only thinning time (T) showed a significant main effect on root: shoot ratio. Thinning time interacted significantly with variety and planting density (Table 3). The highest root to shoot ratio was seen in the combination of Lukanga with V2 thinning time (14.85%) followed by the density 500 K plants ha-1 with V2 thinning time (14.70%), and variety SC Semeki by density 600 K plants ha-1 (14.52%). In terms of variety x density x thinning time interactions (Figure 3), thinning for Lukanga at the V2 growth phase generally resulted in higher root to shoot weight ratio across planting densities. Density 600 K plants ha-1 resulted in the highest ratios for Lukanga and Mwembeshi when thinned at V2 and R1 respectively. SC Semeki demonstrated the propensity to reduce the root to shoot ratio for every successive thinning stage across density levels. The highest ratio across all varieties and densities was observed in SC Semeki at density 600 K and thinning at V2 (21.68%) while the least was recorded in the same variety (G3) but at the density of 700 K and thinning at R1 (5.42%).
Reproductive parameters
Number of grains per pod
As presented in Table 2, Lukanga had the highest number of grains per pod (2.41) in comparison to Mwembeshi (2.32) and SC Semeki (2.24). Plant density did not show significant main effect on number of grains, but thinning did at the R1 stage of growth. All the interactions were significant, particularly on Lukanga which recorded the highest number of grains per pod at the density of 600 plants ha-1. Lukanga was further affected significantly at all levels of thinning. The interaction of density with thinning (D x T) was significant at 500 K plants ha-1 during V2 and R1 thinning stages and at 600 K plants ha-1 which was thinned at the R1 growth stage.
Number of pods per plant
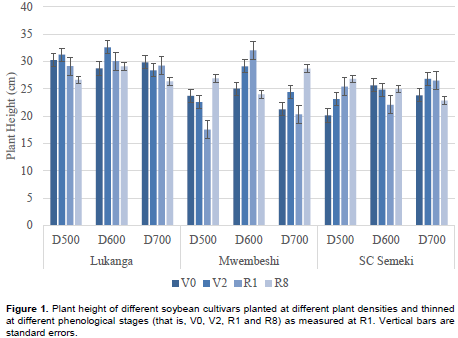
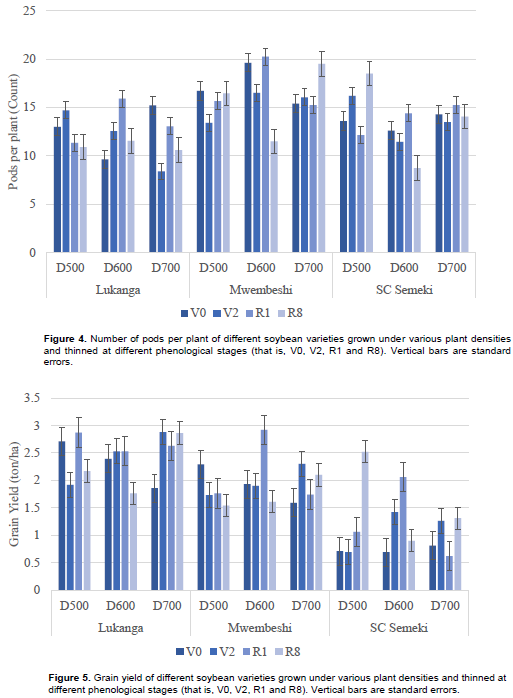
Mwembeshi had significantly more pods per plant (16.35), compared to Lukanga (12.24) and SC Semeki (13.73) as shown in Table 2. However, all the interactions on the number of pods per plant were significant (Table 3), particularly for Mwembeshi with density 600 K plants ha-1 (16.96) and 700 K plants ha-1 (16.55) and for Mwembeshi with thinning times V0 (17.23) and R1 (17.05). Density had no significant influence on pod number except when the 600 K plants ha-1 were thinned at R1 (16.85). In terms of the variety x density x thinning time interactions, Mwembeshi, showed that the number of pods increased when thinning was delayed at lower density. At higher densities, however, delayed thinning reduced the number of pods per plant (Figure 4).
Grain weight
Plant density exhibited significant effects only on single effects on grain weight and the highest was observed in 700 K plants ha-1 (13.55 g) and the least in 500 K plants ha-1 (13.29 g) (Table 2). In the density by thinning interaction, the highest grain weight was recorded in the 700 K plants ha-1 at R8 thinning stage combination and the least was in 500 K plants ha-1 by R1 thinning time. Mwembeshi at density 600 K plants ha-1 thinned at R1 (15.07 g) and exhibited the highest grain weight. The lowest was observed in the interaction of SC Semeki at density 500 K plants ha-1 when it was thinned at R1 (12.28 g) (Table 3).
Grain yield
Grain yield varied from 1.17 tons ha-1 exhibited by SC Semeki to 2.43 tons ha-1 exhibited by Lukanga. Mwembeshi yielded 1.95 tons ha-1, which was significantly different from the other two varieties. Across density, thinning at V0 yielded the highest (2.02 tons ha-1) grains (Table 2). Lukanga had significantly higher yield than the other varieties at all density levels. Lukanga also showed the highest yield (2.68 tons ha-1) when thinned at the R1 growth stage. SC Semeki scored the least yield (0.74 tons ha1) at when it was thinned at the V0 phenological stage. The 600 K plants ha-1 density exhibited the highest yield (2.51 tons ha-1) when it was thinned at R1. For the density x thinning interaction, the lowest yield (1.42 tons ha-1) was observed at the 700 K plants ha-1, thinned at V0 (Table 3). In the variety x density x thinning time interaction (Figure 5), the highest overall yield (2.92 tons ha-1) was recorded in Mwembeshi at 600 K plants ha-1 when thinned at R1. Unthinned treatments (at R8) resulted in least grain yield, 1.76- and 1.54- tons ha-1 for Lukanga (at 600 K plants ha-1) and Mwembeshi (at 500 K plants ha-1), respectively. The overall lowest yield (0.62 tons ha-1) was recorded in SC Semeki at 500 K plants ha-1 when thinned at the R1 growth stage.

Harvest index
Lukanga had the highest harvest index (0.379) and it was significantly different from SC Semeki (0.345) but not from Mwembeshi (0.352) as demonstrated in Table 2. The 500 K plants ha-1 density had the highest HI (0.365) which was significantly different from 700 K plants ha-1 (0.352) but not from 600 K plants ha-1 (0.361). Thinning at R1 resulted in the highest HI (0.37) and the least was recorded in treatments thinned at R8 (0.35). Lukanga recorded the highest HI when it interacted with density and thinning time at 600 K plants ha-1 (0.395) and V0 (0.396), respectively. The highest density by thinning interaction HI was achieved at 500 K plants ha-1 thinned at V0. Lukanga had the highest HI at 600 K plants ha-1 when thinned at R1. There were tendencies for lower densities to increase HI when thinned early. Delayed thinning resulted to reduction in the HI particularly for Lukanga and SC Semeki varieties (Table 3).
Correlation
Table 4 shows that plant height at R8 was moderately positively correlated (r = 0.59*) to plant height at R1 (cm) parameters. Biomass at R8 (r = 0.44) and grain yield (r = 0.38) were weakly but positively correlated to plant height at R1. Plant height at R8 had a moderately positive correlation to BM at R8 (r = 0.53*) and to the number of pods per plant (r = 0.55*). Grain yield was weakly positively correlated to BM at R8 (r = 0.43). There was a moderately positive correlation (r = 0.53*) between the number of grains per pod and HI. HI was strongly but negatively correlated (r = -0.88***) to grain weight.
The environment under which organisms develop has influence on resulting morphological and physiological characteristics. Due to their sessile nature, plants cannot move and have to contend with limitations of their environment or stress in situ. Thus, to survive and remain productive, appropriate functional plasticity responses are inevitable (Bradshaw, 1965; Takahashi and Shinozaki, 2019). Using various signaling pathways such as Reactive Oxygen Species (ROS), phytochromes and an interaction of physiological metabolites with phytohormones at subcellular level, plants invoke morphophysiological plasticity that builds their competitive effectiveness at resource mobilization (Bradshaw, 1965; Wani et al., 2016; Mhamdi and Van Breusegem, 2018; Takahashi and Shinozaki, 2019; Wahid et al., 2007). Plant density is one of the most pliable factors that can be altered in the row crop growth environment to improve crop production (Wright and Lenssen, 2013).
Effect on vegetative parameters
Variety had significant effects on all vegetative parameters except on root to shoot ratio. Lukanga had the highest plant height (at R1 and R8) and biomass (R8), which was significantly different from the other two. Contrasting performance of Lukanga and SC Semeki despite both being determinate varieties was also found by Mataa and Sichilima (2019)cannot be explained only on the basis of growth characteristics but other genetic parameters (Tekola et al., 2018).
SC Semeki accumulated higher biomass during the vegetative phase than in the reproductive phase. Biomass and root-shoot ratio are important indicators of plant vigour in an environment where interplant competition exists (Yang et al., 2019). Plants with higher biomass accumulation and comparative root mass are more competitive in accessing nutrients and moisture (Craine and Dybzinski, 2013). The reduction in biomass accumulation we observed for SC Semeki in comparison to other varieties could be attributed to vegetative allocational plasticity (Mataa and Sichilima, 2019), an important trait in resource competition (Sultan, 2003). Similar effects have also been observed in perennial plants during the immature phase (Mataa and Tominaga, 1998a). It can, therefore, be suggested that the value of SC Semeki is more as a vegetative or forage use.
Planting density showed no significant effects except on root: shoot ratio. Our findings on plant height were similar to the observation made by Mellendorf (2011), who associated the slight decrements/increments between densities to general plant growth due to row spacing and to the decreased/increased access to photosynthetically active radiation (Mataa and Tominaga, 1998b; Park and Runkle, 2018). A similar study by Sichilima et al. (2018)showed similar findings, where density had no significant effects on the plants.
Maintaining the crop without thinning up to R8 appeared to increase root to shoot ratio. The increased root biomass in relation to above-ground biomass can be attributed to the sustained stress. Plants invoke photoassimilates allocational plasticity (Murren et al., 2015)when under stress which increases photoassimilates partitioning to roots hence increasing root surface area to forage and competing for resources in the root zone (Rondanini et al., 2017).
The findings on three-way interactions suggested that for Lukanga, plant height was stable across planting densities and thinning times. Mwembeshi had lowest plant height at the 500 K density. Thereafter, it increased to reach a maximum at 600 K and fell at 700 K. SC Semeki showed a similar trend, but it was true only for V0 and V2. Generally, delaying thinning reduced plant height for Lukanga but did not for Mwembeshi and SC Semeki. Biomass decreased with planting density in Lukanga, was stable for SC Semeki across plant densities, whereas Mwembeshi was intermediate. In all, genotypes delaying thinning reduced biomass.
Effect on reproductive parameters
The number of grains per pod, number of pods per plant and grain weight are important yield components (Pereira-Flores and Justino, 2019). Lukanga had a significantly higher number of grains per pod while Mwembeshi had higher number of pods per plant contributing to significantly higher grain yields. Mwembeshi, an indeterminate variety responded by developing more pod than increasing grain weight. Rondanini et al. (2017)observed reproductive plasticity in spring rapeseed to be related to floral branching. Based on our results, we postulate that Lukanga, a determinate variety exhibited reproductive plasticity mainly due to the changes in the number of grains per pod. Mwembeshi, on the other hand, exhibited reproductive plasticity related to the number of pods per plant. The response in Mwembeshi is in conformity with the established theory that modular organisms have compensatory capabilities to any adverse shocks faced during plant growth (Murren et al., 2015). Agudamu et al. (2016)concluded that modular plants have a longer period over which they have to adjust to environmental stress through branch, leaf area or pod number development.
Thinning early exerted significant effects on grain yield and harvest index. Relieving the imposed density stress after the plants have fully enabled development of competitive capacities for environmental resources in the early phenological stages and allows the plants to concentrate on reproductive structures such as number of pods per plant (Mellendorf, 2011).
Plant density had little or no effect on reproductive and vegetative parameters. However, lower planting densities increased HI when thinning was done early. Similar results were observed by Shamsi and Kobraee (2011)who revealed that HI declined with an increase in plant density. Mellendorf (2011)made similar observations that large differences were apparent in the high plant density, where cohorts relieved of competition at V3 increased HI by 7.8% compared to competition relief at R4 where HI was reduced by 10%.
The three way interactions showed that grain yield was stable across plant density and thinning stages for Lukanga and Mwembeshi but it fell with increase in plant density for SC Semeki. SC Semeki showed slight increases in grain yield with plant density up to 600 K density then it declined again at 700 K density. Thus, SC Semeki had comparatively low yield at each thinning stage compared to the other two genotypes.
The positive, though weak correlation between grain yield and biomass weight (r = 0.43) suggested that larger plants tend to have higher yield.Mellendorf (2011)noted that treatments that had high biomass were also reported to have high number of branches, high number of pods per plant and higher grain yield. A close relationship between grain yield and biomass at R8 was shown by the regression analysis. Similar findings were obtained by Duncan (1986)who associated higher biomass to higher grain yields. Sichilima et al. (2018)also concluded that biomass had the strongest effect on yield. The results suggest that plant phenotypic responses to the environment can be wider than alternative and unchangeable pathways suggested by current plasticity concepts (Grime, 1977; Sultan, 1992 and Sultan and Bazzaz, 1993).
Lukanga and SC Semeki are both determinate varieties but seem to follow different pathways in their responses to density stress. The lack of effect of planting density exemplified by yield being constant at different plant density (or failure to increase yield at high planting density) suggests that maintaining a low seed rate is more economical given the high cost of seed. Our results, especially with reference to Mwembeshi, suggest that in addition to typical plastic responses, soybeans can show non-plastic or ‘elastic responses’ allowing the plant to recover after stress is removed.
The authors have not declared any conflict of interests.
The authors are grateful to the Zambia Agriculture Research Institute (ZARI) Agricultural Programme Productivity Support project for the generous financial support. This work was part of the MSc. Agronomy study of the principal author at the University of Zambia.
REFERENCES
|
Agalave HR (2017). Effect of environmental factors on productivity of crop. International Journal of Botany Studies 2:14-16.
|
|
|
|
Agudamu Y, Yoshihira T, Shiraiwa T (2016). Branch development responses to planting density and yield stability in soybean cultivars. Plant Production Science 19:331-339.
Crossref
|
|
|
|
|
Bradshaw AD (1965). Evolutionary Significance of Phenotypic Plasticity in Plants. Advances in Genetics 13:115-155.
Crossref
|
|
|
|
|
Chigeza G, Boahen S, Gedil M, Agoyi E, Musholiwa H, Denwar N, Gondwe T, Tesfaye A, Kamara A, Alamu OE, Chikoye D (2019). Public sector soybean (Glycine max) breeding: Advances in cultivar development in the African tropics. Plant Breeding 138(4):455-464.
Crossref
|
|
|
|
|
Chileshe L, Chirwa B (1990). Soils of Mansa District-Soil Survey Report No. 186 D. Soil Survey Unit, Research Branch, Department of Agriculture. Ministry of Agriculture. Government of the Republic of Zambia.
|
|
|
|
|
Craine JM, Dybzinski R (2013). Mechanisms of plant competition for nutrients, water and light. Functional Ecology 27:833-840.
Crossref
|
|
|
|
|
Duncan WG (1986). Crop Ecology, Production and Management: Planting Patterns and Soybean Yields. Crop Science Journal 26:584-588.
Crossref
|
|
|
|
|
Food and Agriculture Organization (FAO) (2016). FAOSTAT. Food and Agriculture Organization of the United Nations, Rome, Italy. Available online at:
View
|
|
|
|
|
Food and Agriculture Organization (FAO) (2001). World Soil Resource reports: Lecture notes on the major soils of the world. In Driessen P, Deckers J, Nachtergaele F (eds.) Rome: Food and Agriculture Organization of the United Nations.
|
|
|
|
|
Fehr WR, Caviness CE, Burmood DT, Pennington JS (1971). Stages of development descriptions for soybean, Glycine max (L.) Merril. Crop Science 11:929-931.
Crossref
|
|
|
|
|
Grime JP (1977). Evidence for the existence of three primary strategies in plants and its relevance to ecological and evolutionary theory. American Naturalist 111:169-1194.
Crossref
|
|
|
|
|
Grime JP, Mackey JML (2002). The role of plasticity in resource capture by plants. Evolutionary Ecology 16:299-307.
Crossref
|
|
|
|
|
Ibrahim HM (2012). Response of some sunflower hybrids to different levels of plant density. APCBEE Procedia 4:175-182.
Crossref
|
|
|
|
|
Li J, Qu Z, Chen J, Yang B, Huang Y (2019). Effect of planting density on the growth and yield of sunflower under mulched drip irrigation. Water (Switzerland) 11:1-14.
Crossref
|
|
|
|
|
Maggio A, Bressan RA, Zhao Y, Park J, Yun D (2018). It's hard to avoid avoidance: Uncoupling the evolutionary connection between plant growth, productivity and stress "tolerance". International Journal of Molecular Sciences 19:36-71.
Crossref
|
|
|
|
|
Mataa M, Sichilima I (2019). Phenotypic plasticity in soybean (Glycine max (Merrill)) genotypes with contrasting growth characteristics subjected to planting density stress at different developmental stages. African Journal of Agricultural Research 14:643-651.
Crossref
|
|
|
|
|
Mataa M, Tominaga S (1998a). Reproductive-vegetative shoot growth interactions and relationship to non-structural carbohydrates in immature ponkan mandarin. (Citrus reticulata Blanco). Journal of Horticultural Science and Biotechnology 73:189-194.
Crossref
|
|
|
|
|
Mataa M, Tominaga S (1998b). The effects of shading stage and level on fruit set and development, leaf carbohydrates and photosynthesis in ponkan (Citrus reticulata Blanco). Japanese Journal of Tropical Agriculture 42:103-110.
|
|
|
|
|
Mellendorf NE (2011). Soybean growth and yield response to interplant competition relief in various plant density environments. MSc. Thesis (unpublished). University of Illinois at Urbana-Champaign, pp. 11-12. Available at:
View
|
|
|
|
|
Mhamdi A, Van Breusegem F (2018). Reactive oxygen species in plant development. Development (Cambridge). P. 145.
Crossref
|
|
|
|
|
Mitti JM (1995). Soybean (Glycine max (L.) Merr). In: Zambian Seed Technology Handbook. Muliokela SW. (ed.) Lusaka: Ministry o fAgriculture, Food and Fisheries. pp. 195-199.
|
|
|
|
|
Murren CJ, Auld JR, Ghalambor CK, Handelsman CA, Heskel MA, Kingsolver JG, Maclean HJ, Masel J, Maughan H, Pfenning DW, Relyea RA, Seiter S, Snell-Rood E, Steiner UK Schilichting CD (2015). Constraints on the evolution of phenotypic plasticity: Limits and costs of phenotype and plasticity. Heredity 115:293-301.
Crossref
|
|
|
|
|
Mooney HA, Gulman SL (1979). Environmental and evolutionary constraints on the photosynthetic characteristics of higher plants. In Topics in Plant Population Biology. Solbrig OT, Jain S, Johnson GB, Raven PH (eds,). Columbia University Press, New York. pp. 316-337.
Crossref
|
|
|
|
|
Oyatokun OS, Oluwasemire KO (2014). Evaluating starter N application to Soybean with CROPGRO-Soybean model in the Southern Guinea Savanna Agro-Ecology of Nigeria. Journal of Agricultural Science 6:83-100.
Crossref
|
|
|
|
|
Pacala SW, Tilmant D (1994). Limiting similarity in mechanistic and spatial models of plant competition in heterogeneous environments. The American Naturalist 143(2):222-257.
Crossref
|
|
|
|
|
Park SE, Benjamin LR, Watkinson AR (2003). The theory and application of plant competition models: An agronomic perspective. Annals of Botany 92:741-748.
Crossref
|
|
|
|
|
Park Y, Runkle ES (2018). Far-red radiation and photosynthetic photon flux density independently regulate seedling growth but interactively regulate flowering. Environmental and Experimental Botany 155:206-216.
Crossref
|
|
|
|
|
Pereira-Flores ME, Justino BF (2019). Yield components and biomass partition in soybean: Climate change vision. (Unpublished) Intechopen.
Crossref
|
|
|
|
|
Rondanini DR, Menendez YC, Gomez NV, Miralles DJ, Botto JF (2017). Vegetative plasticity and floral branching compensate low plant density in modern spring rapeseed. Field Crop Research 210:104-113.
Crossref
|
|
|
|
|
SeedCo (2015). Soybean growers guide. Available at:
View
|
|
|
|
|
Shamsi K, Kobraee S (2011). Soybean agronomic responses to plant density. Annals of Biological Research 2:168-173.
|
|
|
|
|
Sichilima I, Mataa M, Mweetwa AM (2018). Morpho-physiological and Yield Responses Associated with Plant Density Variation in Soybean (Glycine max (L.) (Merrill)). International Journal of Environment, Agriculture and Biotechnology 3:274-285.
Crossref
|
|
|
|
|
Sultan SE (2003). Phenotypic plasticity in plants: A case study in ecological development. Evolution and Development 5:25-33.
Crossref
|
|
|
|
|
Sultan S (1992). Phenotypic plasticity and the Neo- Darwinian legacy. Evolutionary Trends in Plants 6:61-71
|
|
|
|
|
Sultan SE, Bazzaz FA (1993). Phenotypic Plasticity in Polygonum persicaria. II. Norms of Reaction to Soil Moisture and the Maintenance of Genetic Diversity. Evolution 47:1032-1049.
Crossref
|
|
|
|
|
Takahashi F, Shinozaki K (2019). Long-distance signaling in plant stress response. Current Opinion in Plant Biology 47:106-111.
Crossref
|
|
|
|
|
Tekola T, Yoseph T, Worku W (2018). Biological and inorganic fertilizer applications improved growth, nodulation and yield of soybean (Glycine max L.) varieties. International Journal of Current Research 10:68855- 68862.
|
|
|
|
|
VSN International (2015). Genstat for Windows 18th Edition. VSN International, Hemel Hempstead, UK. Available at:
View
|
|
|
|
|
Wahid A, Gelani S, Ashraf M, Foolad MR (2007). Heat tolerance in plants: An overview. Environmental and Experimental Botany 61:199-223.
Crossref
|
|
|
|
|
Wani SH, Kumar V, Shriram V, Sah SK (2016). Phytohormones and their metabolic engineering for abiotic stress tolerance in crop plants. Crop Science 4:162-176.
Crossref
|
|
|
|
|
Wright D, Lenssen AW (2013). Staging soybean development. Agriculture and Environment Extension Publications 191:1- 3.
|
|
|
|
|
Yang X, Zhang W, He Q (2019). Effects of intraspecific competition on growth, architecture and biomass allocation of Quercus liaotungensis. Journal of Plant Interactions 14:284-294.
Crossref
|
|